
YouTube Video Review version:
Information
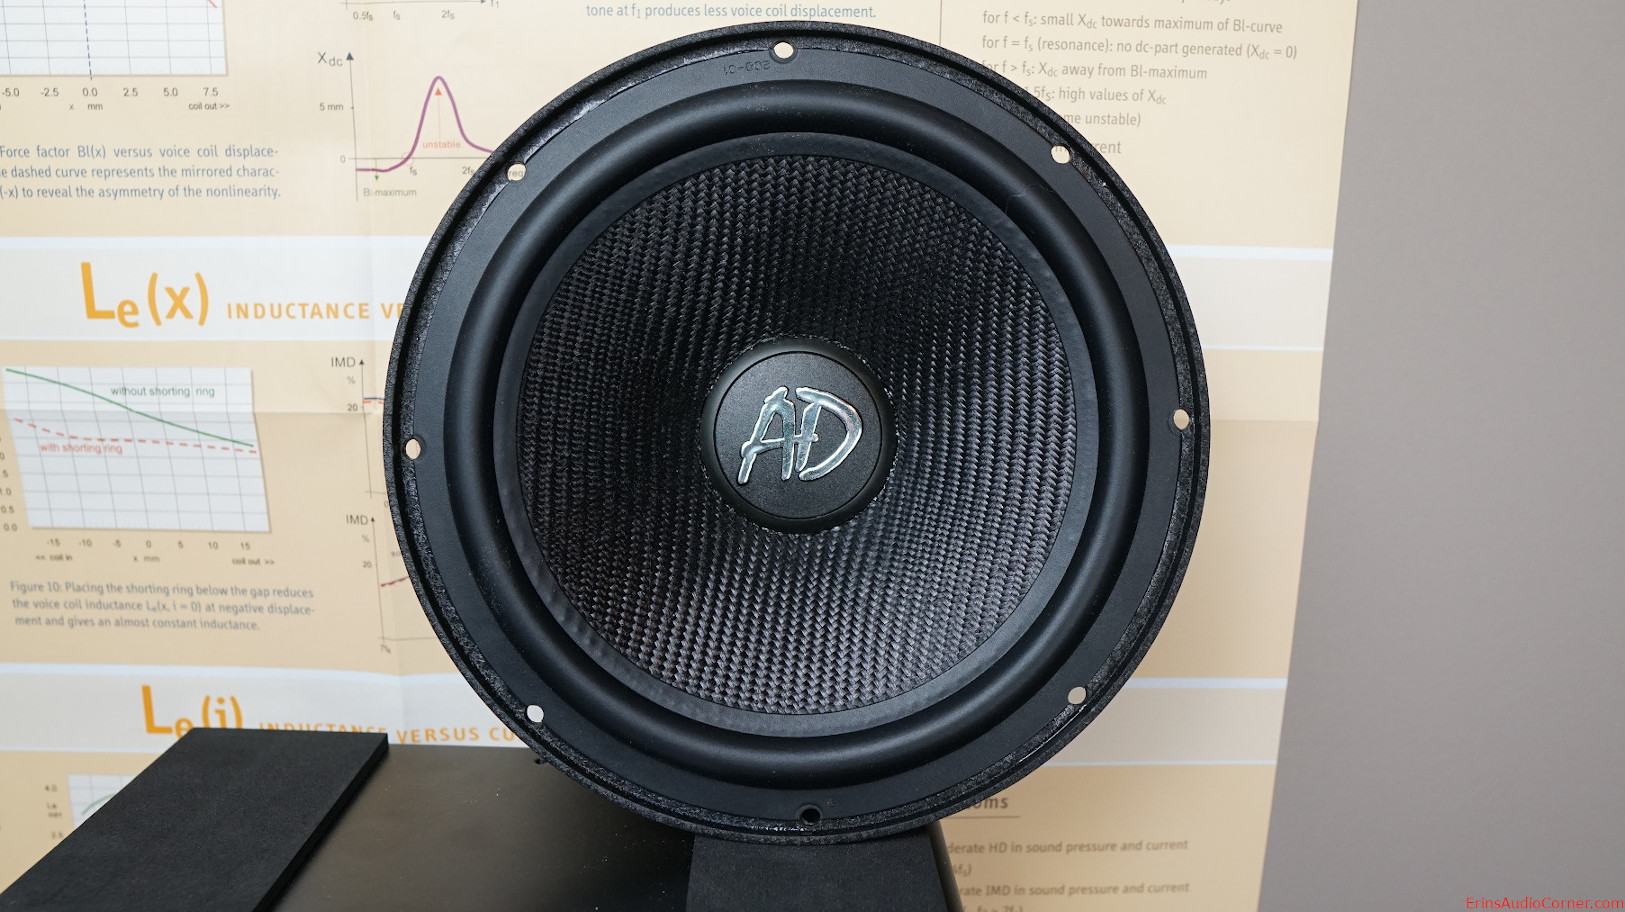
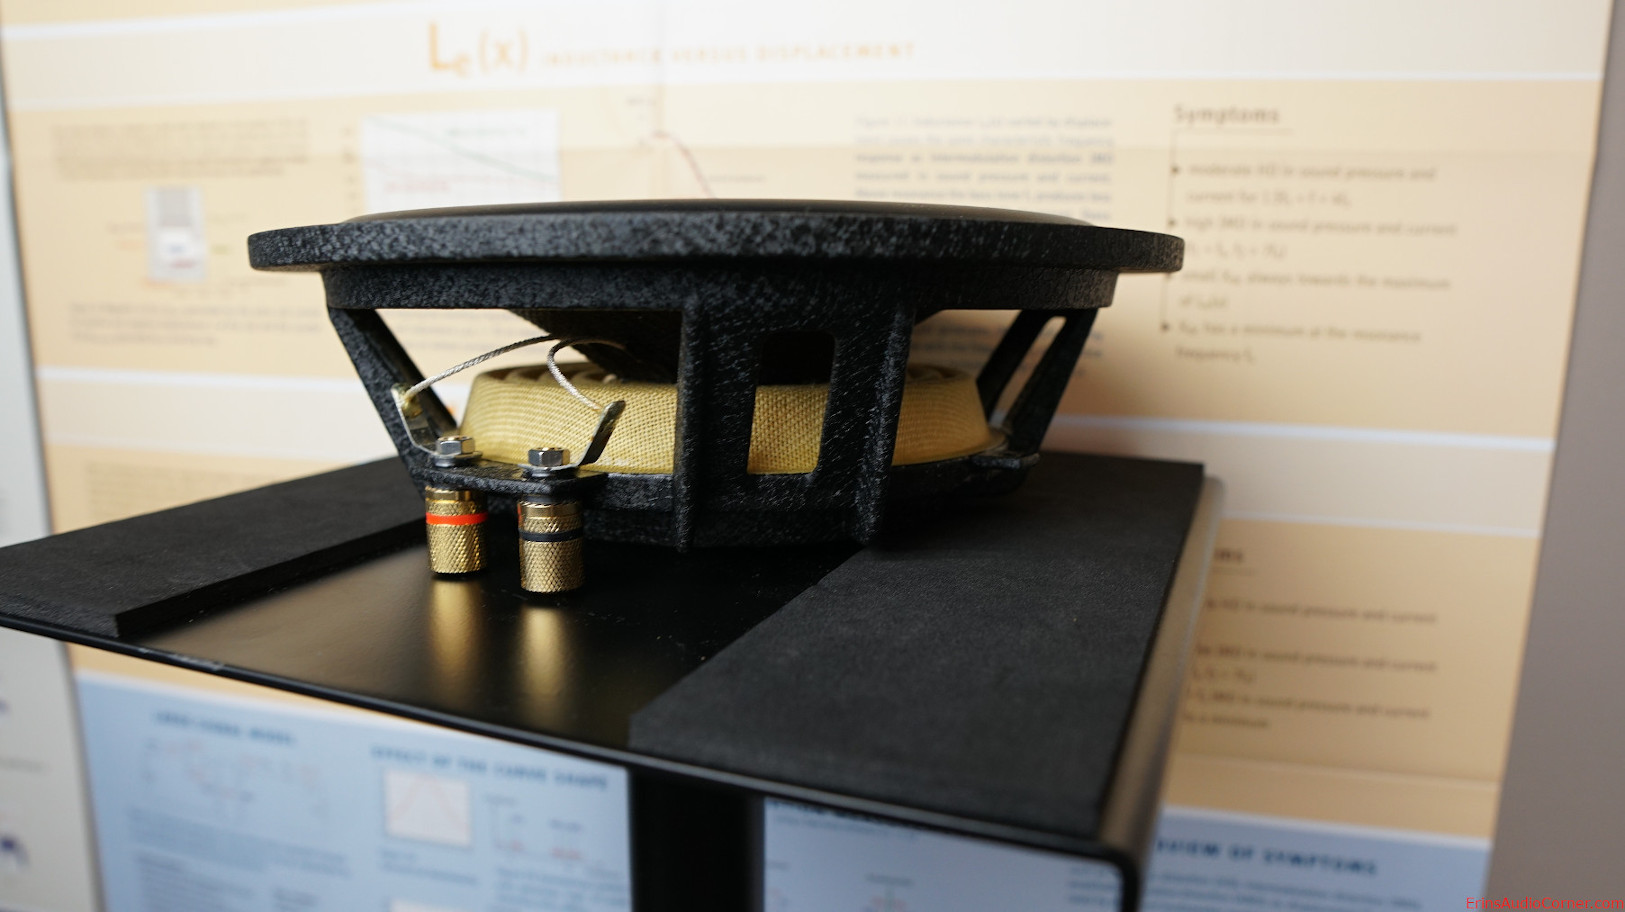
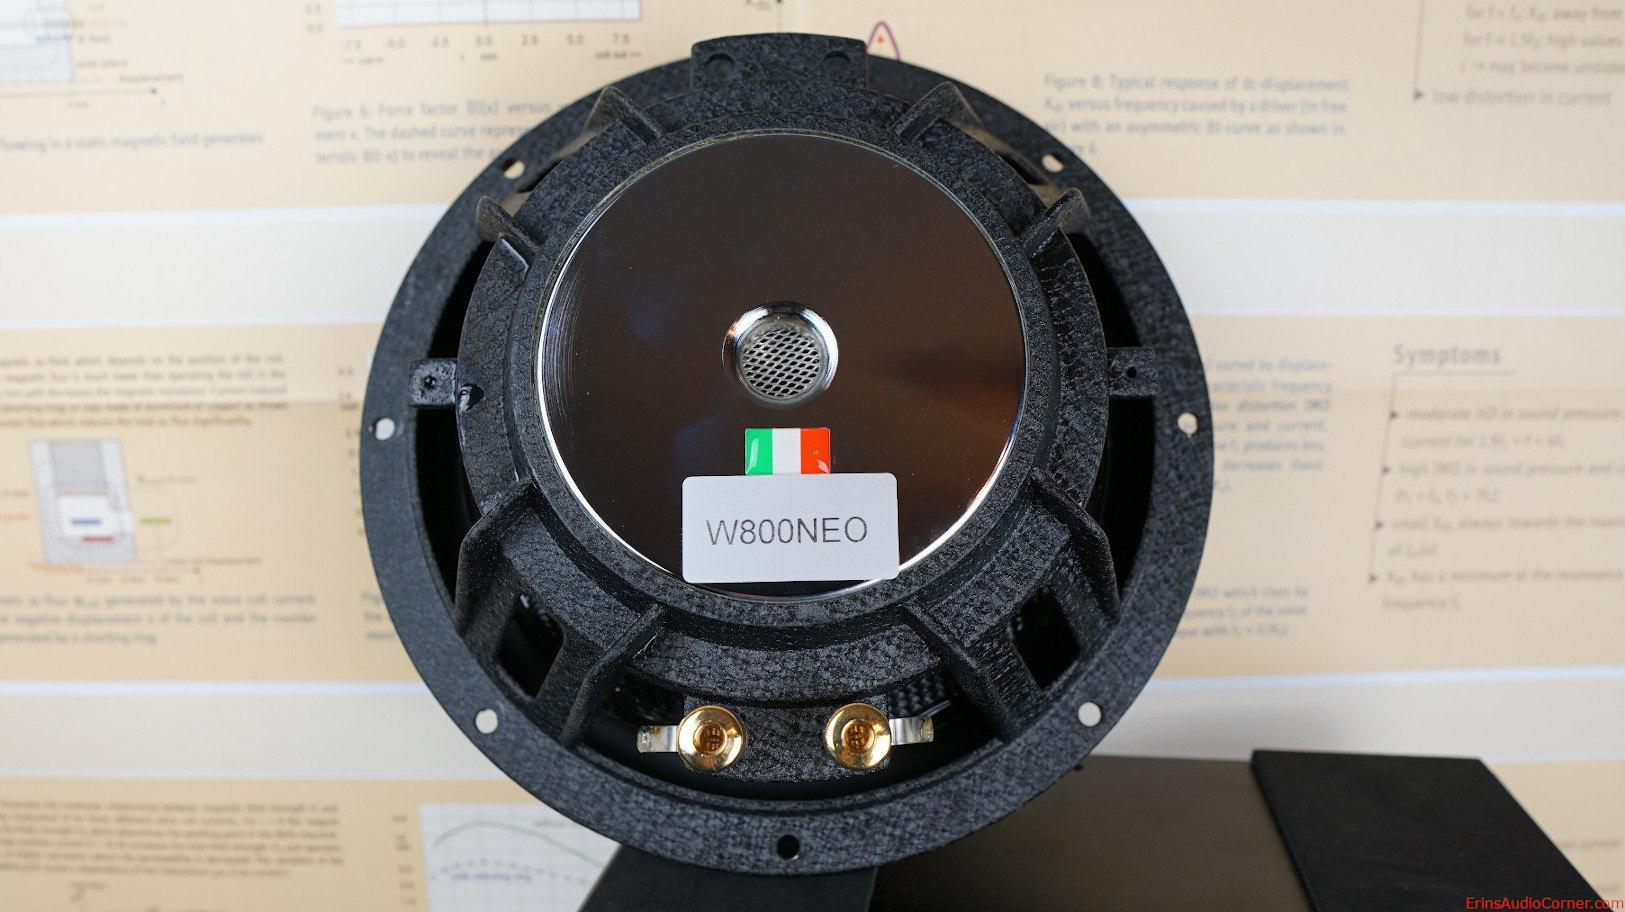
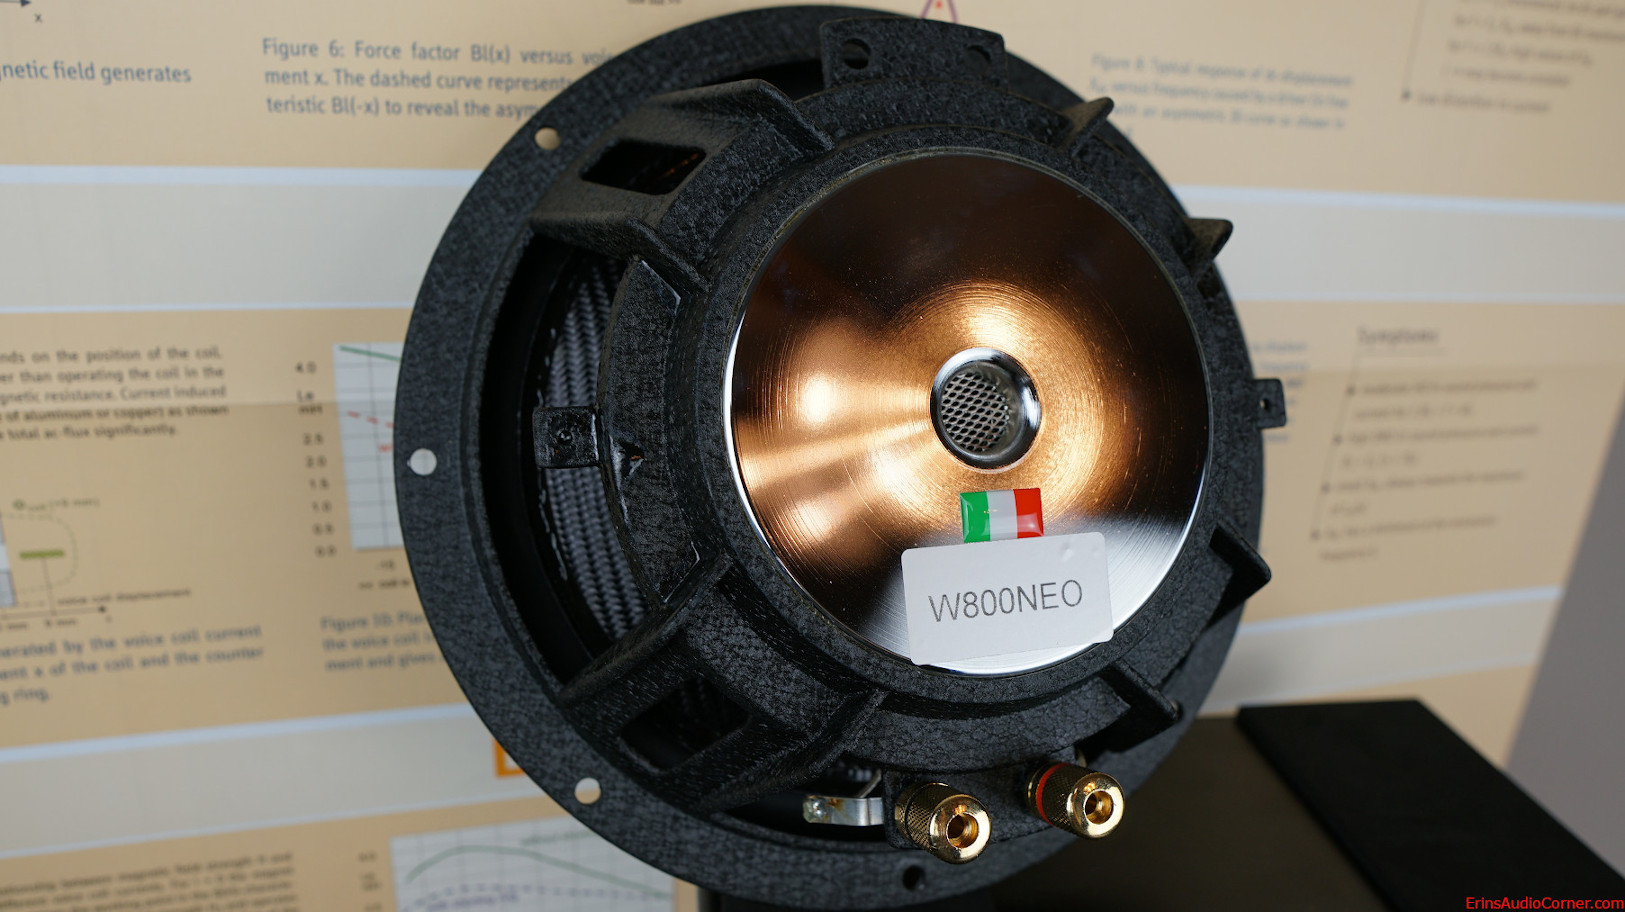
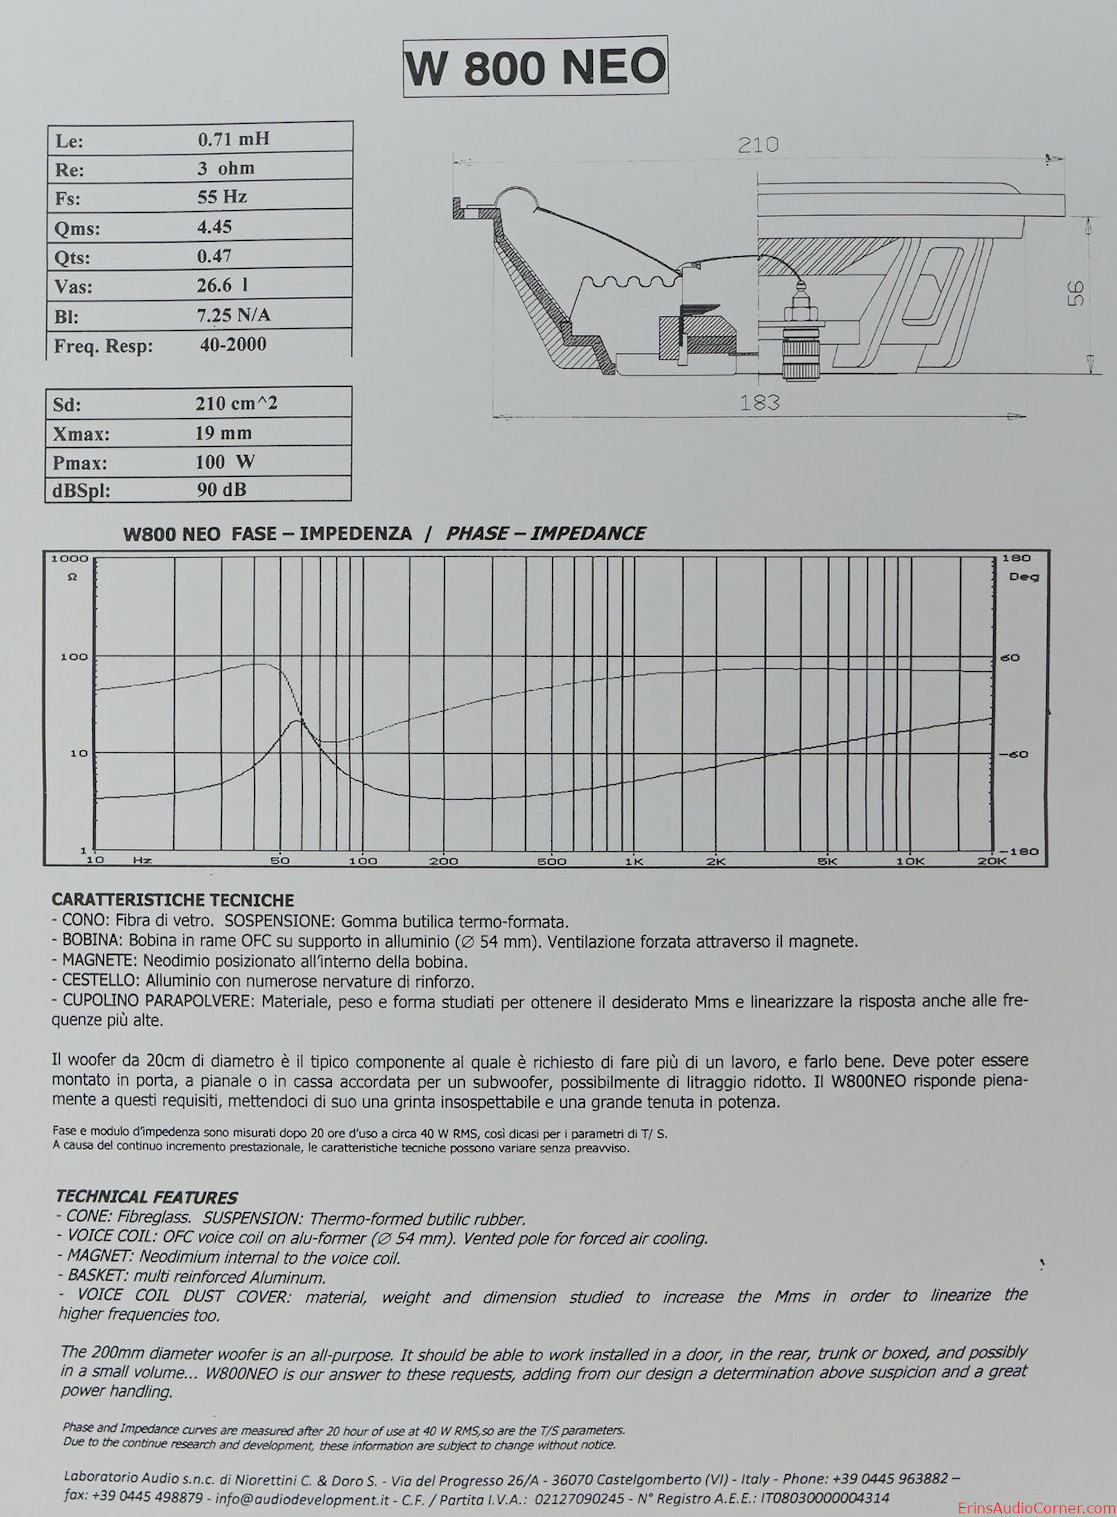
The Audio Develoopment W800NEO is a shallow mount 8-inch midbass with (I am told) a retail price of $800/pair.
Product Spec Sheet:
Test Results
Foreword: Subjective Analysis vs Objective Data of Drive Units (click here)
While I would love to be able to confidently do so, I do not provide subjective analysis of raw drive units. Realistically, there is no easy way or meaningful way to do so. Drive units are parts of a whole. In order to test, subjectively, you would want to integrate it into a system and find what works best when mated to another driver (like a midwoofer to a tweeter, a midrange to a midwoofer, etc.). And to give it a fair shake it must be optimized in that inegration which would be a very arduous task to perform for every drive unit I review. It makes no sense to subjectively critique a single drive unit on its own because it may be used in a different configuration than someone else. One person may cross it with an LR2 HPF and LR4 LPF where another may use it in a completely different bandpass with completely different crossover and slopes. And if I were to try to create a speaker from it for the point of subjective analysis I am left with the same issue. The best implementation for a 6.5-inch midwoofer is different than it is for an 8-inch midwoofer. The data tells the story of performance on an apples-to-apples basis far better than someone's subjective imagination can.For all the reasons listed above: What I provide here is objective-heavy analysis. However, I provide my own subjective experience and provide insight into what I believe might be positive or negative performance characteristics based on the objective data.
Small Signal Testing (Thiele-Small Results)
Using Klippel’s Distortion Analyzer 2, Linear Lumped Parameter Measurement Module, Pro Driver Stand and provided Panasonic ANR12821 Laser along with Klippel’s Training 1 - Linear Lumped Parameter Measurement tutorial, I measured this drive unit’s impedance and small-signal parameters. Below are the results.
Note: The impedance graph can be found in the Frequency Response Linearity graphic later in this review.
| Electrical Parameters | |||
|---|---|---|---|
| Re | 2.90 | Ohm | electrical voice coil resistance at DC |
| Le | 0.381 | mH | frequency independent part of voice coil inductance |
| L2 | 0.321 | mH | para-inductance of voice coil |
| R2 | 1.33 | Ohm | electrical resistance due to eddy current losses |
| Cmes | 760.06 | µF | electrical capacitance representing moving mass |
| Lces | 19.95 | mH | electrical inductance representing driver compliance |
| Res | 14.90 | Ohm | resistance due to mechanical losses |
| fs | 40.9 | Hz | driver resonance frequency |
| Mechanical Parameters | |||
| (using laser) | |||
| Mms | 8.996 | g | mechanical mass of driver diaphragm assembly including air load and voice coil |
| Mmd (Sd) | 5.558 | g | mechanical mass of voice coil and diaphragm without air load |
| Rms | 0.795 | kg/s | mechanical resistance of total-driver losses |
| Cms | 1.685 | mm/N | mechanical compliance of driver suspension |
| Kms | 0.59 | N/mm | mechanical stiffness of driver suspension |
| Bl | 3.440 | N/A | force factor (Bl product) |
| Lambda s | 0.106 | suspension creep factor | |
| Loss factors | |||
| Qtp | 0.475 | total Q-factor considering all losses | |
| Qms | 2.908 | mechanical Q-factor of driver in free air considering Rms only | |
| Qes | 0.566 | electrical Q-factor of driver in free air considering Re only | |
| Qts | 0.474 | total Q-factor considering Re and Rms only | |
| Other Parameters | |||
| Vas | 105.1841 | l | equivalent air volume of suspension |
| n0 | 1.220 | % | reference efficiency (2 pi-radiation using Re) |
| Lm | 93.06 | dB | characteristic sound pressure level (SPL at 1m for 1W @ Re) |
| Lnom | 93.21 | dB | nominal sensitivity (SPL at 1m for 1W @ Zn) |
| Series resistor | 0.00 | Ohm | resistance of series resistor |
| Sd | 210.00 | cm² | diaphragm area |
Large Signal Modeling (Linear Xmax Results)
Using Klippel’s Distortion Analyzer 2, Large Signal Identification Module, Pro Driver Stand and provided Panasonic ANR12821 Laser along with Klippel’s Training 3 - Loudspeaker Nonlinearities tutorial, I measured the linear, nonlinear and thermal parameters of this drive unit.
Nonlinearities
Traditionally, Xmax has been defined in one of the following ways:
- the physical overhang of the voice coil (height of the voice coil relative to height of the gap)
- 115% times the physical overhang above
- the point where displacement limit(s) is/are exceeded
The third option is where the Klippel LSI module comes in to play. It permits a more “apples to apples” approach of defining the displacement (Xmax) limits based on the XBL, XC, XL and Xd. The displacement limits XBL, XC, XL and Xd describe the limiting effect for the force factor Bl(x), compliance Cms(x), inductance Le(x) and Doppler effect, respectively, according to the threshold values Blmin, Cmin, Zmax and d2 used by the operator.
There are one of two sets of thresholds which can be used to define linear excursion:
- Non-Subwoofer Drivers: The thresholds Blmin= 82 %, Cmin=75 %, Zmax=10 % and d2=10% generate for a two-tone-signal (f1=fs, f2=8.5fs) 10 % total harmonic distortion and 10 % intermodulation distortion.
- Subwoofer Drivers: The thresholds Blmin= 70 %, Cmin=50 %, Zmax=17 % create 20 % total harmonic distortion which is becoming the standard for acceptable subwoofer distortion thresholds.
These parameters are defined in more detail in the (Klippel) papers:
- “AN04 – Measurement of Peak Displacement Xmax”
- “AN05 - Displacement Limits due to Driver Nonlinearities”
- “AN17 - Credibility of Nonlinear Parameters”
- “Prediction of Speaker Performance at High Amplitudes”
- “Assessment of Voice Coil Peak Displacement Xmax”
- “Assessing Large Signal Performance of Loudspeakers”
Below are the displacement limits’ results for this drive unit obtained from Klippel’s LSI module:
| Displacement Limits | |||
|---|---|---|---|
| X Bl @ Bl min=82% | 4.9 | mm | Displacement limit due to force factor variation |
| X C @ C min=75% | 9.3 | mm | Displacement limit due to compliance variation |
| X L @ Z max=10 % | 7.1 | mm | Displacement limit due to inductance variation |
| X d @ d2=10% | 24.2 | mm | Displacement limit due to IM distortion (Doppler) |
| Asymmetry (IEC 62458) | |||
| Ak | -22.51 | % | Stiffness asymmetry Ak(Xpeak) |
| Xsym | -0.02 | mm | Symmetry point of Bl(x) at maximal excursion |
Per the above table, this drive unit’s linear excursion is limited to 4.9mm due to exceeding the Bl displacement limit of 82% for the distortion limit of 10%.
We can break the above information down further. The below text is written by Patrick Turnmire of Red Rock Acoustics and used with his permission, substituting data from this drive unit’s test results where applicable.
Large Signal Modeling
At higher amplitudes, loudspeakers produce substantial distortion in the output signal, generated by nonlinear ties inherent in the transducer. The dominant nonlinear distortions are predictable and are closely related with the general principle, particular design, material properties and assembling techniques of the loudspeaker. The Klippel Distortion Analyzer combines nonlinear measurement techniques with computer simulation to explain the generation of the nonlinear distortions, to identify their physical causes and to give suggestion for constructional improvements. Better insight into the nonlinear mechanisms makes it possible to further optimize the transducer in respect with sound quality, weight, size and cost.
Nonlinear Characteristics
The dominant nonlinearities are modelled by variable parameters such as
| Bl(x) | instantaneous electro-dynamic coupling factor (force factor of the motor) defined by the integral of the magnetic flux density B over voice coil length l as a function of displacement |
| KMS(x) | mechanical stiffness of driver suspension a function of displacement |
| LE(i) | voice coil inductance as a function of input current (describes nonlinear permeability of the iron path) |
| LE(x) | voice coil inductance as a function of displacement |
Nonlinear Parameters
Bl change with excursion
.png)
The electrodynamic coupling factor, also called Bl-product or force factor Bl(x), is defined by the integral of the magnetic flux density B over voice coil length l and translates current into force. In traditional modeling this parameter is assumed to be constant. The force factor Bl(0) at the rest position corresponds with the Bl-product used in linear modeling. The red curve displays Bl over the entire displacement range covered during the measurement. You see the typical decay of Bl when the voice coil moves out of the gap. At the end of the measurement, the black curve shows the confidential range (interval where the voice coil displacement in this range occurred 99% of the measurement time). During the measurement, the black curve shows the current working range. The dashed curve displays Bl(x) mirrored at the rest position of the voice coil – this way, asymmetries can be quickly identified. Since a laser was connected during the measurement, a coil in / coil out marker is displayed on the bottom left / bottom right.
Suspension Stiffness change with excursion
.png)
The stiffness KMS(x) describes the mechanical properties of the suspension. Its inverse is the compliance CMS(x).
Inductance change with excursion
.png)
.png)
The inductance components Le (x) and Bl(i) of most drivers have a strong asymmetric characteristic. If the voice coil moves towards the back plate the inductance usually increases since the magnetic field generated by the current in the voice coil has a lower magnetic resistance due to the shorter air path. The nonlinear inductance Le(x) has two nonlinear effects. First the variation of the electrical impedance with voice coil displacement x affects the input current of the driver. Here the nonlinear source of distortion is the multiplication of displacement and current. The second effect is the generation of a reluctance force which may be interpreted as an electromagnetic motor force proportional to the squared input current.
The flux modulation Bl(i) has two effects too. On the electrical side the back EMF Bl(i)*v produces nonlinear distortion due to the multiplication of current i and velocity v. On the mechanical side the driving force F = Bl(i)*i comprises a nonlinear term due to the squared current i. This force produces similar effects as the variable term Le(x).
Fs shift with excursion
.png)
Qts change with excursion
.png)
Asymmetrical Nonlinearities
Asymmetrical nonlinearities produce not only second- and higher-order distortions but also a dc-part in the displacement by rectifying low frequency components. For an asymmetric stiffness characteristic the dc-components moves the voice coil for any excitation signal in the direction of the stiffness minimum. For an asymmetric force factor characteristic the dc-component depends on the frequency of the excitation signal. A sinusoidal tone below resonance (f<fS) would generate or force moving the voice coil always in the force factor maximum. This effect is most welcome for stabilizing voice coil position. However, above the resonance frequency (f>fS) would generate a dc-component moving the voice coil in the force factor minimum and may cause severe stability problems. For an asymmetric inductance characteristic the dc-component moves the voice coil for any excitation signal in the direction of the inductance maximum. Please note that the dynamically generated DC-components cause interactions between the driver nonlinearities. An optimal rest position of the coil in the gap may be destroyed by an asymmetric compliance or inductance characteristic at higher amplitudes. The module Large Signal Simulation (SIM) allows systematic investigation of the complicated behavior.
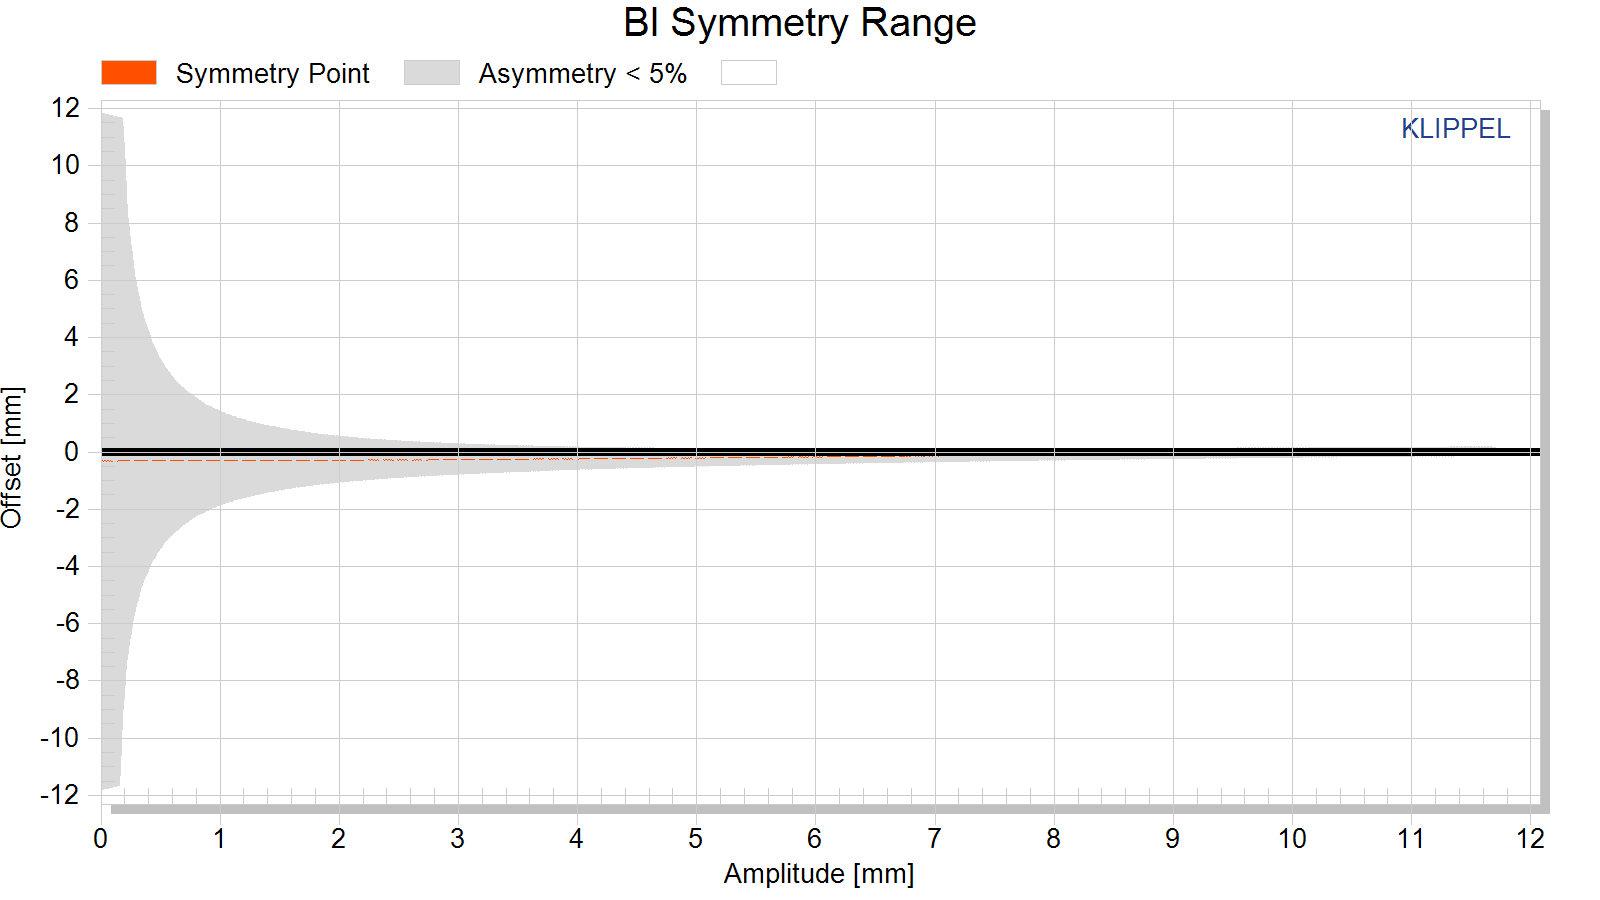
Bl symmetry xb(x)
This curve shows the symmetry point in the nonlinear Bl-curve where a negative and positive displacement x=xpeak will produce the same force factor Bl(xb(x) + x) = Bl(xb(x) – x).
If the shift xb(x) is independent on the displacement amplitude x then the force factor asymmetry is caused by an offset of the voice coil position and can be simply compensated.
If the optimal shift xb(x) varies with the displacement amplitude x then the force factor asymmetry is caused by an asymmetrical geometry of the magnetic field and cannot completely be compensated by coil shifting.
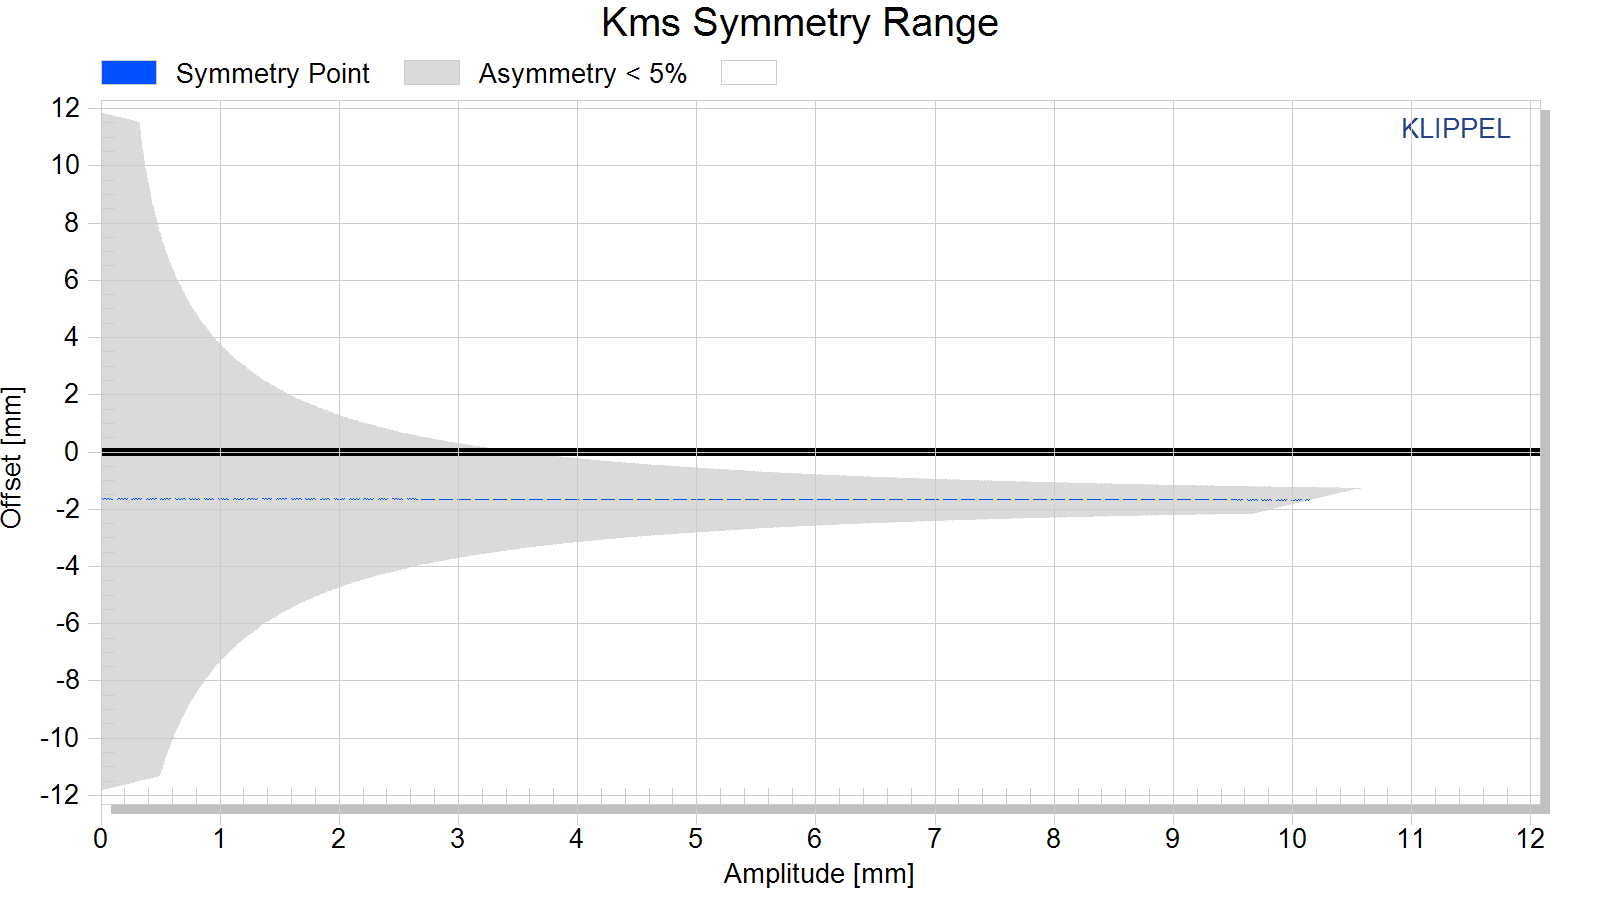
Kms Symmetry xc(x)
This curve shows the symmetry point in the nonlinear compliance curve where a negative and positive displacement x=xpeak will produce the same compliance value kms(xc(x) + x) = kms(xc(x) – x).
A high value of the symmetry point xc(x) at small displacement amplitudes x » 0 indicates that the rest position does not agree with the minimum of the stiffness characteristic. This may be caused by an asymmetry in the geometry of the spider (cup form) or surround (half wave). A high value of the symmetry point xc(x) at maximal displacement x» xmax may be caused by asymmetric limiting of the surround.
Parameters at the Rest Position
For accurate system modelling “Large + Cold” parameters are preferable to “Small Signal” parameters because they more closely reflect the parameters in their typical operating range.
| Symbol | Large + Warm | Large + Cold | Small Signal | Unit | Comment |
|---|---|---|---|---|---|
| Note: | for accurate small signal parameters, use LPM module | ||||
| Delta Tv [referenced] | 40.3 | 0 | K | increase of voice coil temperature during the measurement referenced to imported Re(Delta Tv=0K) | |
| Delta Tv = Tv-Ta | 30.6 | 0 | 0 | K | increase of voice coil temperature during the measurement |
| Xprot | 11.8 | 11.8 | 1.3 | mm | maximal voice coil excursion (limited by protection system) |
| Re (Tv) | 3.34 | 3.00 | 3.00 | Ohm | voice coil resistance considering increase of voice coil temperature Tv |
| Le (X=0) | 0.37 | 0.37 | 0.33 | mH | voice coil inductance at the rest position of the voice coil |
| L2 (X=0) | 0.29 | 0.29 | 0.30 | mH | para-inductance at the rest position due to the effect of eddy current |
| R2 (X=0) | 1.74 | 1.74 | 1.56 | Ohm | resistance at the rest position due to eddy currents |
| Cmes (X=0) | 785 | 785 | 765 | µF | electrical capacitance representing moving mass |
| Lces (X=0) | 23.04 | 23.04 | 19.53 | mH | electrical inductance at the rest position representing driver compliance |
| Res (X=0) | 11.76 | 11.76 | 8.80 | Ohm | resistance at the rest position due to mechanical losses |
| Qms (X=0, Tv) | 2.17 | 2.17 | 1.74 | mechanical Q-factor considering the mechanical system only | |
| Qes (Tv) | 0.55 | 0.50 | 0.59 | electrical Q-factor considering Re (Tv) only | |
| Qts (X=0, Tv) | 0.44 | 0.40 | 0.44 | total Q-factor considering Re (Tv) and Rms only | |
| fs | 37.4 | 37.4 | 41.2 | Hz | driver resonance frequency |
| Mms | 8.322 | 8.322 | g | (calculated from imported Bl) mechanical mass of driver diaphragm assembly including voice-coil and air load | |
| Rms (X=0) | 0.901 | 0.901 | 1.346 | kg/s | mechanical resistance of total-driver losses |
| Cms (X=0) | 2.17 | 2.17 | 1.65 | mm/N | mechanical compliance of driver suspension at the rest position |
| Kms (X=0) | 0.46 | 0.46 | 0.61 | N/mm | mechanical stiffness of driver suspension at the rest position |
| Bl (X=0) | 3.44 | 3.44 | 3.44 | N/A | (imported) force factor at the rest position (Bl product) |
| Vas | 135.1242 | 135.1242 | 102.6023 | l | equivalent air volume of suspension |
| N0 | 1.228 | 1.371 | 1.158 | % | reference efficiency (2Pi-sr radiation using Re) |
| Lm | 93.0 | 93.5 | 92.8 | dB | characteristic sound pressure level |
| Sd | 210.00 | 210.00 | 210.00 | cm² | diaphragm area |
Frequency Response
Frequency Response data is generated using Klippel’s Transfer Function Mueasurement module in conjunction with Klippel’s In-Situ Compensation module. This pairing enables me to generate anechoic-quality measurements in the farfield with a resolution of response down to 20Hz increments; far better than splicing nearfield with gated farfield data (the latter of which is often limited to 200Hz or 300Hz resolution and will not show high-Q resonance in the midrange and bass frequencies). Data is represented at 2.83v/1m.
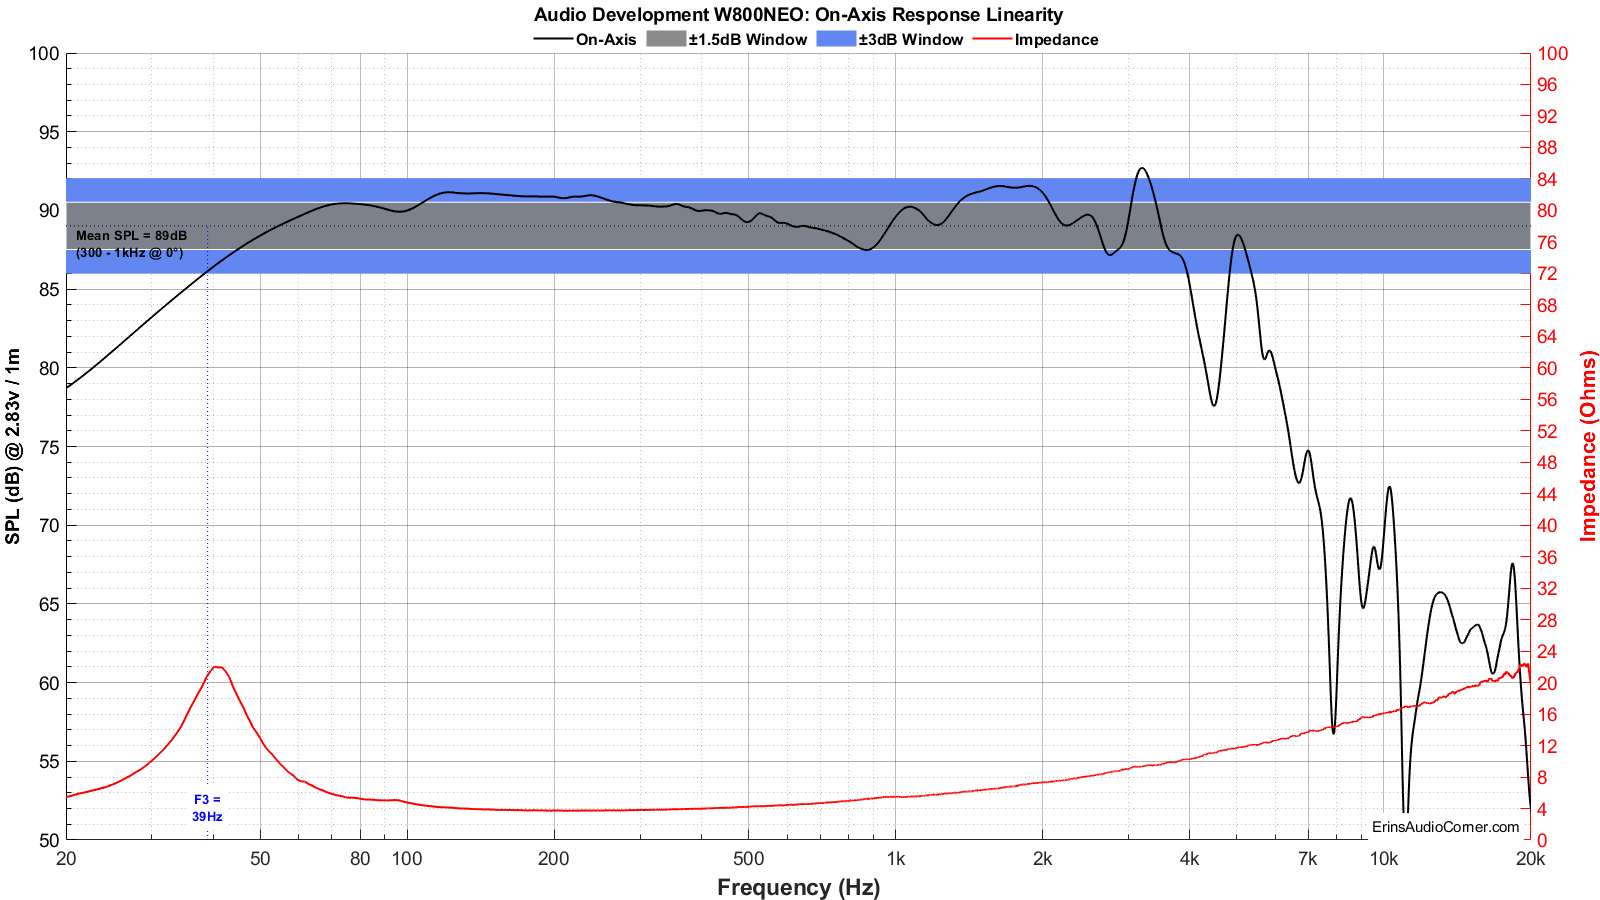
On-Axis Linearity and Impedance
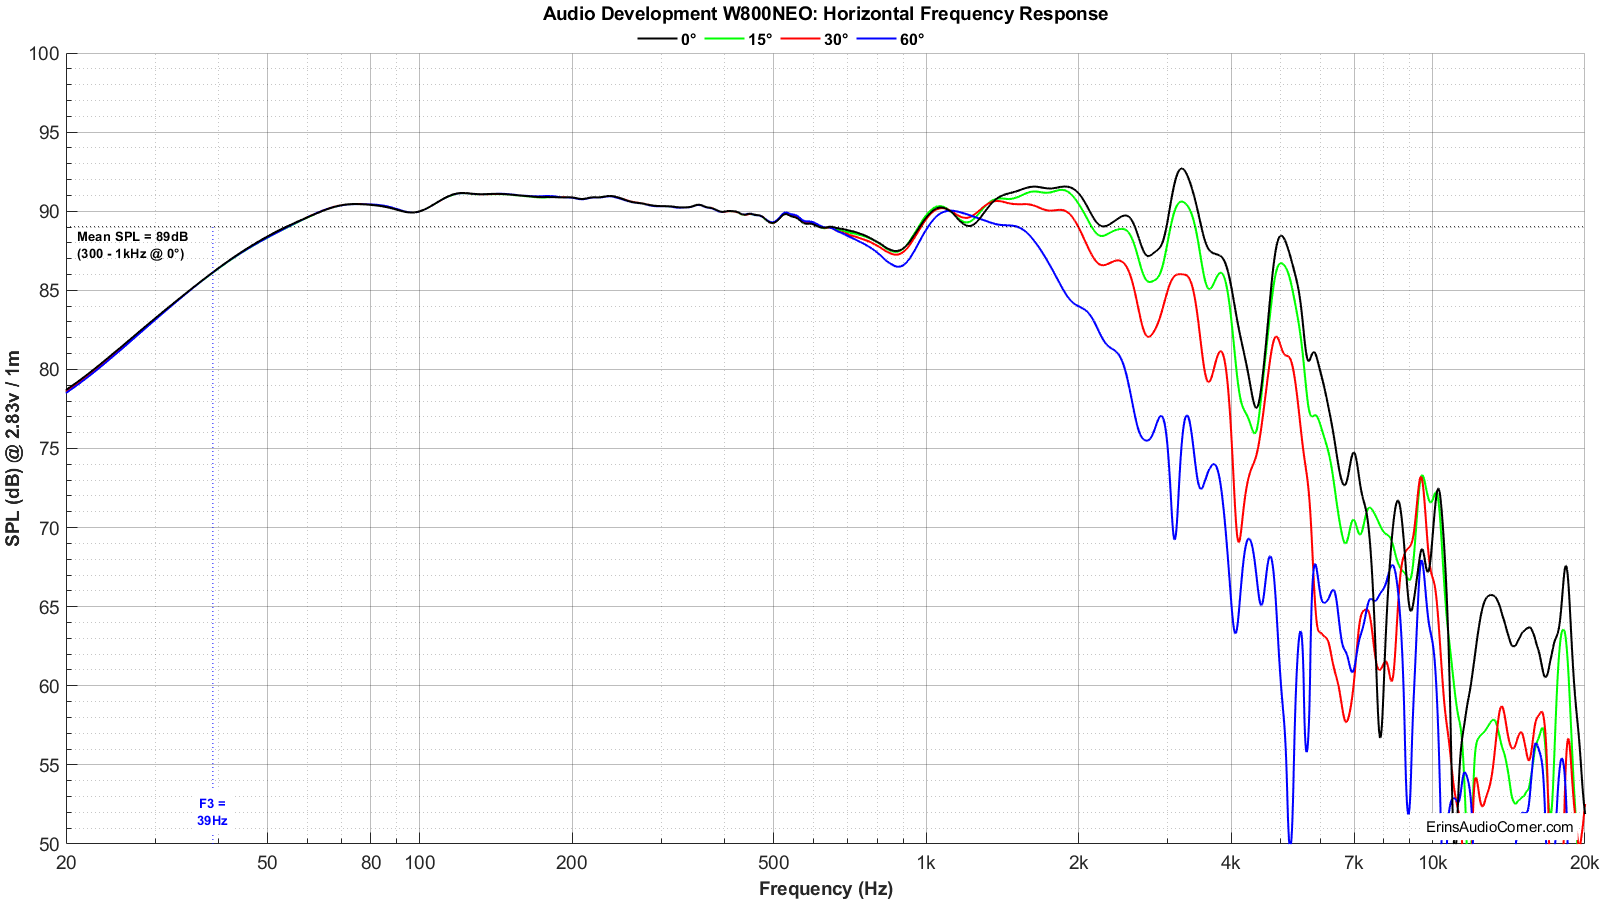
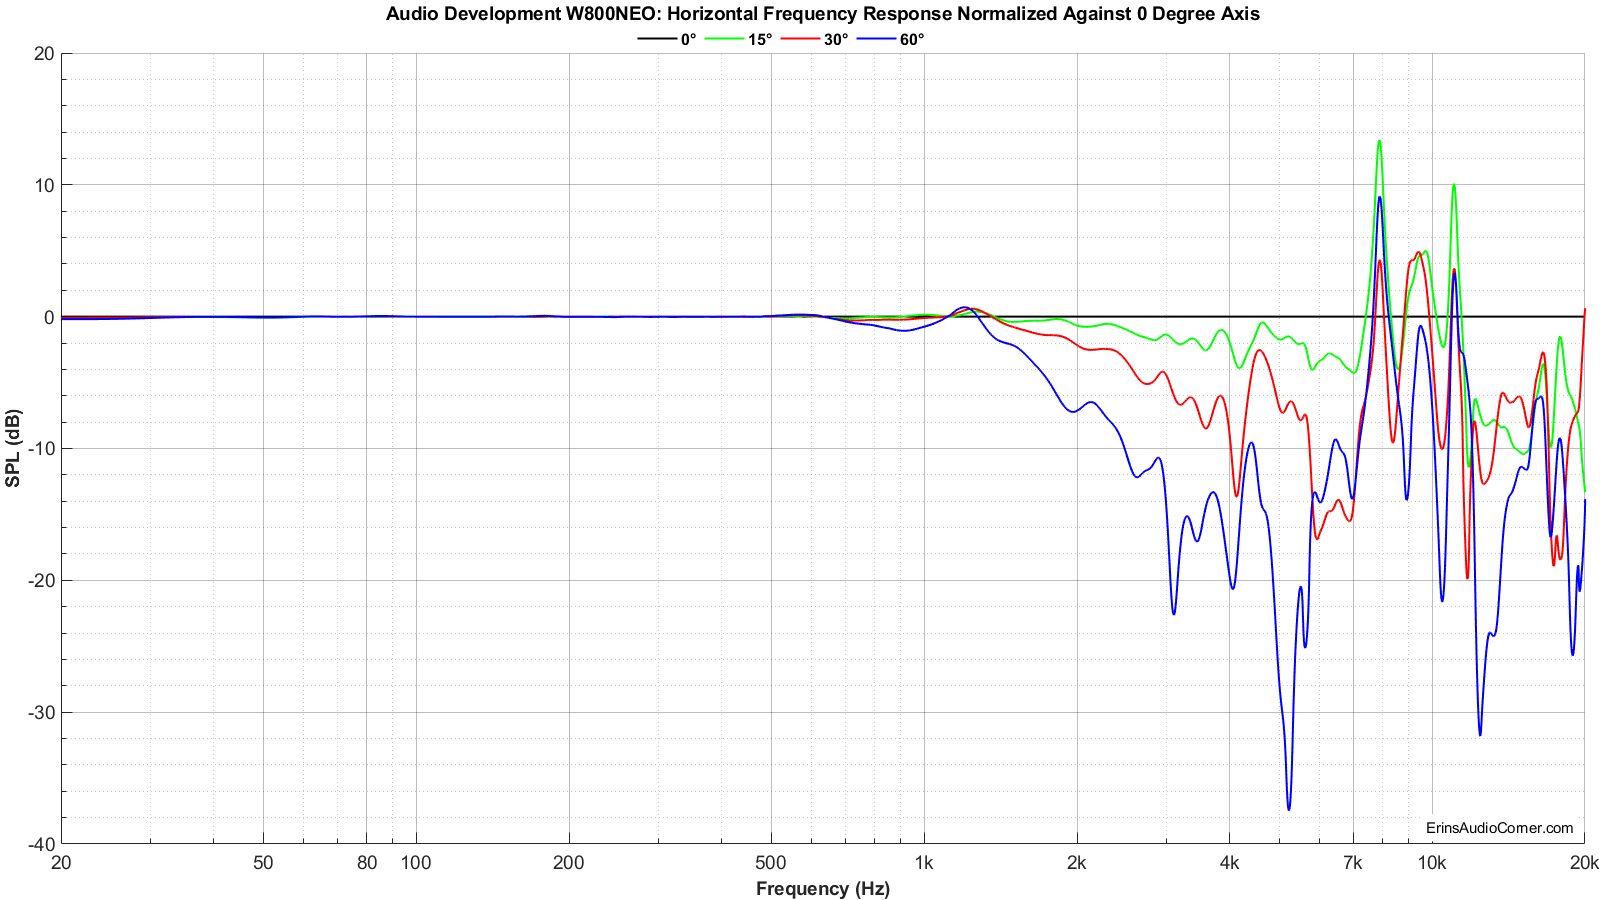
On and Off-Axis Frequency Response
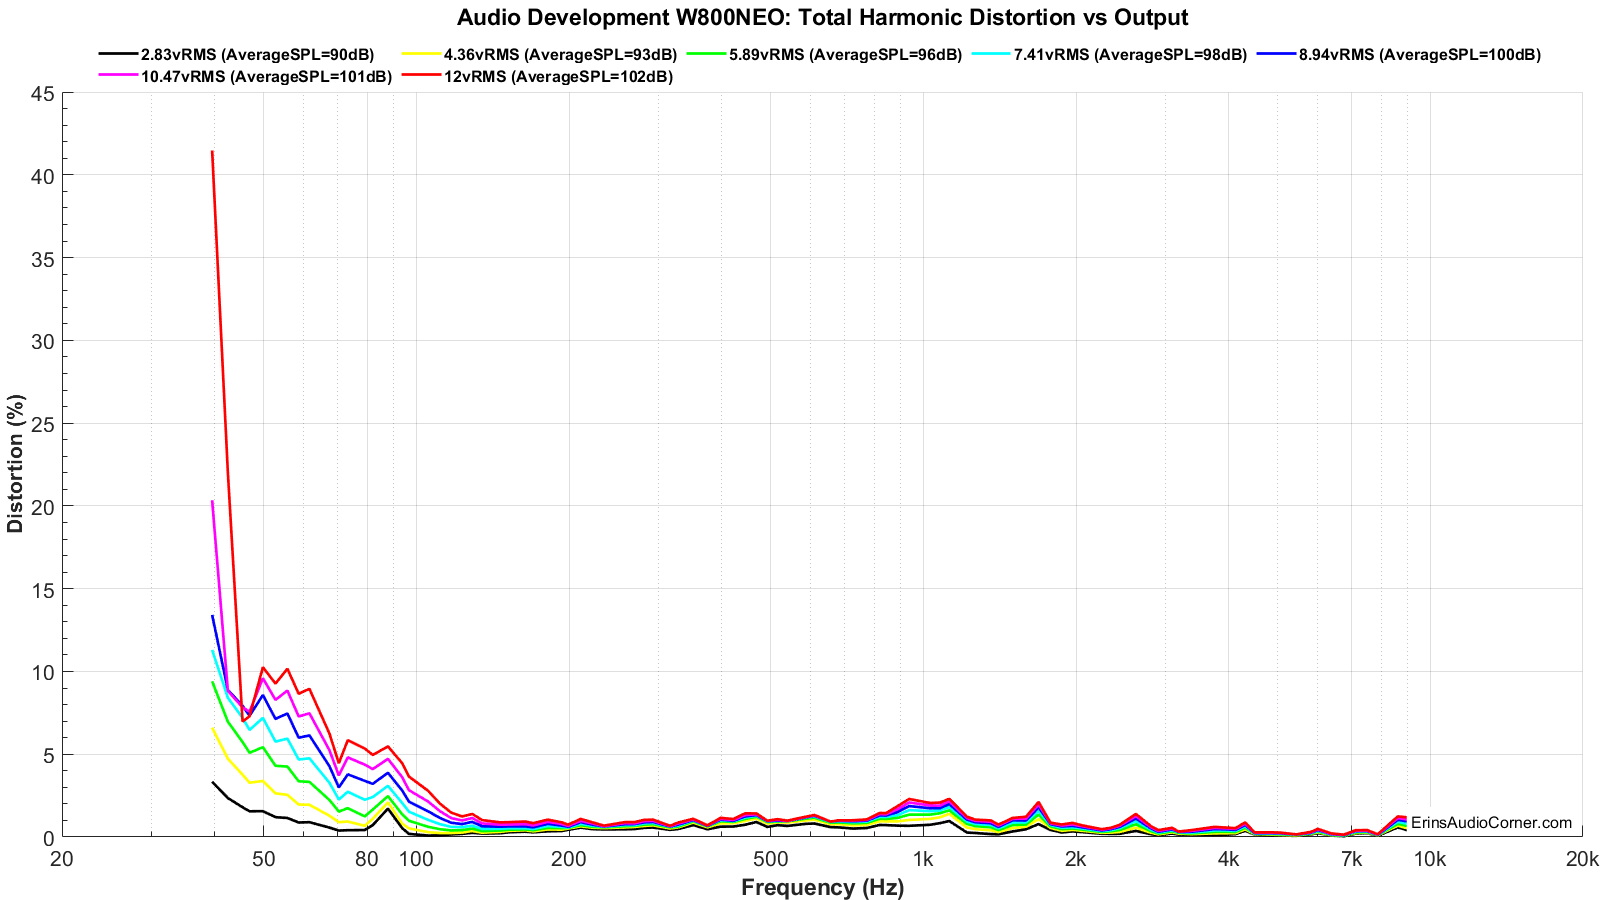
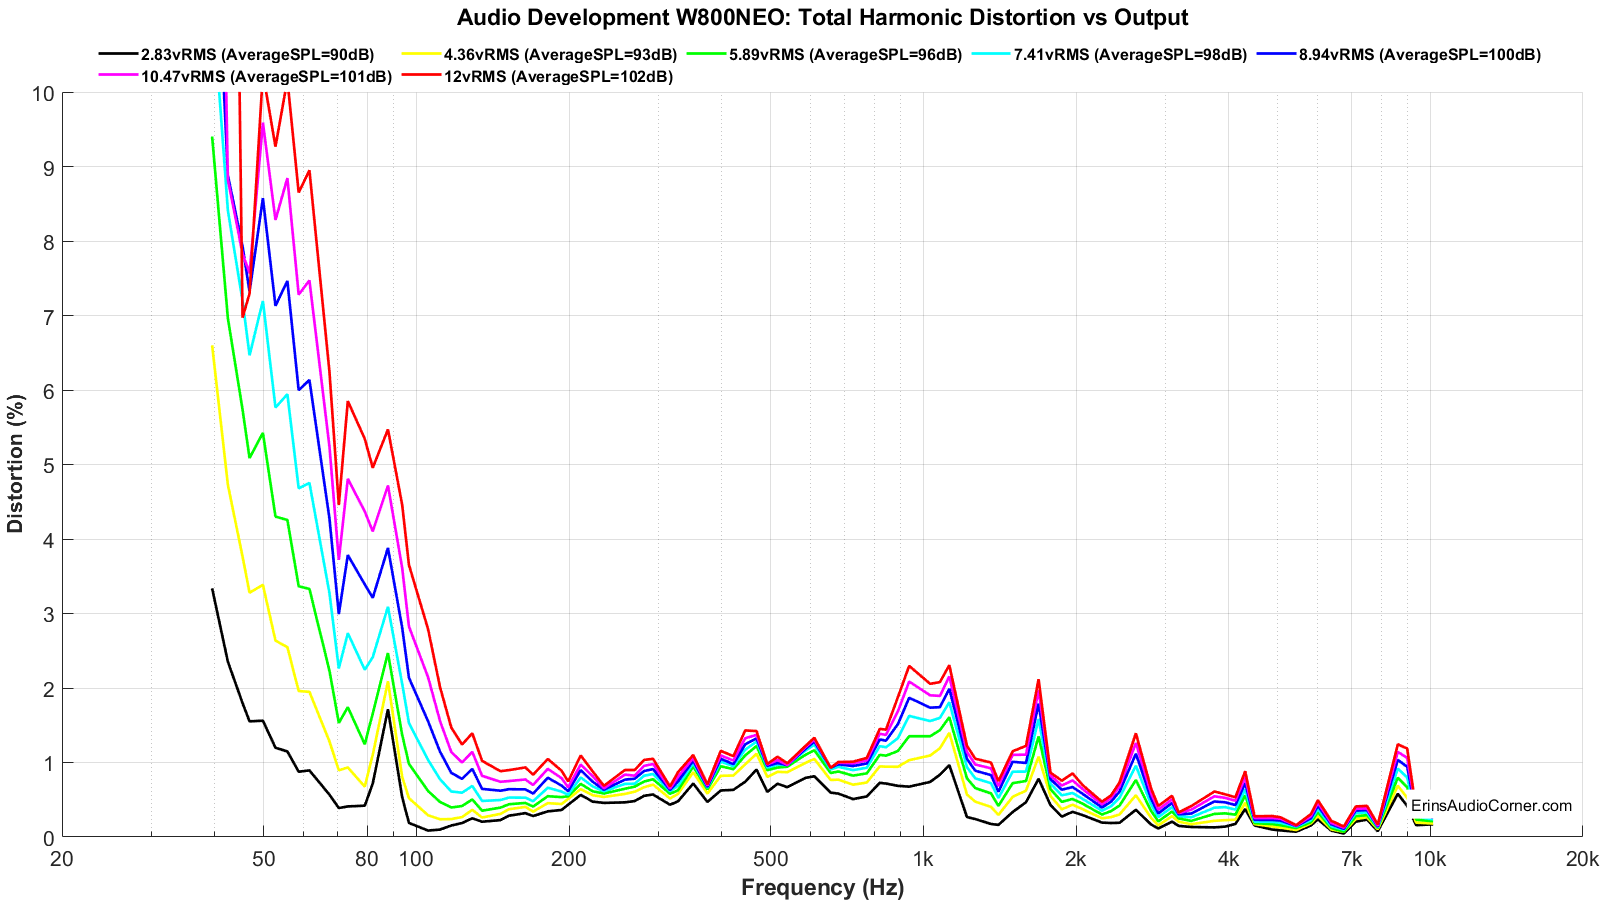
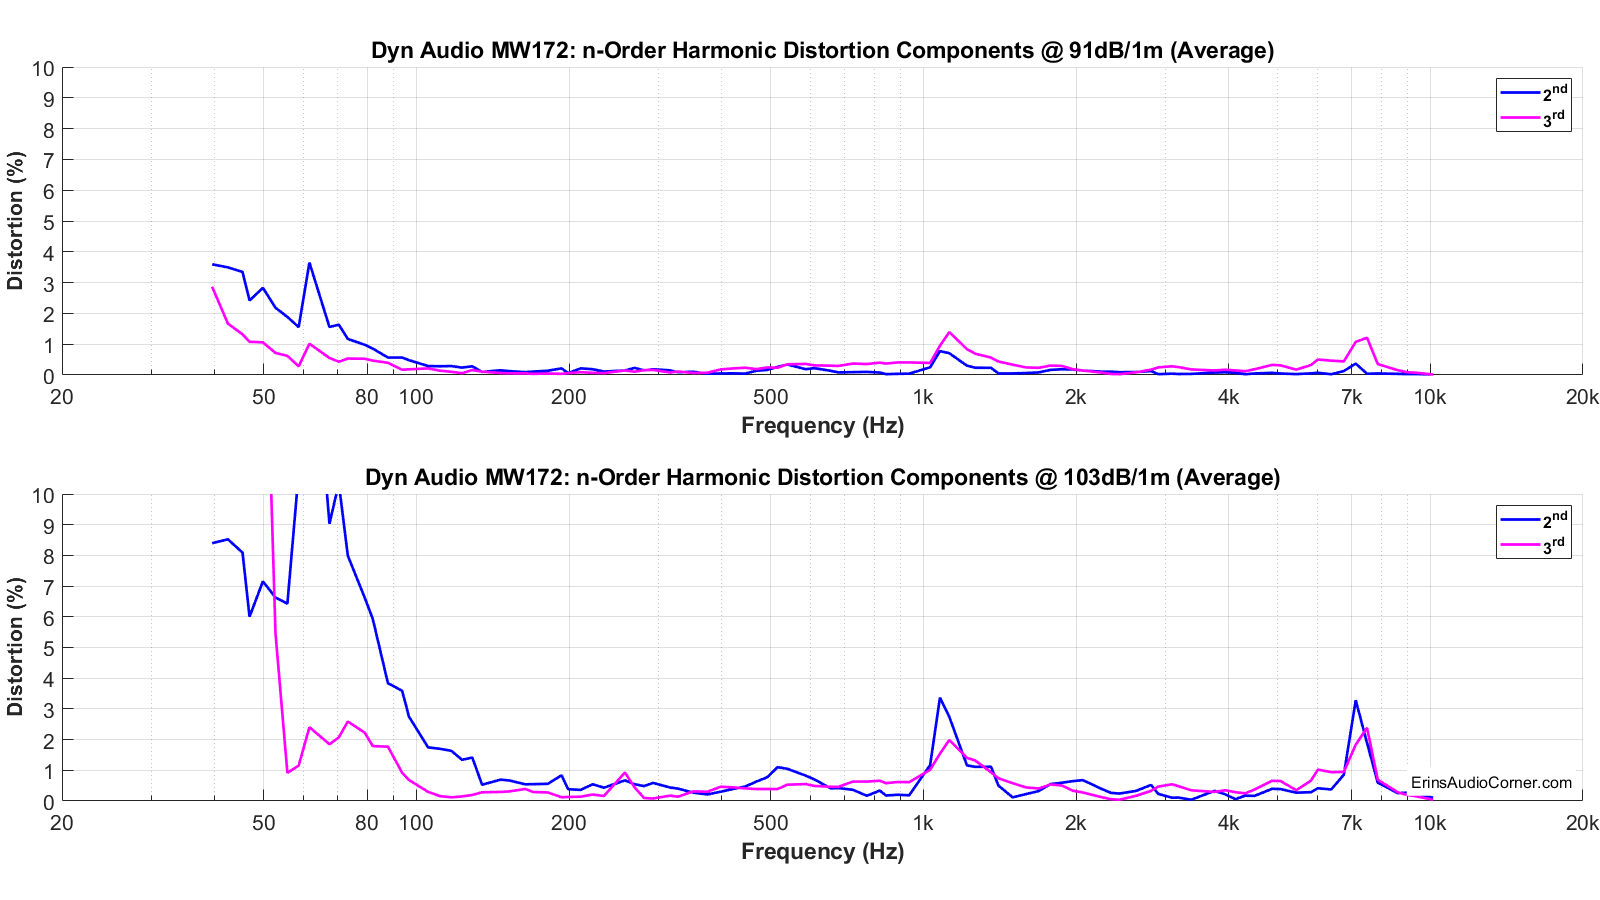
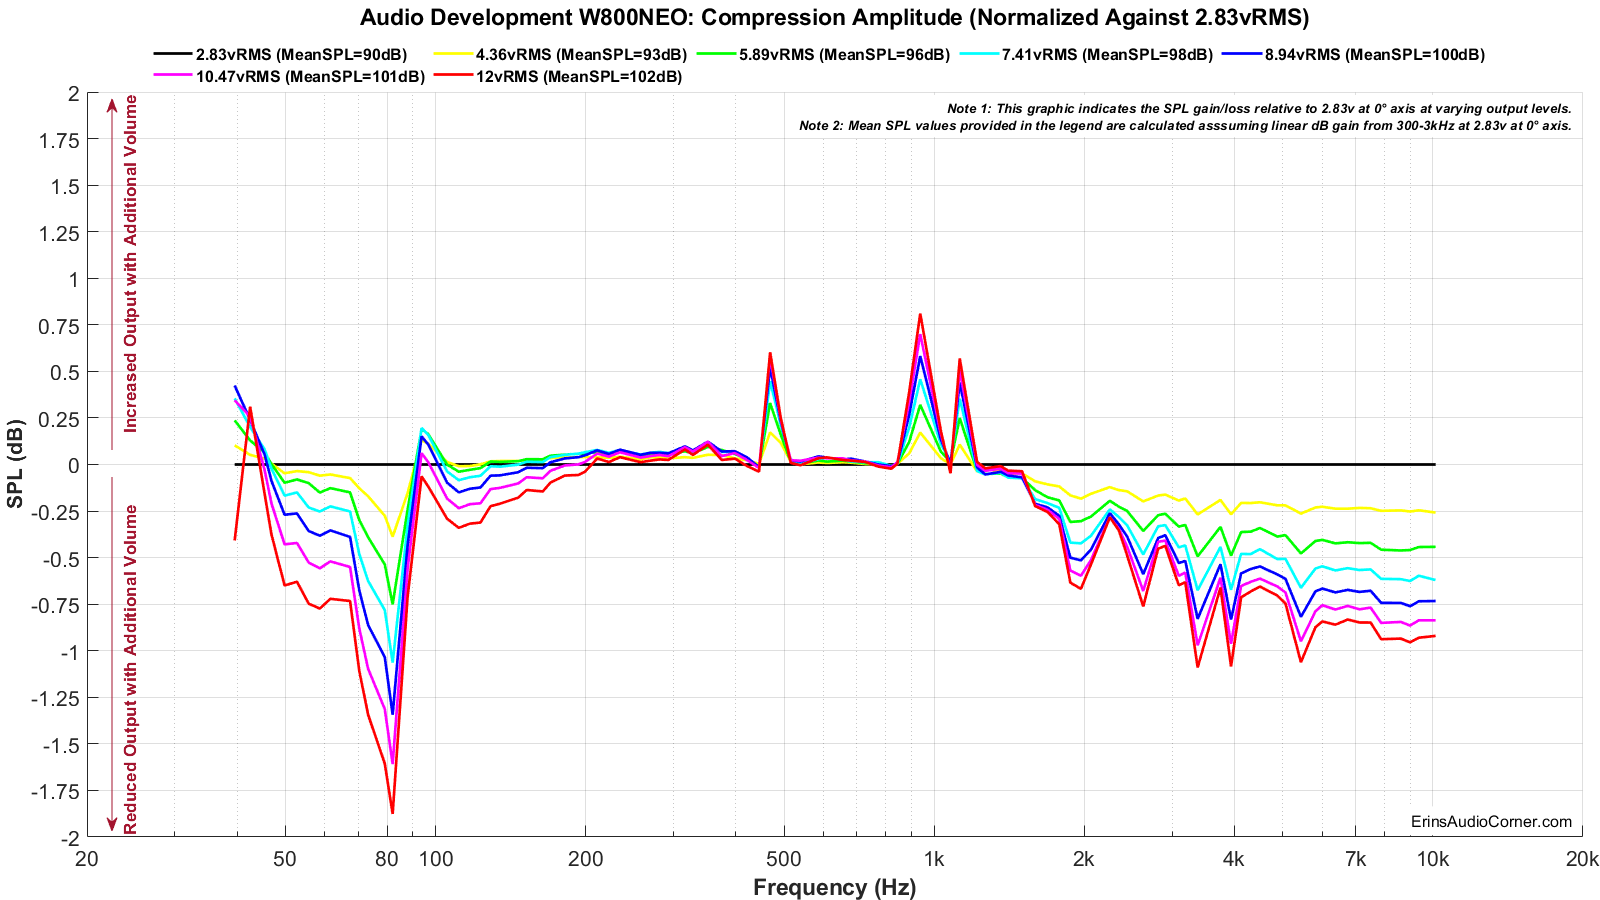
Total Harmonic Distortion (THD) and Compression:
Klippel’s 3D-DISTORTION MEASUREMENT (DIS) module is used to calculate the Total Harmonic Distortion and Compression for this drive unit.
Distortion and Compression measurements were completed in the nearfield (approximately 0.3 meters). However, SPL provided is relative to 1 meter distance.
Harmonic Distortion and Compression: What does this data mean? (click me for info)
Harmonic Distortion and Compression are provided at varying levels to get an idea of what happens as the voltage into the speaker is increased and overall output volume increases. The “mean spl” values associated with each voltage provided in the legend is based on a calculation of expected volume assuming linear volume at the 300-3kHz region. Meaning, if a speaker is ideal and you tell your stereo to increase by 6dB by turning the volume knob +6dB, the output will increase by 6dB. In the real-world, however, a speaker is a mechanical device and there are compression effects that can limit the output volume and, therefore, you could possibly only get an actual increase in volume of 5dB. A good speaker will have little compression (< 1dB), where poorer speakers may suffer greater compression (> 2dB). Generally speaking, higher sensitivity speakers (like pro-audio speakers with 100dBSPL @ 2.83v/1m spec) suffer relatively no compression while lower sensitivity speakers (low 80’s dBSPL @ 2.83v/1m) suffer more compression. When a crossover is used the compression near the speaker’s Fs is attenuated and overall the compression effects are mitigated. With that in mind, what you see below is first the Total Harmonic Distortion at varying output levels.
Maximum Long Term SPL (Multitone Distortion Testing)
Klippel’s Multi-Tone Measurement (MTON) module is used to calculate the maximum SPL for this drive unit.
The below data provides the metrics for how Maximum Long Term SPL is determined. This measurement follows the IEC 60268-21 Long Term SPL protocol, per Klippel’s template, as such:
- Rated maximum sound pressure according IEC 60268-21 §18.4
- Using broadband multi-tone stimulus according §8.4
- Stimulus time = 60 s Excitation time + Preloops according §18.4.1
Each voltage test is 1 minute long (hence, the “Long Term” nomenclature).
The thresholds to determine the maximum SPL are:
- -20dB Distortion relative to the fundamental
- -3dB compression relative to the reference (1V) measurement
When the speaker has reached either or both above thresholds, the test is terminated and the SPL of the last test is the maximum SPL. In the below results I provide the summarized table as well as the data showing how/why this SPL was deemed to be the maximum.
This measurement is conducted twice:
- First with a 20Hz to 20kHz multitone signal
- Second with a limited bandwidth multitone signal
The reason for the two measurements is because it is unfair to expect a small bookshelf speaker to extend low in frequency. Applying both will provide a good idea of the limitations if you were to want to run a speaker full range vs using one with a typical 80Hz HPF. And you will have a way to compare various speakers’ SPL limitations with each other. However, note: the 80Hz signal is a “brick wall” and does not emulate a typical 80Hz HPF slope of 24dB/octave. But… it’s close enough.
You can watch a demonstration of this testing via my YouTube channel: https://youtu.be/iCjJufvW0IA
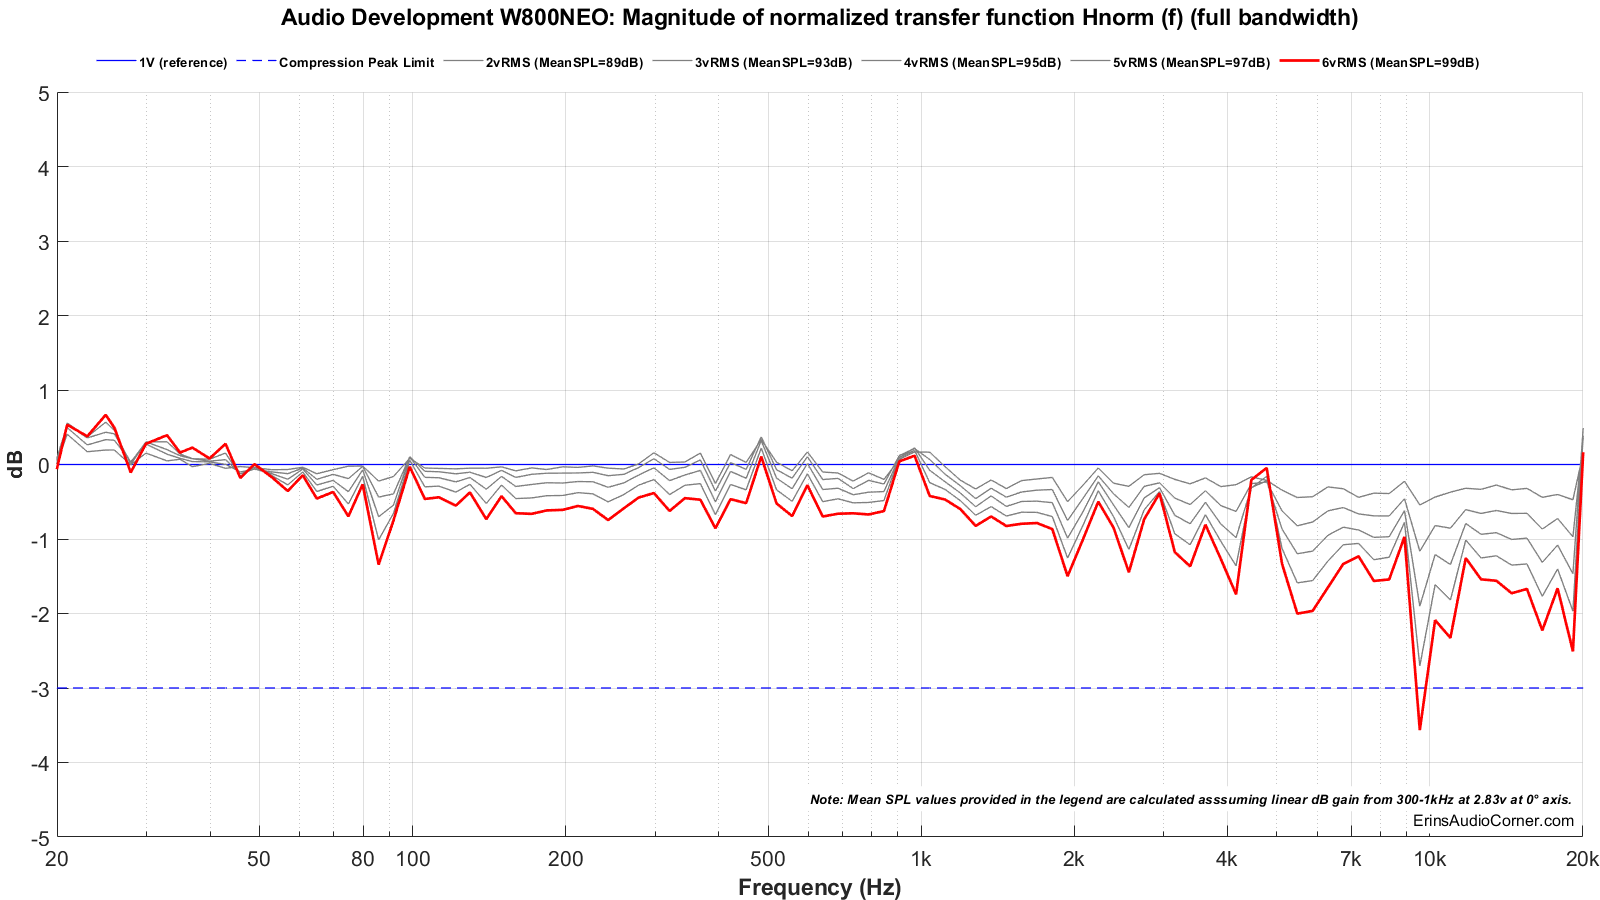
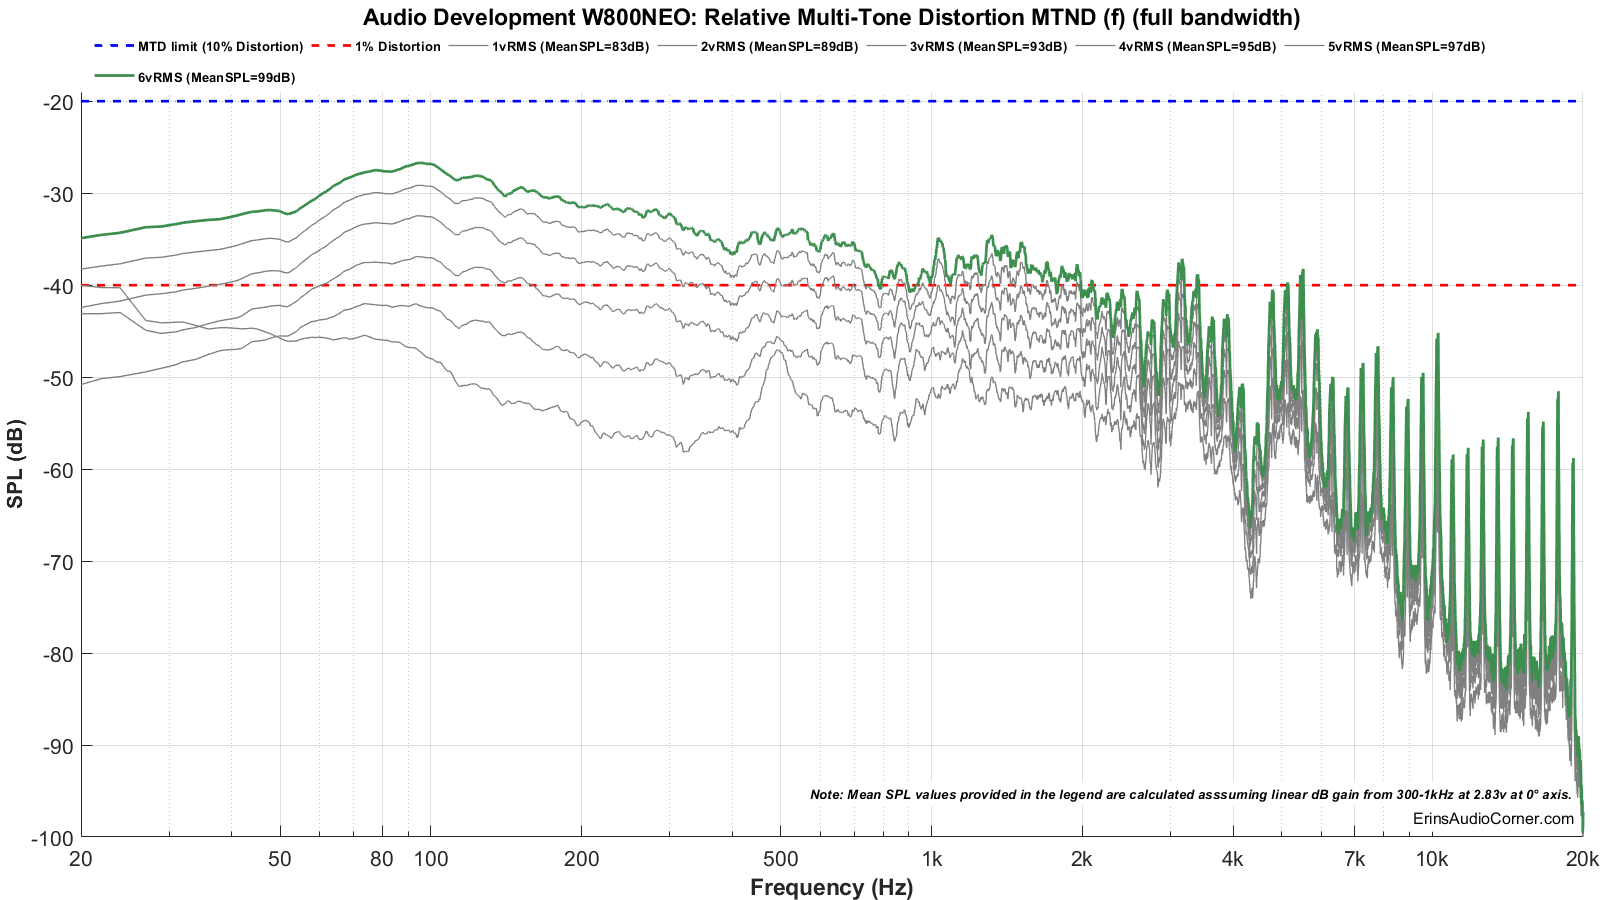
Test 1: 20Hz to 20kHz
Multitone compression testing. The red line shows the final measurement where either distortion and/or compression failed. The voltage just before this is used to help determine the maximum SPL.
Multitone distortion testing. The dashed blue line represents the -20dB (10% distortion) threshold for failure. The dashed red line is for reference and shows the 1% distortion mark (but has no bearing on pass/fail). The green line shows the final measurement where either distortion and/or compression failed. The voltage just before this is used to help determine the maximum SPL.
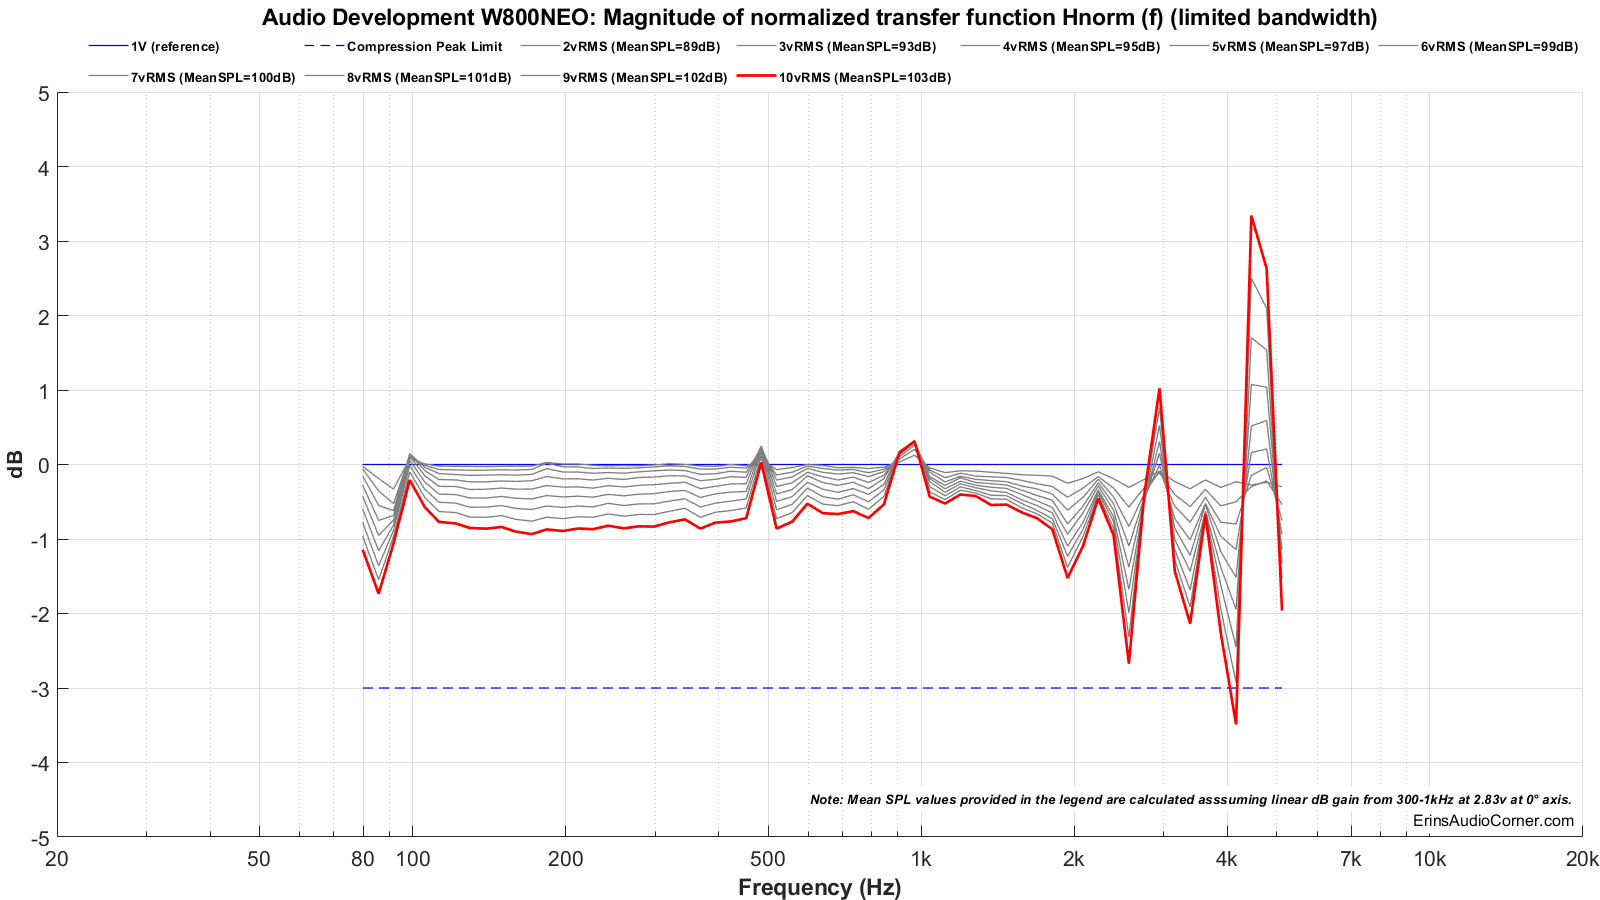
Test 2: 80Hz to 5kHz
Multitone compression testing. The red line shows the final measurement where either distortion and/or compression failed. The voltage just before this is used to help determine the maximum SPL.
Multitone distortion testing. The dashed blue line represents the -20dB (10% distortion) threshold for failure. The dashed red line is for reference and shows the 1% distortion mark (but has no bearing on pass/fail). The green line shows the final measurement where either distortion and/or compression failed. The voltage just before this is used to help determine the maximum SPL.
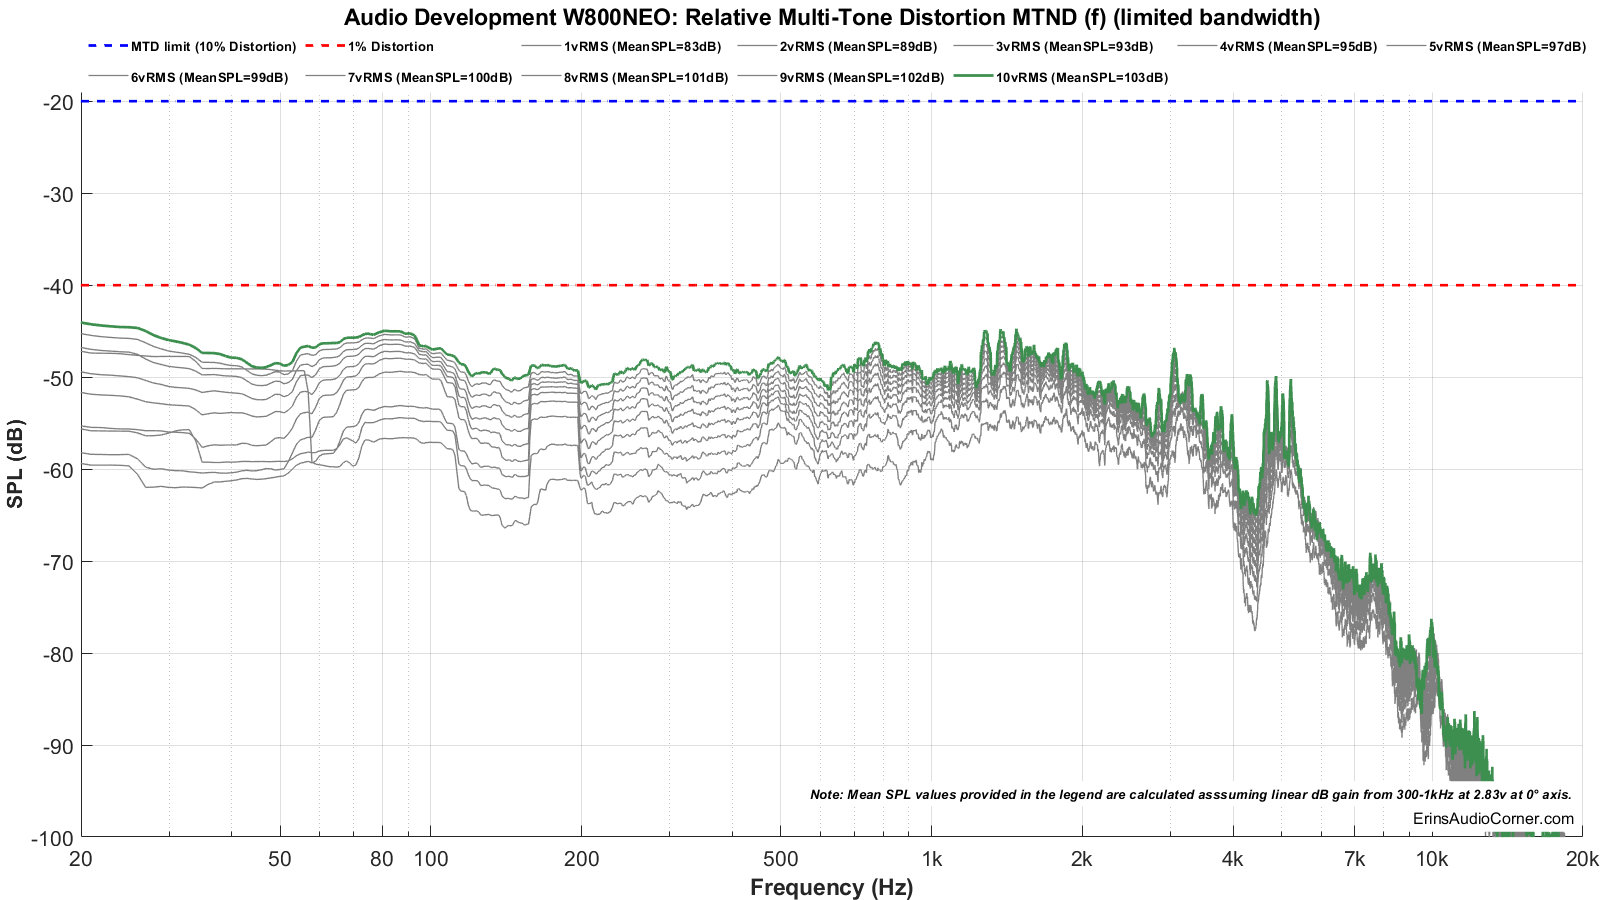
The above data can be summed up by looking at the tables above but is provided here again:
- Max SPL for 20Hz to 20kHz is approximately 99dB @ 1 meter. The compression threshold was exceeded above this SPL.
- Max SPL for 80Hz to 5kHz is approximately 103dB @ 1 meter. The compression threshold was exceeded above this SPL.
Bottom Line
T/S Parameters and Linear Excursion:
- The product spec sheet states an xmax of 19mm. That likely is one-way mechanical.
- The linear excursion is limited to about 5mm one-way. The limiting factor is still the motor force which would need to be broadened to improve the maximum linear displacement.
- Centering up the spider could help improve the suspension-derived linear excursion. After that the shorting ring needs to be re-positioned, especially if this is to be used near Fs, to keep intermodulated distortion down.
- The maximum mechanical excursion is close to about 10mm one-way and in my testing, I could hear the coil tapping the backplate at times. My testing doesn’t push a speaker harder than this as I do not want to ruin it.
Frequency Response:
- The sensitivity is on the high side, measured at about 89dB from 300Hz to 1000Hz. This helps to offset the rather low linear xmax measured by Klippel’s LSI module.
- The F3 measured on my 21 x 10 foot baffle (yes, feet) is 41Hz with respect to the mean SPL provided above.
- The frequency response looks usable for midbass application. Above 500Hz the response begins to fall due to a resonance in the 900Hz region of impedance. Above 2kHz it exhibits breakup.
- The impedance shows a resonance around 90Hz that is also visible in the FR as a dip. I do not have an idea what the cause of this could be but it’s concerning to me because unless one knows it is there, they may be inclined to try to EQ this dip in their system or use blame the car for the issue. My advice is to simply be aware of this and keep it in mind should you find an issue in this region that you have decided is not the car.
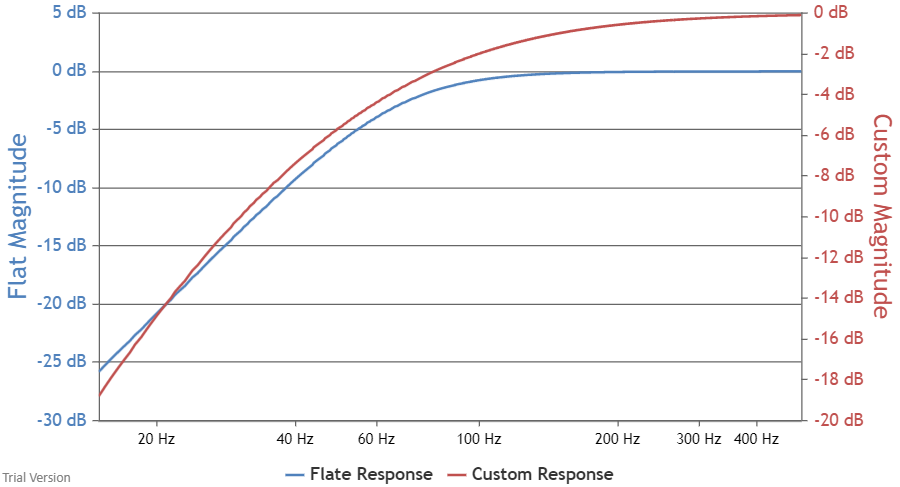
- Using this site’s online enclosure volume calculator yields 2.25 ft³ (~63 liters) with a Qtc = 0.707 and an F3 = 66Hz. EBP = 75. Seems this driver is suited more for an IB-type install rather than a small sealed enclosure. Below is the graph using those parameters (blue line) vs a true infinite baffle installation (red line).
Distortion and Compression:
- Look back at the multitone measurement results. You can see that when the driver is asked to play down to 20Hz it caps out at 6V input and you can see -30dB distortion (~3%) in the midrange. However, when fed a stimulus only down to 80Hz the distortion is considerably lower with the 6V signal (about -50dB; ~0.30% distortion). Hint: Use this site to convert between dB to % distortion.
- Below 90Hz the compression reaches nearly 2dB at 103dB (which means, you lose 2dB of output at 103dB output when you compare it to the 2.83v 90dB output level).
- Higher frequency compression is > 0.50dB.
This is a midbass driver. It is not a mid/woofer. And while it has decent mechanical excursion (~10mm one-way) it runs out of one-way linear excursion pretty quickly (5mm). To limit both linear and non-linear distortion use this as a midbass. It looks to be best used between 60-80Hz on the low end and 500-600Hz on the high end. And as always, your specific application may call for different needs so this data is simply a guide to help you determine how best this speaker could be used for you.
Contribute
If you like what you see here and want to help me keep it going, you can donate via the PayPal Contribute button at the bottom of each page. If you can help by chipping in, I would truly appreciate it.
You can also join my Facebook and YouTube pages via the links at the bottom of the page if you’d like to follow along with updates.