
Foreword / YouTube Video Review
This driver was loaned to me by Purifi for review. I was not paid for the review.
The review on this website is a brief overview and summary of the objective performance of this speaker. It is not intended to be a deep dive. Moreso, this is information for those who prefer “just the facts” and prefer to have the data without the filler. The video below has more discussion.
Information
Specs from the manufacturer can be found here.
Retail price is about $630 USD/each from Purifi.
Test Results
Foreword: Subjective Analysis vs Objective Data of Drive Units (click here)
While I would love to be able to confidently do so, I do not provide subjective analysis of raw drive units. Realistically, there is no easy way or meaningful way to do so. Drive units are parts of a whole. In order to test, subjectively, you would want to integrate it into a system and find what works best when mated to another driver (like a midwoofer to a tweeter, a midrange to a midwoofer, etc.). And to give it a fair shake it must be optimized in that inegration which would be a very arduous task to perform for every drive unit I review. It makes no sense to subjectively critique a single drive unit on its own because it may be used in a different configuration than someone else. One person may cross it with an LR2 HPF and LR4 LPF where another may use it in a completely different bandpass with completely different crossover and slopes. And if I were to try to create a speaker from it for the point of subjective analysis I am left with the same issue. The best implementation for a 6.5-inch midwoofer is different than it is for an 8-inch midwoofer. The data tells the story of performance on an apples-to-apples basis far better than someone's subjective imagination can.For all the reasons listed above: What I provide here is objective-heavy analysis. However, I provide my own subjective experience and provide insight into what I believe might be positive or negative performance characteristics based on the objective data.
Small Signal Testing (Thiele-Small Results)
Using Klippel’s Distortion Analyzer 2, Linear Lumped Parameter Measurement Module, Pro Driver Stand and provided Panasonic ANR12821 Laser along with Klippel’s Training 1 - Linear Lumped Parameter Measurement tutorial, I measured this drive unit’s impedance and small-signal parameters. Below are the results.
| Electrical Parameters | |||
|---|---|---|---|
| Re | 3.55 | Ohm | electrical voice coil resistance at DC |
| Le | 0.111 | mH | frequency independent part of voice coil inductance |
| L2 | 0.282 | mH | para-inductance of voice coil |
| R2 | 0.74 | Ohm | electrical resistance due to eddy current losses |
| Cmes | 637.28 | µF | electrical capacitance representing moving mass |
| Lces | 47.77 | mH | electrical inductance representing driver compliance |
| Res | 65.51 | Ohm | resistance due to mechanical losses |
| fs | 28.8 | Hz | driver resonance frequency |
| Mechanical Parameters | |||
| (using laser) | |||
| Mms | 42.935 | g | mechanical mass of driver diaphragm assembly including air load and voice coil |
| Mmd (Sd) | 38.863 | g | mechanical mass of voice coil and diaphragm without air load |
| Rms | 1.028 | kg/s | mechanical resistance of total-driver losses |
| Cms | 0.709 | mm/N | mechanical compliance of driver suspension |
| Kms | 1.41 | N/mm | mechanical stiffness of driver suspension |
| Bl | 8.208 | N/A | force factor (Bl product) |
| Lambda s | 0.052 | suspension creep factor | |
| Loss factors | |||
| Qtp | 0.389 | total Q-factor considering all losses | |
| Qms | 7.567 | mechanical Q-factor of driver in free air considering Rms only | |
| Qes | 0.410 | electrical Q-factor of driver in free air considering Re only | |
| Qts | 0.389 | total Q-factor considering Re and Rms only | |
| Other Parameters | |||
| Vas | 55.4434 | l | equivalent air volume of suspension |
| n0 | 0.312 | % | reference efficiency (2 pi-radiation using Re) |
| Lm | 87.14 | dB | characteristic sound pressure level (at 1 m for 1 W @ Re) |
| Lnom | 87.66 | dB | nominal sensitivity (SPL at 1 m for 1 W @ Zn) |
| Sd | 235.06 | cm² | diaphragm area |
Large Signal Modeling (Linear Xmax Results)
Using Klippel’s Distortion Analyzer 2, Large Signal Identification Module, Pro Driver Stand and provided Panasonic ANR12821 Laser along with Klippel’s Training 3 - Loudspeaker Nonlinearities tutorial, I measured the linear, nonlinear and thermal parameters of this drive unit.
Nonlinearities
Traditionally, Xmax has been defined in one of the following ways:
- the physical overhang of the voice coil (height of the voice coil relative to height of the gap)
- 115% times the physical overhang above
- the point where displacement limit(s) is/are exceeded
The third option is where the Klippel LSI module comes in to play. It permits a more “apples to apples” approach of defining the displacement (Xmax) limits based on the XBL, XC, XL and Xd. The displacement limits XBL, XC, XL and Xd describe the limiting effect for the force factor Bl(x), compliance Cms(x), inductance Le(x) and Doppler effect, respectively, according to the threshold values Blmin, Cmin, Zmax and d2 used by the operator.
There are one of two sets of thresholds which can be used to define linear excursion:
- Non-Subwoofer Drivers: The thresholds Blmin= 82 %, Cmin=75 %, Zmax=10 % and d2=10% generate for a two-tone-signal (f1=fs, f2=8.5fs) 10 % total harmonic distortion and 10 % intermodulation distortion.
- Subwoofer Drivers: The thresholds Blmin= 70 %, Cmin=50 %, Zmax=17 % create 20 % total harmonic distortion which is becoming the standard for acceptable subwoofer distortion thresholds.
These parameters are defined in more detail in the (Klippel) papers:
- “AN04 – Measurement of Peak Displacement Xmax”
- “AN05 - Displacement Limits due to Driver Nonlinearities”
- “AN17 - Credibility of Nonlinear Parameters”
- “Prediction of Speaker Performance at High Amplitudes”
- “Assessment of Voice Coil Peak Displacement Xmax”
- “Assessing Large Signal Performance of Loudspeakers”
Below are the displacement limits’ results for this drive unit obtained from Klippel’s LSI module:
| Displacement Limits | |||
|---|---|---|---|
| X Bl @ Bl min=82% | >8.8 | mm | Displacement limit due to force factor variation |
| X C @ C min=75% | 6.0 | mm | Displacement limit due to compliance variation |
| X L @ Z max=10 % | >8.8 | mm | Displacement limit due to inductance variation |
| X d @ d2=10% | 46.6 | mm | Displacement limit due to IM distortion (Doppler) |
Changing the limits to permit up to 20% THD, typically how subwoofers are tested, yields the following results:
| Displacement Limits | |||
|---|---|---|---|
| X Bl @ Bl min=70% | >8.8 | mm | Displacement limit due to force factor variation |
| X C @ C min=50% | 7.8 | mm | Displacement limit due to compliance variation |
| X L @ Z max=17 % | >8.8 | mm | Displacement limit due to inductance variation |
| X d @ d2=17% | 93.2 | mm | Displacement limit due to IM distortion (Doppler) |
We can break the above information down further. The below text is written by Patrick Turnmire of Red Rock Acoustics and used with his permission, substituting data from this drive unit’s test results where applicable.
Large Signal Modeling
At higher amplitudes, loudspeakers produce substantial distortion in the output signal, generated by nonlinear ties inherent in the transducer. The dominant nonlinear distortions are predictable and are closely related with the general principle, particular design, material properties and assembling techniques of the loudspeaker. The Klippel Distortion Analyzer combines nonlinear measurement techniques with computer simulation to explain the generation of the nonlinear distortions, to identify their physical causes and to give suggestion for constructional improvements. Better insight into the nonlinear mechanisms makes it possible to further optimize the transducer in respect with sound quality, weight, size and cost.
Nonlinear Characteristics
The dominant nonlinearities are modelled by variable parameters such as
| Bl(x) | instantaneous electro-dynamic coupling factor (force factor of the motor) defined by the integral of the magnetic flux density B over voice coil length l as a function of displacement |
| KMS(x) | mechanical stiffness of driver suspension a function of displacement |
| LE(i) | voice coil inductance as a function of input current (describes nonlinear permeability of the iron path) |
| LE(x) | voice coil inductance as a function of displacement |
Nonlinear Parameters
**Click HERE for Explanations of the below data**
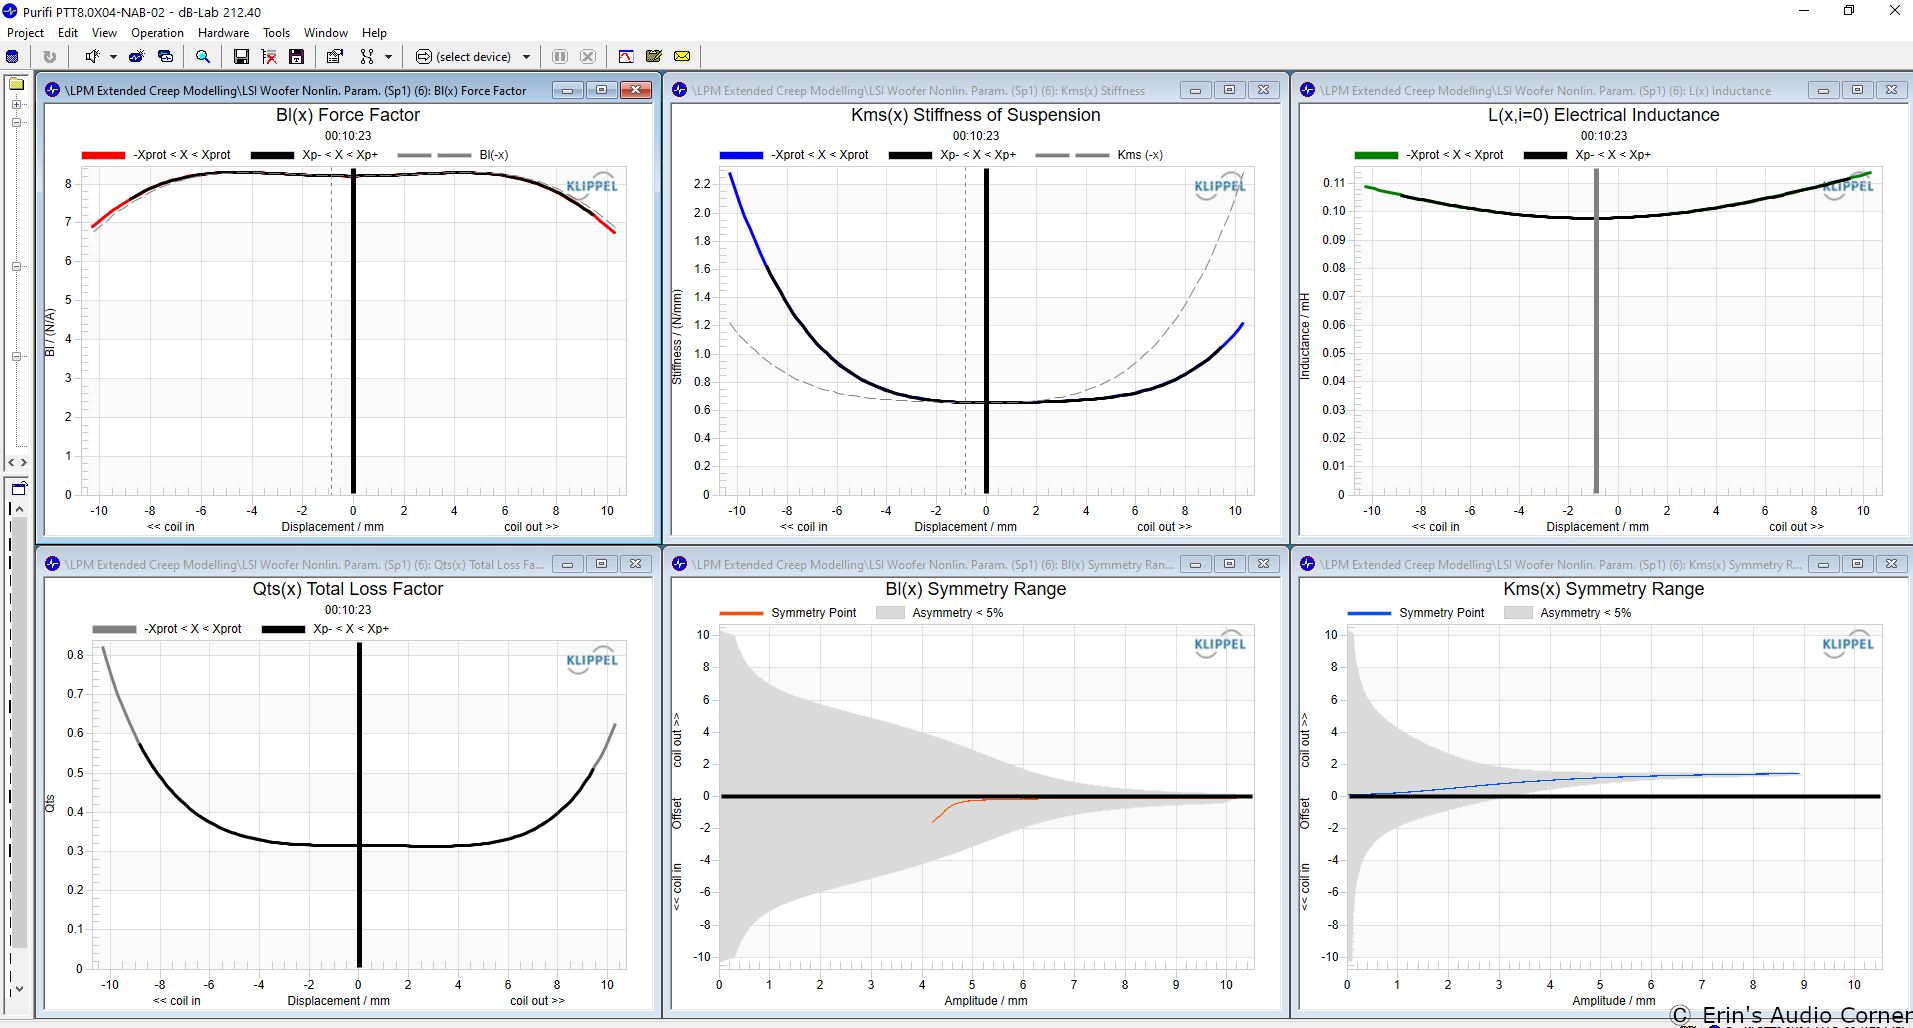
Bl change with excursion
The electrodynamic coupling factor, also called Bl-product or force factor Bl(x), is defined by the integral of the magnetic flux density B over voice coil length l and translates current into force. In traditional modeling this parameter is assumed to be constant. The force factor Bl(0) at the rest position corresponds with the Bl-product used in linear modeling. The red curve displays Bl over the entire displacement range covered during the measurement. You see the typical decay of Bl when the voice coil moves out of the gap. At the end of the measurement, the black curve shows the confidential range (interval where the voice coil displacement in this range occurred 99% of the measurement time). During the measurement, the black curve shows the current working range. The dashed curve displays Bl(x) mirrored at the rest position of the voice coil – this way, asymmetries can be quickly identified. Since a laser was connected during the measurement, a coil in / coil out marker is displayed on the bottom left / bottom right.
Suspension Stiffness change with excursion
The stiffness KMS(x) describes the mechanical properties of the suspension. Its inverse is the compliance CMS(x).
Inductance change with excursion
The inductance components Le (x) and Bl(i) of most drivers have a strong asymmetric characteristic. If the voice coil moves towards the back plate the inductance usually increases since the magnetic field generated by the current in the voice coil has a lower magnetic resistance due to the shorter air path. The nonlinear inductance Le(x) has two nonlinear effects. First the variation of the electrical impedance with voice coil displacement x affects the input current of the driver. Here the nonlinear source of distortion is the multiplication of displacement and current. The second effect is the generation of a reluctance force which may be interpreted as an electromagnetic motor force proportional to the squared input current.
The flux modulation Bl(i) has two effects too. On the electrical side the back EMF Bl(i)*v produces nonlinear distortion due to the multiplication of current i and velocity v. On the mechanical side the driving force F = Bl(i)*i comprises a nonlinear term due to the squared current i. This force produces similar effects as the variable term Le(x).
Asymmetrical Nonlinearities
Asymmetrical nonlinearities produce not only second- and higher-order distortions but also a dc-part in the displacement by rectifying low frequency components. For an asymmetric stiffness characteristic the dc-components moves the voice coil for any excitation signal in the direction of the stiffness minimum. For an asymmetric force factor characteristic the dc-component depends on the frequency of the excitation signal. A sinusoidal tone below resonance (f<fS) would generate or force moving the voice coil always in the force factor maximum. This effect is most welcome for stabilizing voice coil position. However, above the resonance frequency (f>fS) would generate a dc-component moving the voice coil in the force factor minimum and may cause severe stability problems. For an asymmetric inductance characteristic the dc-component moves the voice coil for any excitation signal in the direction of the inductance maximum. Please note that the dynamically generated DC-components cause interactions between the driver nonlinearities. An optimal rest position of the coil in the gap may be destroyed by an asymmetric compliance or inductance characteristic at higher amplitudes. The module Large Signal Simulation (SIM) allows systematic investigation of the complicated behavior.
Bl symmetry xb(x)
This curve shows the symmetry point in the nonlinear Bl-curve where a negative and positive displacement x=xpeak will produce the same force factor Bl(xb(x) + x) = Bl(xb(x) – x).
If the shift xb(x) is independent on the displacement amplitude x then the force factor asymmetry is caused by an offset of the voice coil position and can be simply compensated.
If the optimal shift xb(x) varies with the displacement amplitude x then the force factor asymmetry is caused by an asymmetrical geometry of the magnetic field and cannot completely be compensated by coil shifting.
Kms Symmetry xc(x)
This curve shows the symmetry point in the nonlinear compliance curve where a negative and positive displacement x=xpeak will produce the same compliance value kms(xc(x) + x) = kms(xc(x) – x).
A high value of the symmetry point xc(x) at small displacement amplitudes x » 0 indicates that the rest position does not agree with the minimum of the stiffness characteristic. This may be caused by an asymmetry in the geometry of the spider (cup form) or surround (half wave). A high value of the symmetry point xc(x) at maximal displacement x» xmax may be caused by asymmetric limiting of the surround.
Parameters at the Rest Position
For accurate system modelling “Large + Cold” parameters are preferable to “Small Signal” parameters because they more closely reflect the parameters in their typical operating range.
| Symbol | Large + Warm | Large + Cold | Small Signal | Unit | Comment |
|---|---|---|---|---|---|
| Note: | For accurate small signal parameters, use LPM module | ||||
| ———————– | ———- | ———- | ——— | —— | ————————————————————————————————————– |
| Delta Tv [referenced] | 46.0 | 0 | K | Increase of voice coil temperature during the measurement referenced to imported Re(Delta Tv=0K) | |
| Delta Tv = Tv-Ta | 24.5 | 0 | 0 | K | Increase of voice coil temperature during the measurement |
| Xprot | 10.3 | 10.3 | 2.1 | mm | Maximum voice coil excursion (limited by protection system) |
| Re(Tv) | 4.17 | 3.82 | 3.82 | Ohm | Voice coil resistance considering increase of voice coil temperature Tv |
| Le(x=0) | 0.10 | 0.10 | 0.12 | mH | Voice coil inductance at the rest position of the voice coil |
| L2(x=0) | 0.35 | 0.35 | 0.14 | mH | Ppara-inductance at the rest position due to the effect of eddy current |
| R2(x=0) | 0.31 | 0.31 | 0.55 | Ohm | Resistance at the rest position due to eddy currents |
| Cmes(x=0) | 711 | 711 | 725 | µF | Electrical capacitance representing moving mass |
| Lces(x=0) | 94.27 | 94.27 | 59.84 | mH | Electrical inductance at the rest position representing driver compliance |
| Res(x=0) | 73.87 | 73.87 | 24.00 | Ohm | Resistance at the rest position due to mechanical losses |
| Qms(x=0, Tv) | 6.41 | 6.41 | 2.64 | Mechanical Q-factor considering the mechanical system only | |
| Qes(Tv) | 0.33 | 0.30 | 0.42 | Electrical Q-factor considering Re (Tv) only | |
| Qts(x=0, Tv) | 0.32 | 0.29 | 0.36 | Total Q-factor considering Re (Tv) and Rms only | |
| fs | 19.4 | 19.4 | 24.2 | Hz | Driver resonance frequency |
| Mms | 43.828 | 43.828 | g | (calculated from imported Bl) Mechanical mass of driver diaphragm assembly including voice-coil and air load | |
| Rms(x=0) | 0.835 | 0.835 | 2.807 | kg/s | Mechanical resistance of total-driver losses |
| Cms(x=0) | 1.53 | 1.53 | 0.89 | mm/N | Mechanical compliance of driver suspension at the rest position |
| Kms(x=0) | 0.65 | 0.65 | 1.13 | N/mm | Mechanical stiffness of driver suspension at the rest position |
| Bl(x=0) | 8.21 | 8.21 | 8.21 | N/A | (imported) Force factor at the rest position (Bl product) |
| Vas | 119.1489 | 119.1489 | 69.1978 | l | Equivalent air volume of suspension |
| N0 | 0.253 | 0.277 | 0.223 | % | Reference efficiency (2Pi-sr radiation using Re) |
| Lm | 86.2 | 86.6 | 85.6 | dB | Characteristic sound pressure level |
| Sd | 235.06 | 235.06 | 235.06 | cm² | Diaphragm area |
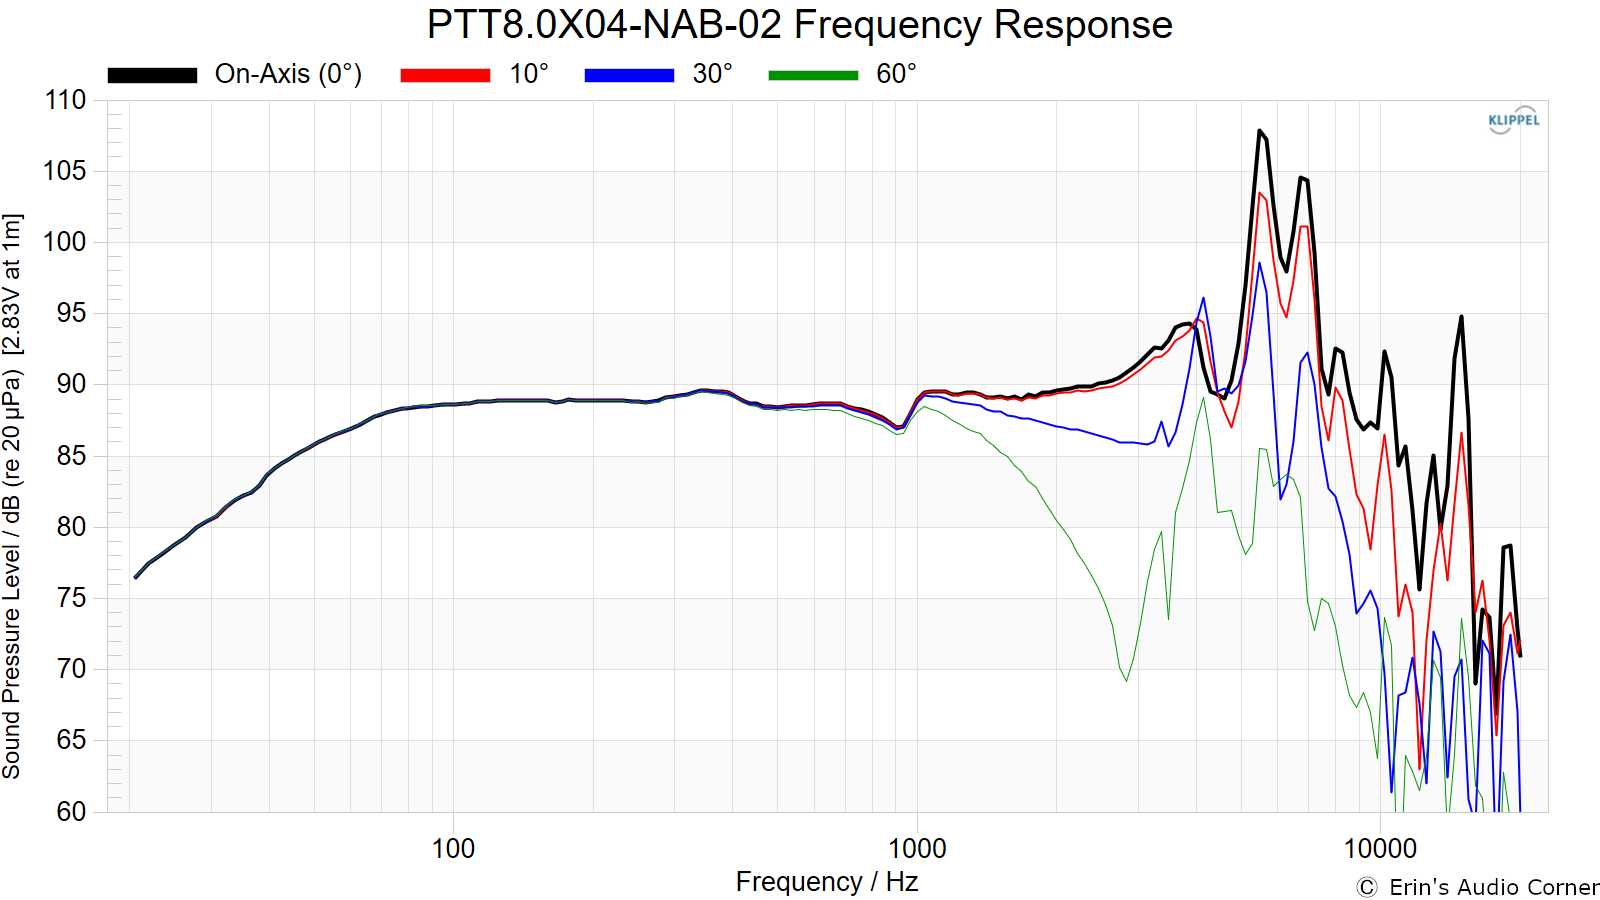
Frequency Response
All data collected using Klippel’s Near-Field Scanner. The Near-Field-Scanner 3D (NFS) offers a fully automated acoustic measurement of direct sound radiated from the source under test. The radiated sound is determined in any desired distance and angle in the 3D space outside the scanning surface. Directivity, sound power, SPL response and many more key figures are obtained for any kind of loudspeaker and audio system in near field applications (e.g. studio monitors, mobile devices) as well as far field applications (e.g. professional audio systems). Utilizing a minimum of measurement points, a comprehensive data set is generated containing the loudspeaker’s high resolution, free field sound radiation in the near and far field. For a detailed explanation of how the NFS works and the science behind it, please watch the below discussion with designer Christian Bellmann:
This speaker was measured using the Klippel Near Field Scanner Baffle module, permitting accurate “infinite baffle” results. Per Klippel’s documentation (here):
“By scanning on 2 hemi-spheres in front of the speaker, room reflection as well as diffraction effects from the baffle can be removed, providing accurate half space data.”
The test baffle has a sealed volume of approximately 2ft³ which is well above Vas for this driver. If you would like to see the construction of my baffle, please watch this video.
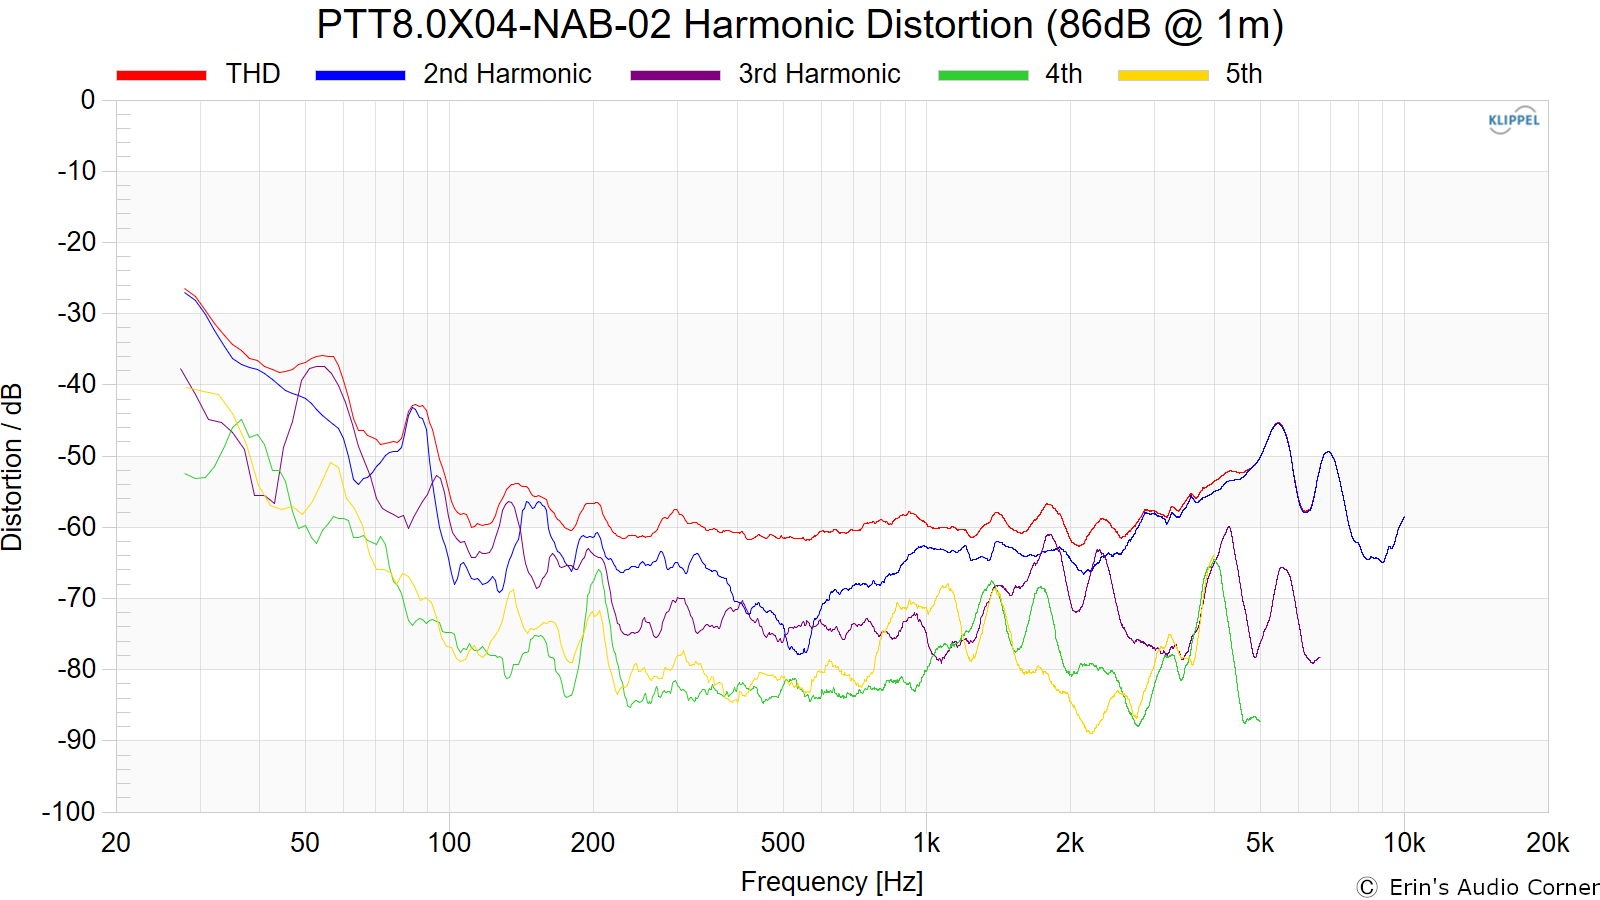
Harmonic Distortion:
Harmonic Distortion at 86dB @ 1m:
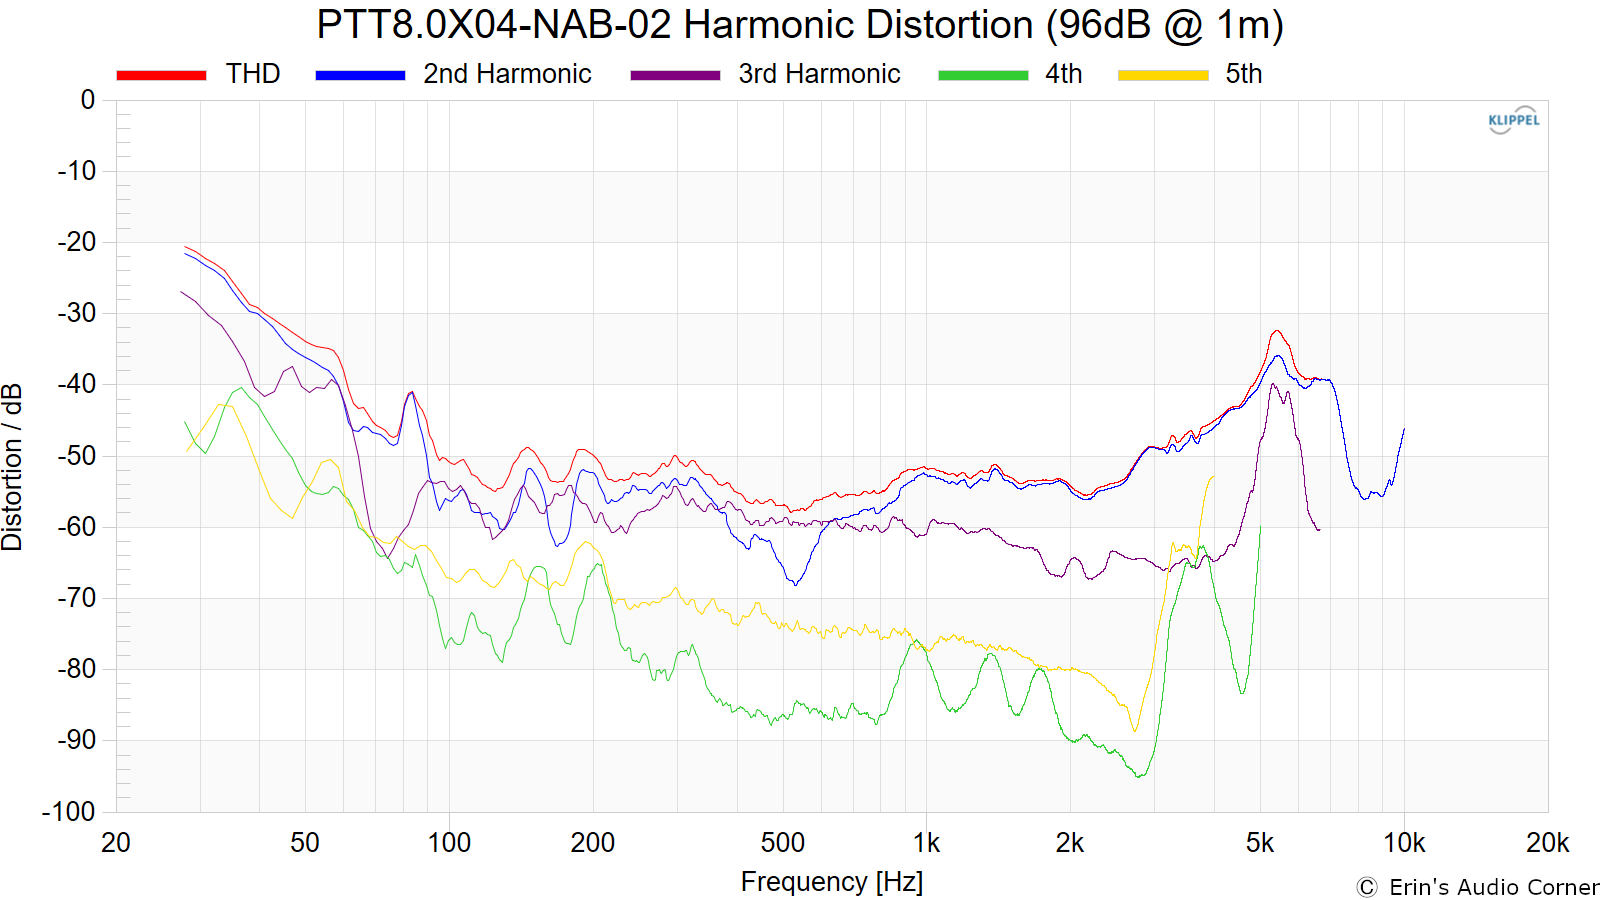
Harmonic Distortion at 96dB @ 1m:
Intermodulated Distortion (IMD):
Klippel’s 3D-DISTORTION MEASUREMENT (DIS) module is used to calculate the Intermodulated Distortion for this drive unit.
Measurements were completed in the nearfield. Multiple output levels were tested to provide the trend of distortion component profiles and to provide a comparison against other drive units I have tested. The SPL provided is relative to 1 meter distance, averaged in the noted bandpass region.
Unlike Harmonic Distortion - which is a measure of only harmonics from a single tone - IMD is tested with two tones at the same time: a low frequency “bass tone” near Fs and a higher frequency “voice tone” much greater than Fs. For example a speaker driver plays 30Hz at the same time it plays 200Hz. Any distortion artifacts created by the sum and/or difference of the speaker playing both tones at the same time is a result of IMD. In this example, the speaker is supposed to play only 30Hz & 200Hz at the same time. Thanks to IMD, it plays 200Hz ± 30Hz. Second order IMD would be 200 ± 30Hz = 170Hz & 230Hz. Third order IMD would be 200 ± 60Hz = 140Hz & 260Hz. If these ‘side bands’ are high enough in output then they are heard as distortion. If not, they are not.
With that in mind, I used Klippel’s DIS module to test this drive unit in two ways:
- “Bass tone” fixed at 30Hz, with a “voice sweep” where the 200Hz - 6kHz region is played, one tone at a time (over 50 individual tones).
- The same as above, but the “bass tone” fixed at 80Hz.
The purpose of me testing with two methods (different “bass tones”) is to see the difference between what happens when the driver plays with high(er) excursion vs when a typical HPF is used. All similarly sized and similarly purposed speakers are tested in the same manner. For better or worse. This means a 6-inch midwoofer is tested the same way an 8-inch midwoofer is. Ultimately, this is for my sanity, because having numerous measurement methods for all sizes of speakers would muddy the waters quickly and wouldn’t give us an idea of when performance is great (say, a 6-inch midwoofer that has much less distortion than an 8-inch) or vice-versa.
The above is tested at 2 voltages each with an equivalent 86dB & 96dB @ 1m output. As is the case with the multiple HD tests, the multiple IMD levels provides an idea of what the speaker’s IMD profiles look like as the output of the speaker is increased.
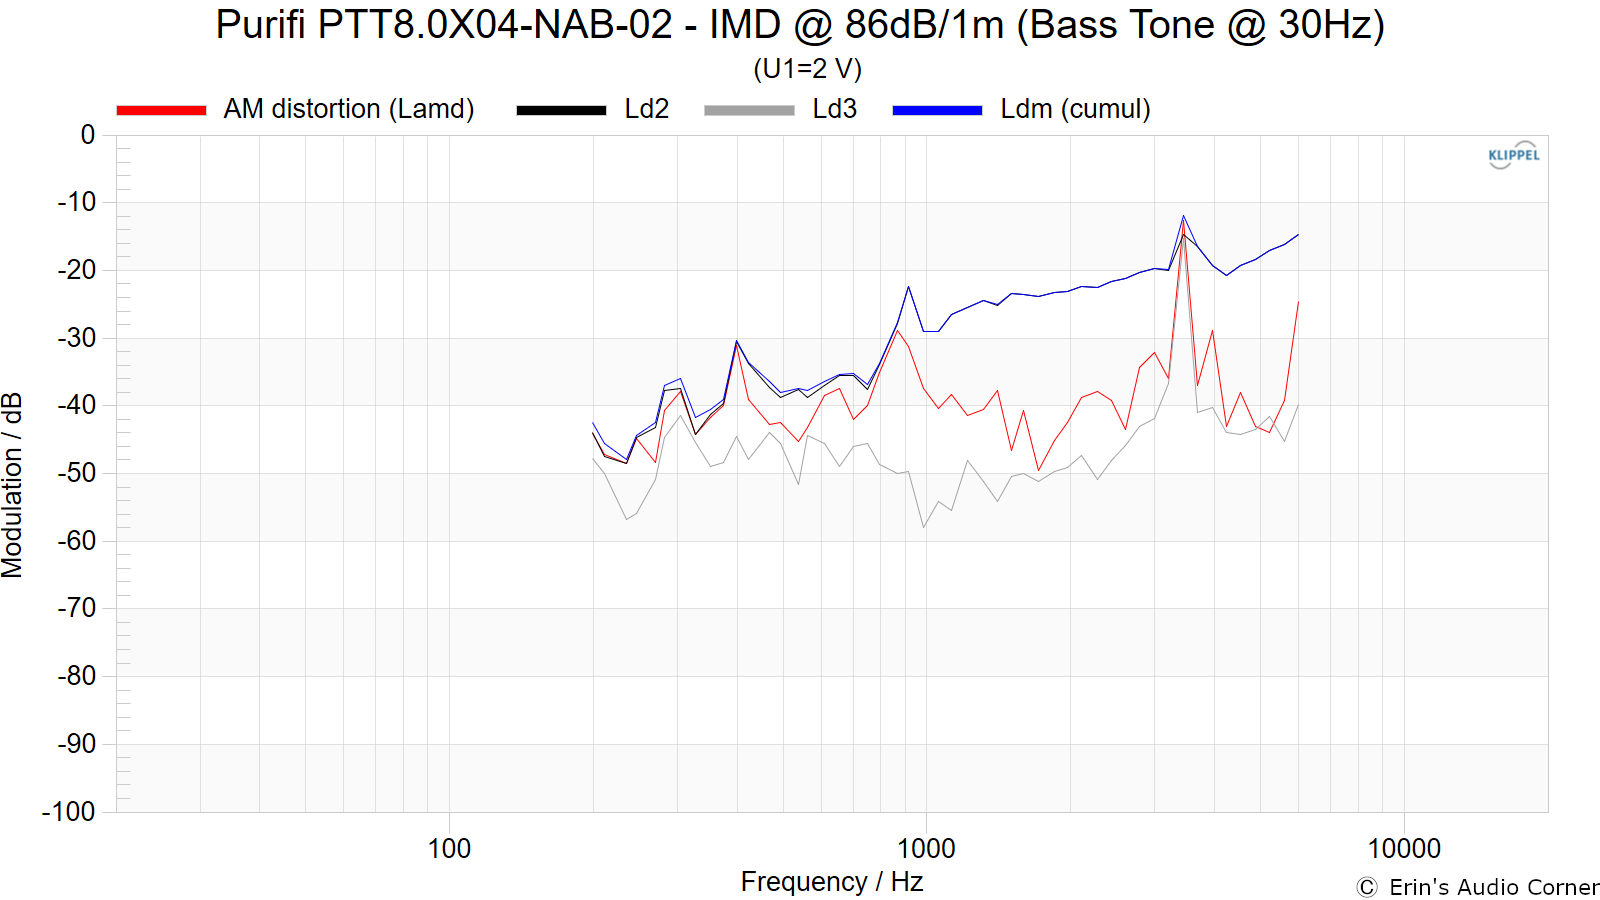
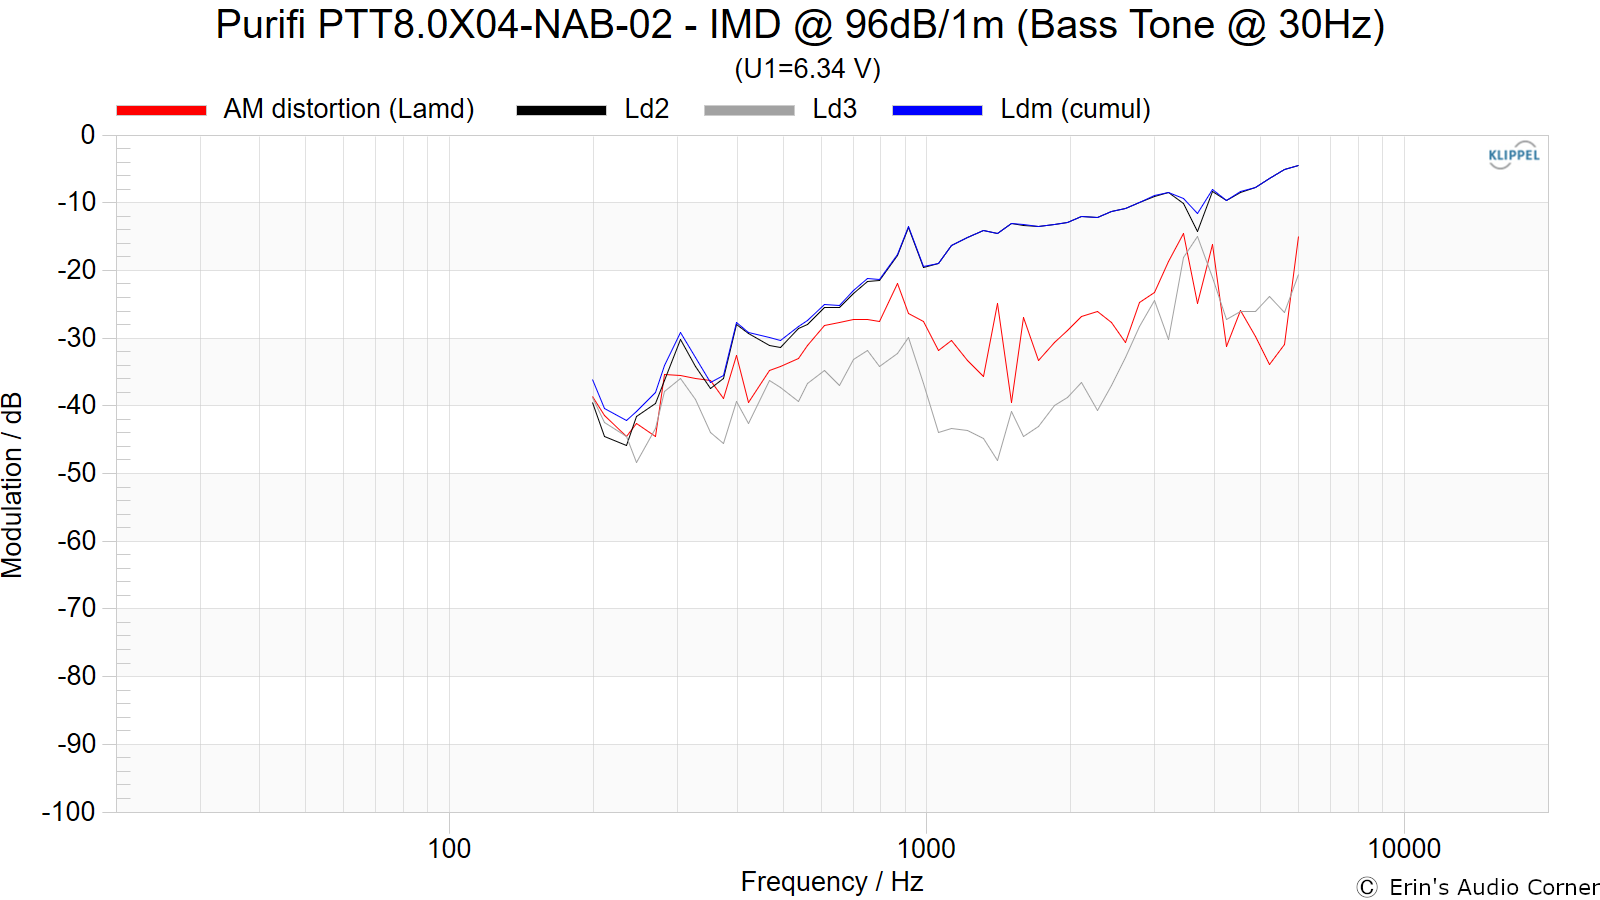
Test 1: Bass Tone at 30Hz, Voice Tones from 200-6000Hz
86dB @ 1m:
96dB @ 1m:
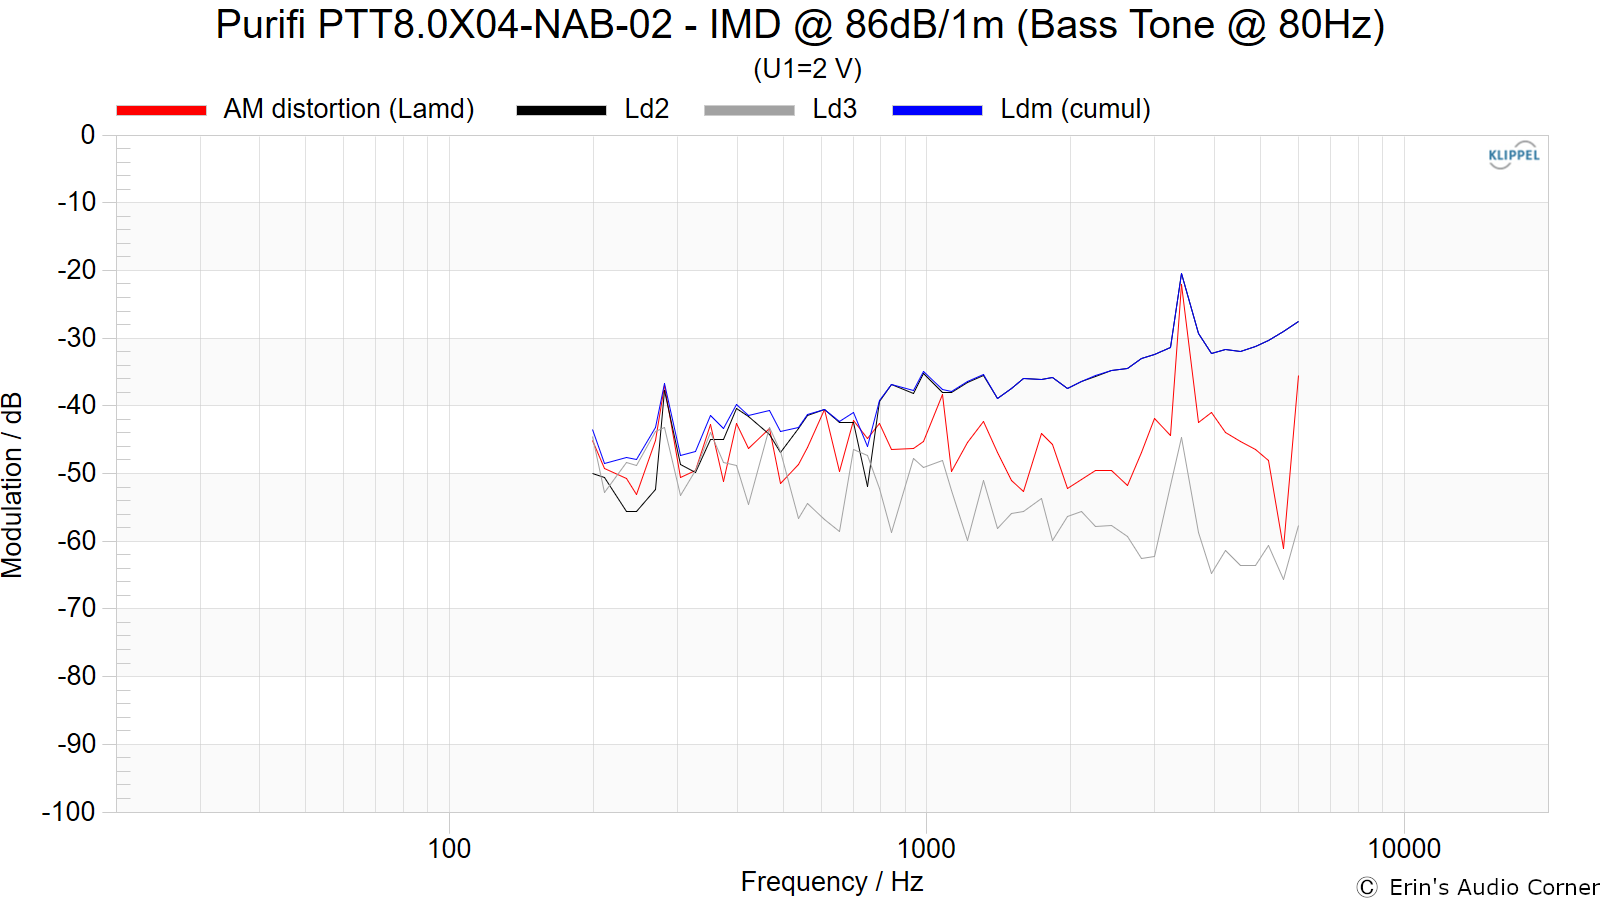
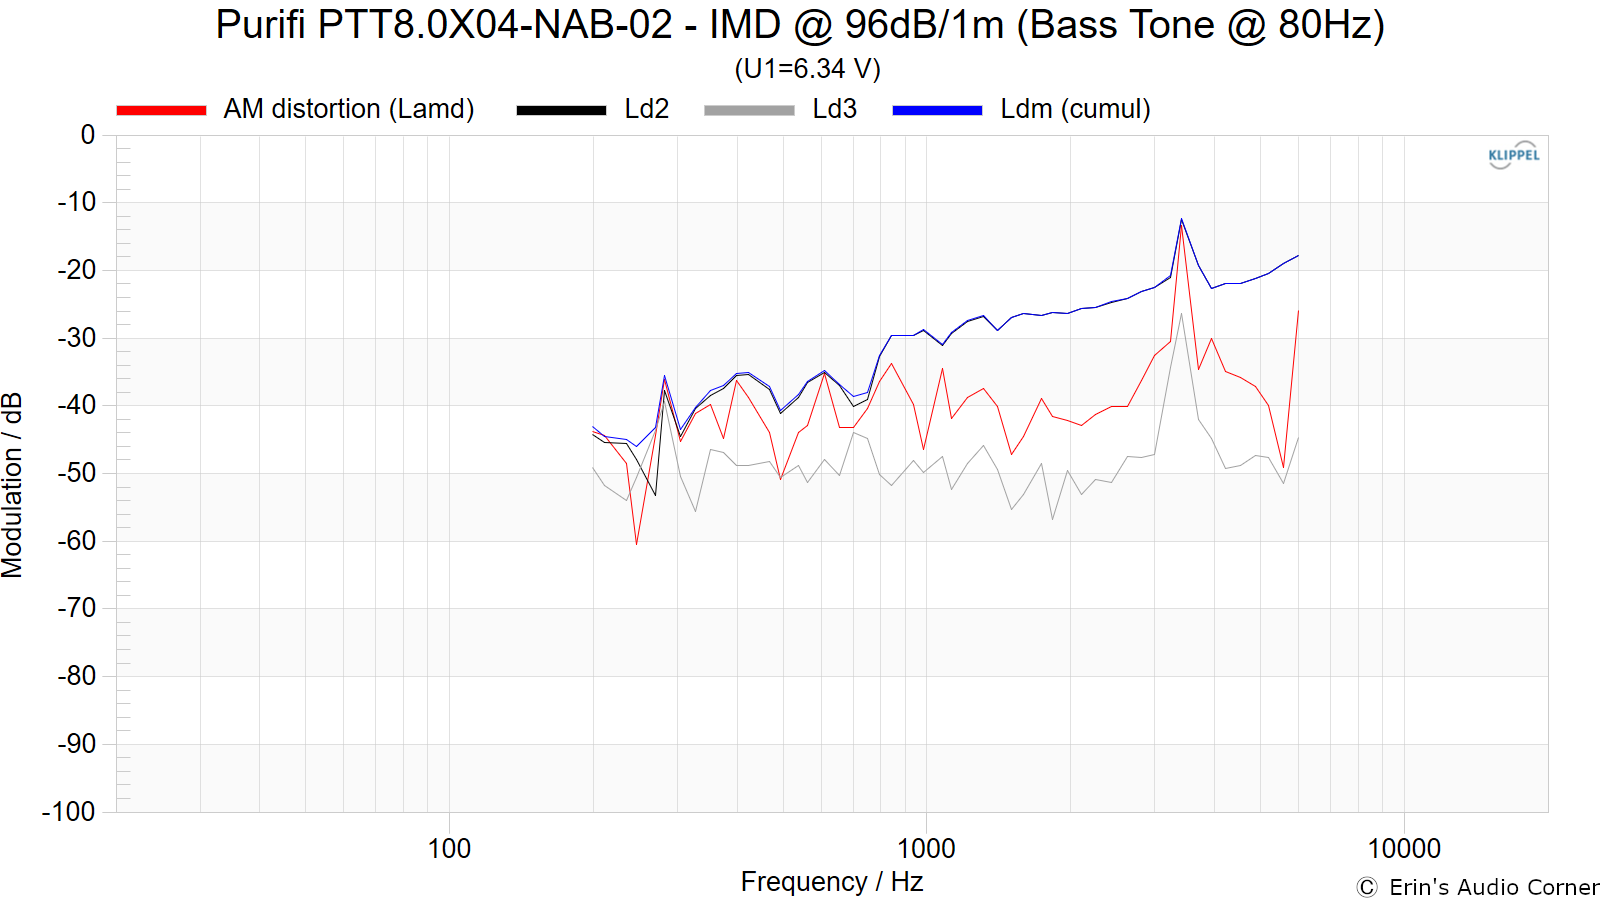
Test 2: Bass Tone at 80Hz, Voice Tones from 200-6000Hz
86dB @ 1m:
96dB @ 1m:
Support the Cause
If you find this review helpful and want to help support the cause there are a few ways you can do so below. Your support helps me pay for new items to test, hardware, miscellaneous items needed for testing and costs of the site’s server space and bandwidth. Any help is very much appreciated.
Join my Patreon: Become a Patron!
Or using my product affiliate link below to buy anything they sell that you want to try out. This will earn me a small commission at no additional cost to you. You can use these links anytime, now or in the future.
You can also join my Facebook and YouTube pages if you’d like to follow along with updates.