Foreword / YouTube Video Review
These speakers were loaned to me for review by Arendal. I was not paid for the review and I sent them back. Arendal did not see the review before publication.
Update 05/26/2022: Arendal saw the results and had some concerns regarding the difference in their specification vs what my results initially showed showed in the response above 10kHz. They sent the units to their factory in Norway to verify the results. Once they verified, they looked into the issue and verified no others from the production batch were subject to the cause. They swapped the tweeters out and sent me the pair again to re-review. So, here we are.
The review on this website is a brief overview and summary of the objective performance of this speaker. It is not intended to be a deep dive. Moreso, this is information for those who prefer “just the facts” and prefer to have the data without the filler. The video below has more discussion.
< coming soon >
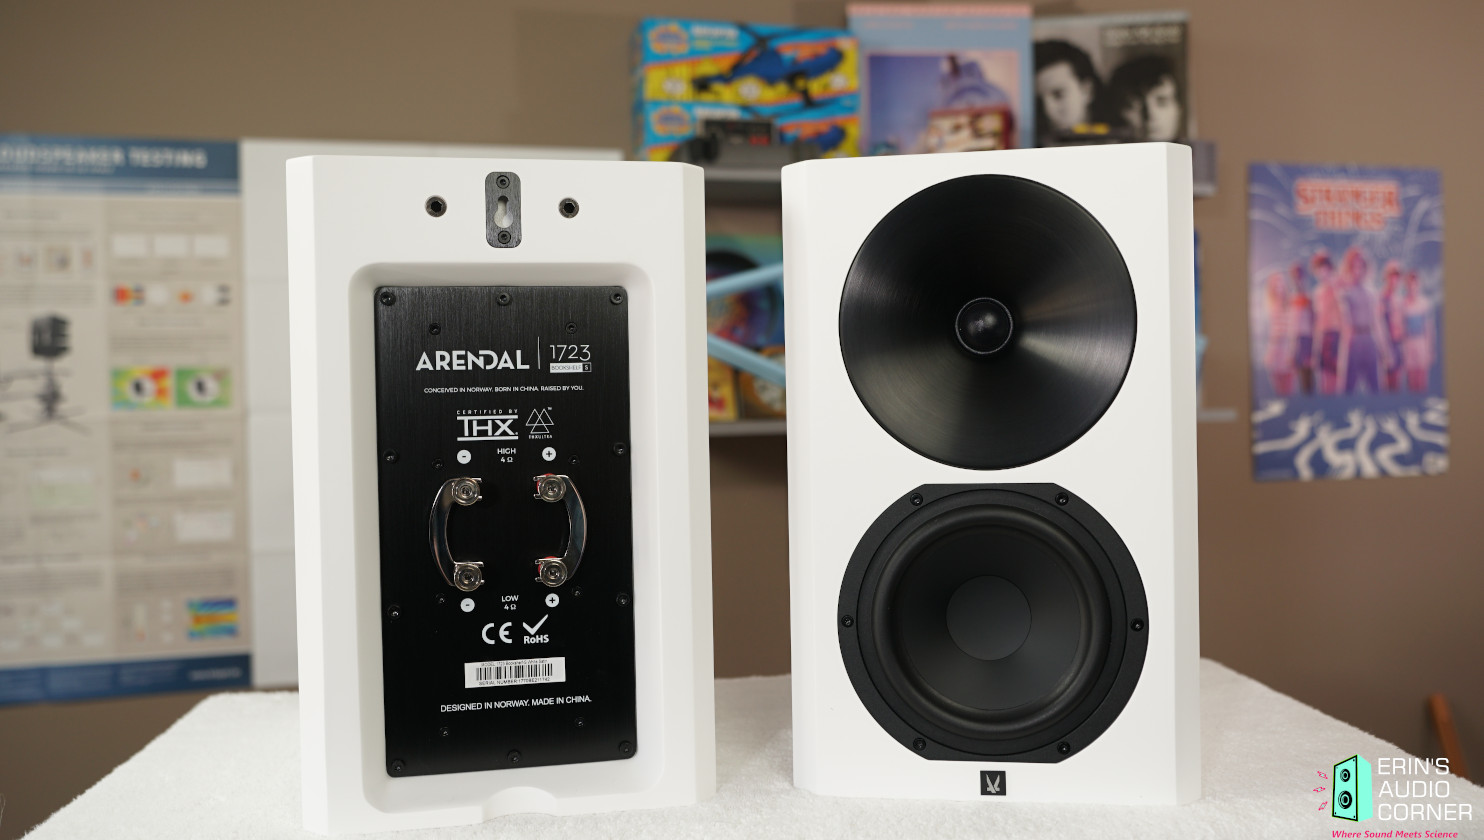
Information and Photos
Some specs from the manufacturer can be found here.
- Design: 2-way
- Tweeter: 28mm
- Woofer: 6.5-inch
- Enclosure: Sealed
- Enclosure Material: HDF
- Crossover Frequency: 1500Hz
- Sensitivity: 84dB @2.83v/1m
- Impedance: 4-Ohms Nominal
- Dimensions: 38.5H x 24.5W x 32.0D cm
- Weight: 15.5kg
The current price is approximately $1499 USD/pair.
CTA-2034 (SPINORAMA) and Accompanying Data
All data collected using Klippel’s Near-Field Scanner. The Near-Field-Scanner 3D (NFS) offers a fully automated acoustic measurement of direct sound radiated from the source under test. The radiated sound is determined in any desired distance and angle in the 3D space outside the scanning surface. Directivity, sound power, SPL response and many more key figures are obtained for any kind of loudspeaker and audio system in near field applications (e.g. studio monitors, mobile devices) as well as far field applications (e.g. professional audio systems). Utilizing a minimum of measurement points, a comprehensive data set is generated containing the loudspeaker’s high resolution, free field sound radiation in the near and far field. For a detailed explanation of how the NFS works and the science behind it, please watch the below discussion with designer Christian Bellmann:
The reference plane in this test is at the tweeter.
Measurements are provided in a format in accordance with the Standard Method of Measurement for In-Home Loudspeakers (ANSI/CTA-2034-A R-2020). For more information, please see this link.
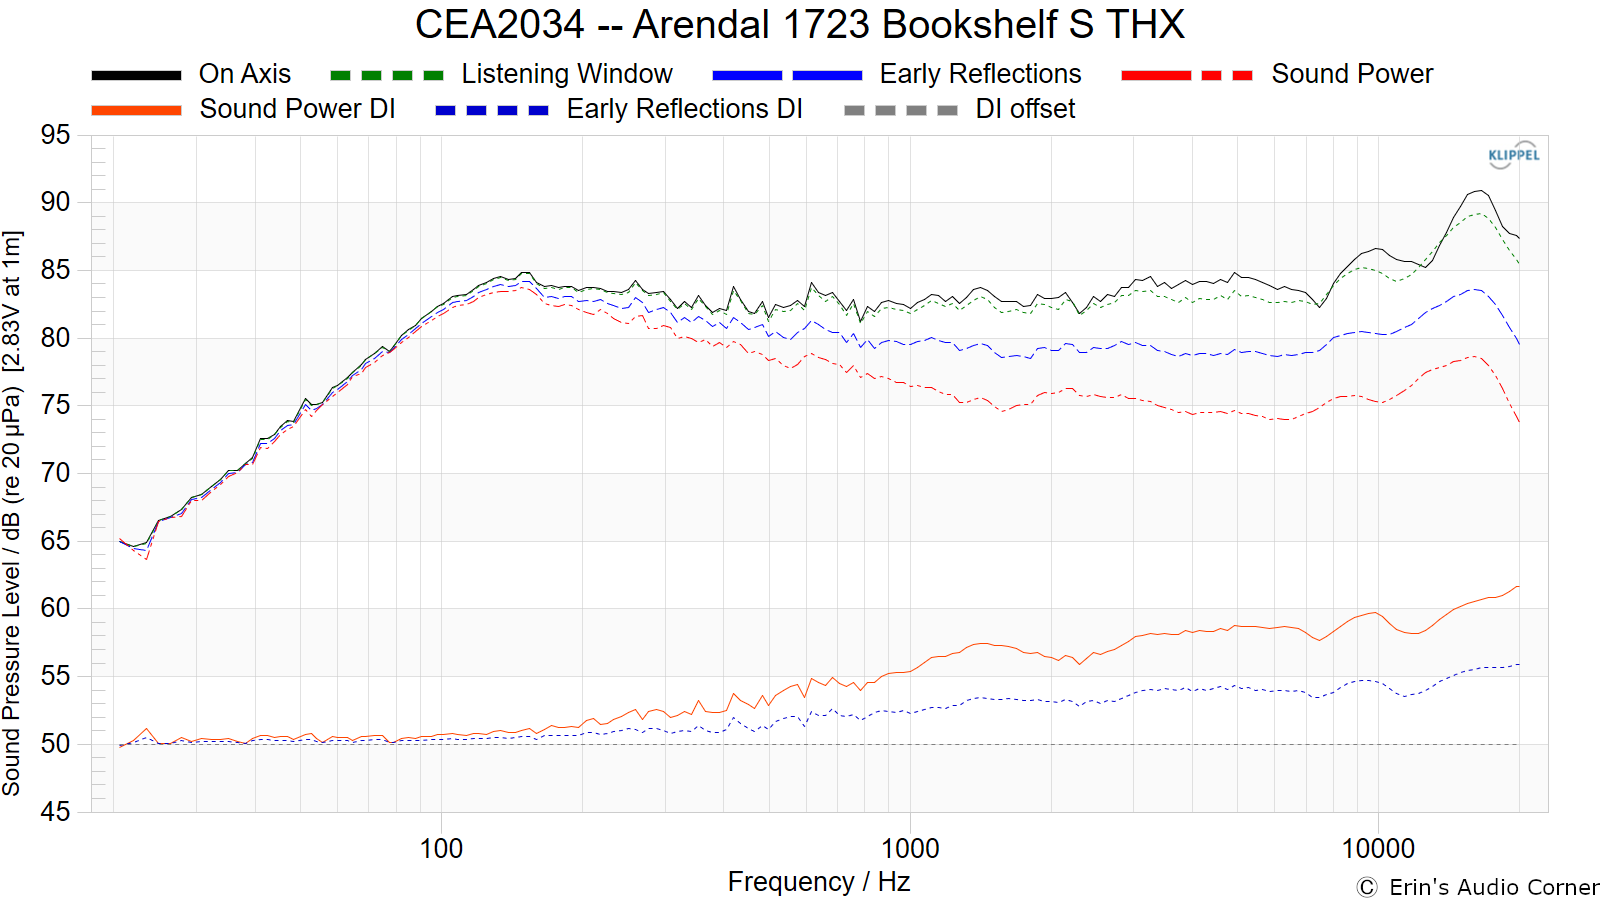
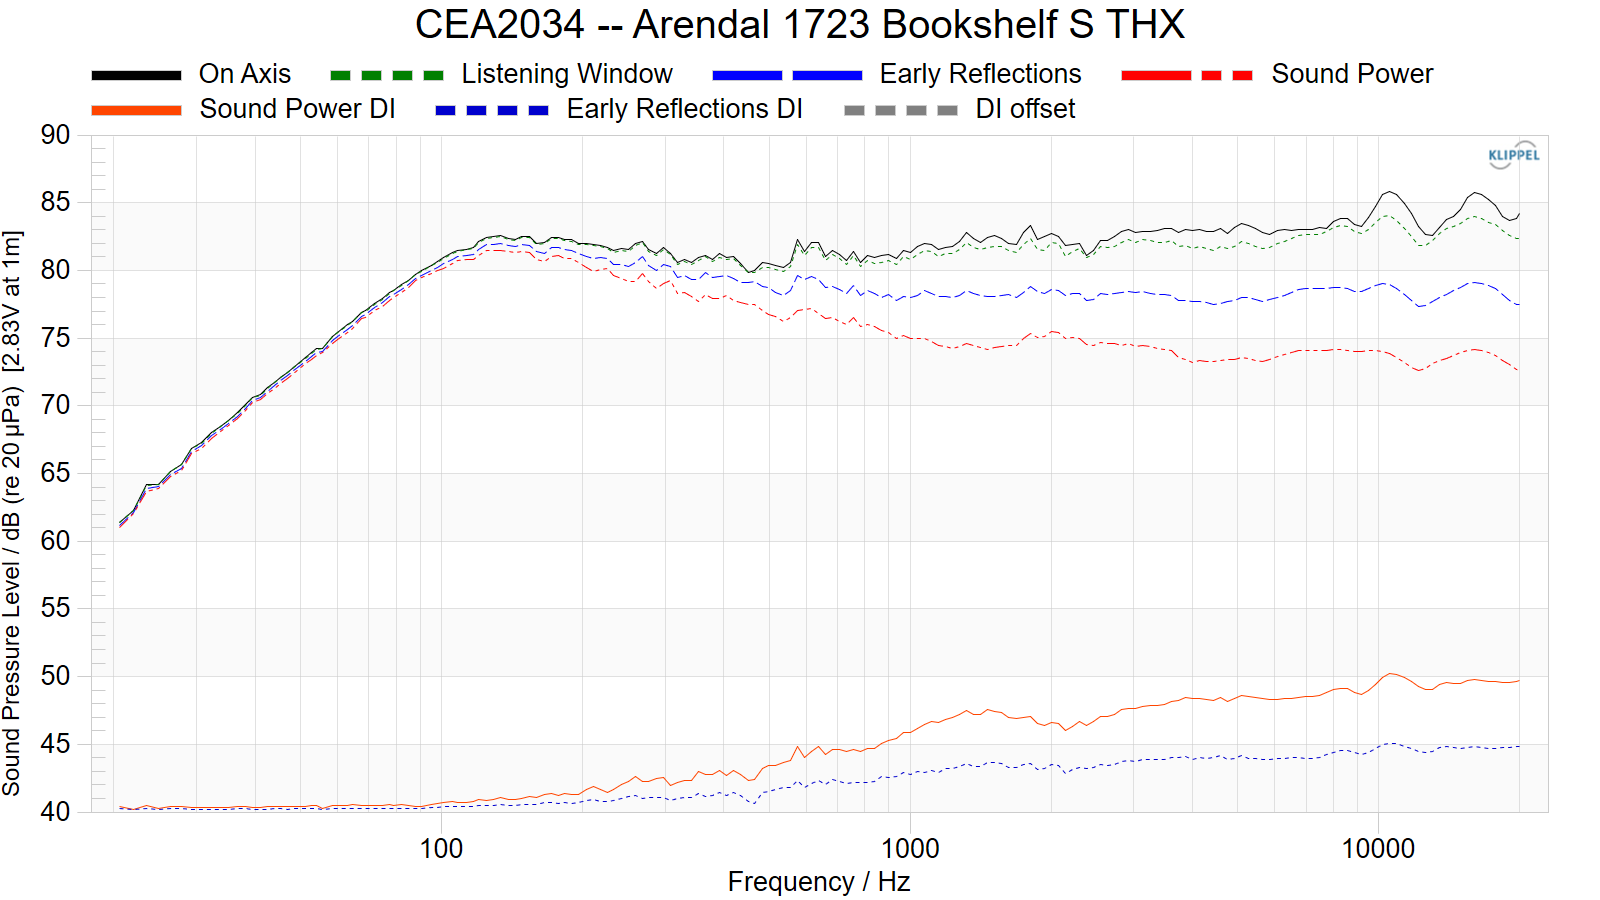
CTA-2034 / SPINORAMA:
The On-axis Frequency Response (0°) is the universal starting point and in many situations it is a fair representation of the first sound to arrive at a listener’s ears.
The Listening Window is a spatial average of the nine amplitude responses in the ±10º vertical and ±30º horizontal angular range. This encompasses those listeners who sit within a typical home theater audience, as well as those who disregard the normal rules when listening alone.
The Early Reflections curve is an estimate of all single-bounce, first-reflections, in a typical listening room.
Sound Power represents all of the sounds arriving at the listening position after any number of reflections from any direction. It is the weighted rms average of all 70 measurements, with individual measurements weighted according to the portion of the spherical surface that they represent.
Sound Power Directivity Index (SPDI): In this standard the SPDI is defined as the difference between the listening window curve and the sound power curve.
Early Reflections Directivity Index (EPDI): is defined as the difference between the listening window curve and the early reflections curve. In small rooms, early reflections figure prominently in what is measured and heard in the room so this curve may provide insights into potential sound quality.
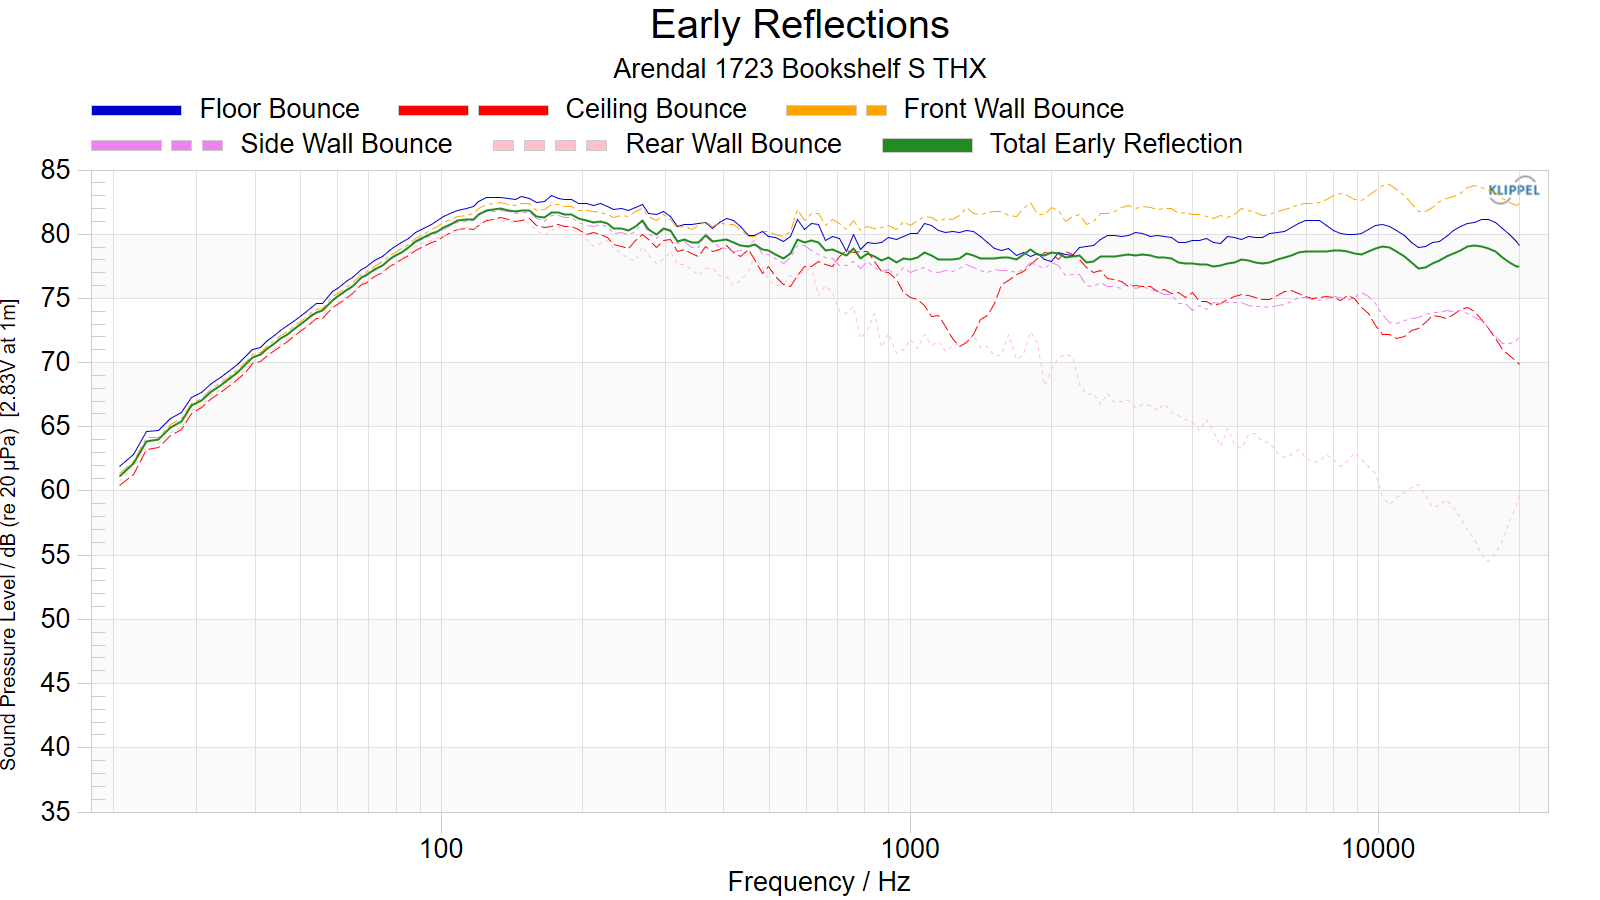
Early Reflections Breakout:
Floor bounce: average of 20º, 30º, 40º down
Ceiling bounce: average of 40º, 50º, 60º up
Front wall bounce: average of 0º, ± 10º, ± 20º, ± 30º horizontal
Side wall bounces: average of ± 40º, ± 50º, ± 60º, ± 70º, ± 80º horizontal
Rear wall bounces: average of 180º, ± 90º horizontal
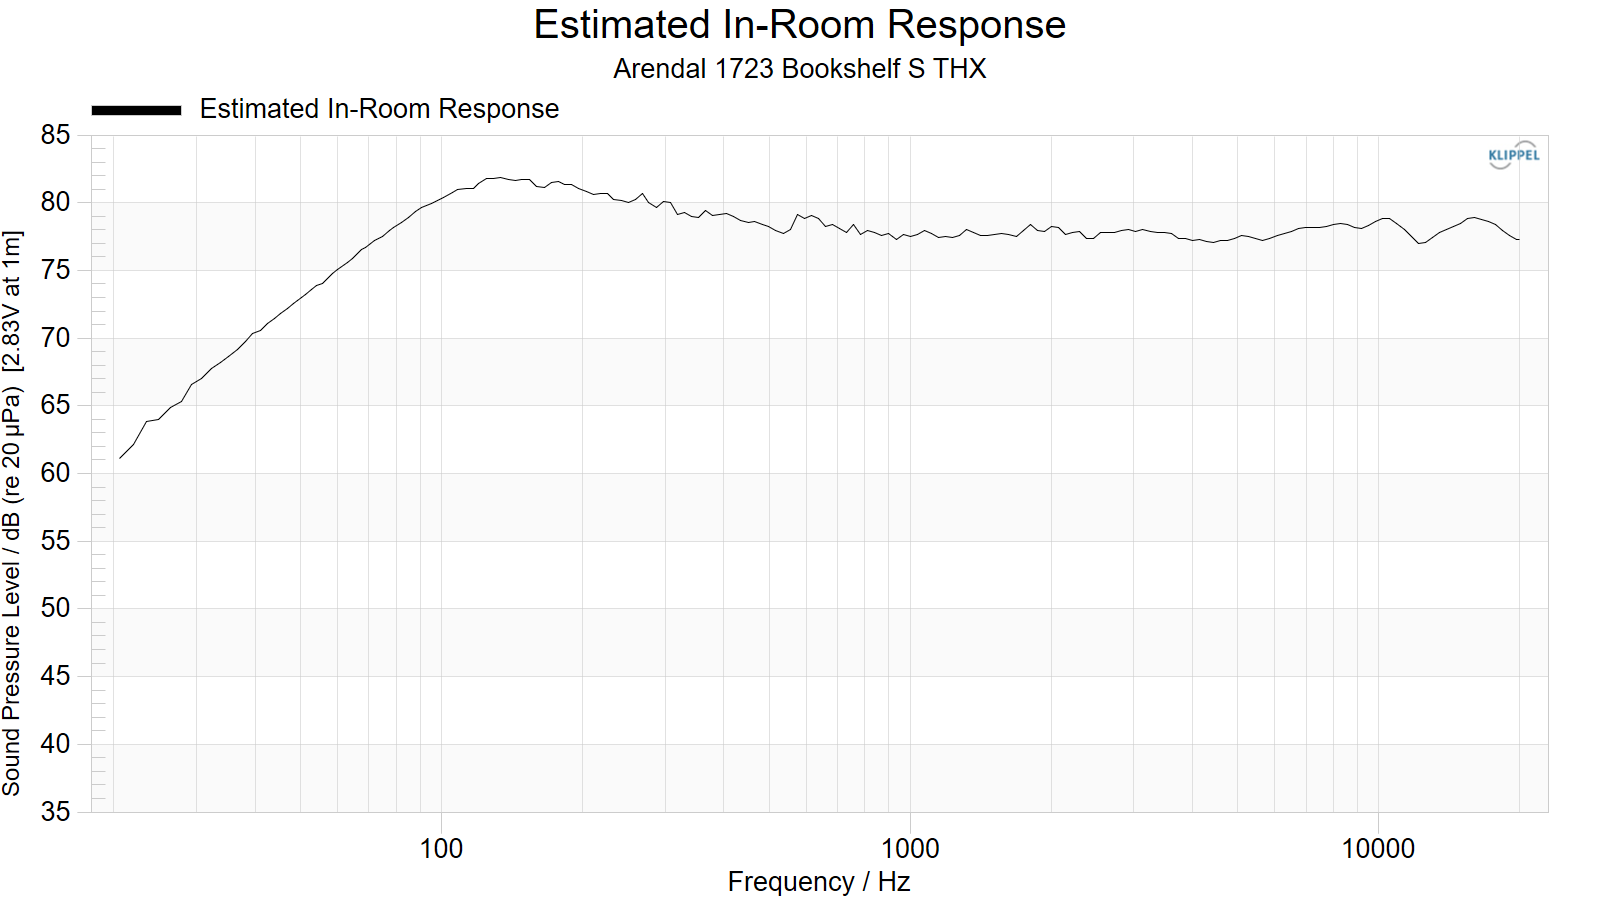
Estimated In-Room Response:
In theory, with complete 360-degree anechoic data on a loudspeaker and sufficient acoustical and geometrical data on the listening room and its layout it would be possible to estimate with good precision what would be measured by an omnidirectional microphone located in the listening area of that room. By making some simplifying assumptions about the listening space, the data set described above permits a usefully accurate preview of how a given loudspeaker might perform in a typical domestic listening room. Obviously, there are no guarantees, because individual rooms can be acoustically aberrant. Sometimes rooms are excessively reflective (“live”) as happens in certain hot, humid climates, with certain styles of interior décor and in under-furnished rooms. Sometimes rooms are excessively “dead” as in other styles of décor and in some custom home theaters where acoustical treatment has been used excessively. This form of post processing is offered only as an estimate of what might happen in a domestic living space with carpet on the floor and a “normal” amount of seating, drapes and cabinetry.
For these limited circumstances it has been found that a usefully accurate Predicted In-Room (PIR) amplitude response, also known as a “room curve” is obtained by a weighted average consisting of 12 % listening window, 44 % early reflections and 44 % sound power. At very high frequencies errors can creep in because of excessive absorption, microphone directivity, and room geometry. These discrepancies are not considered to be of great importance.
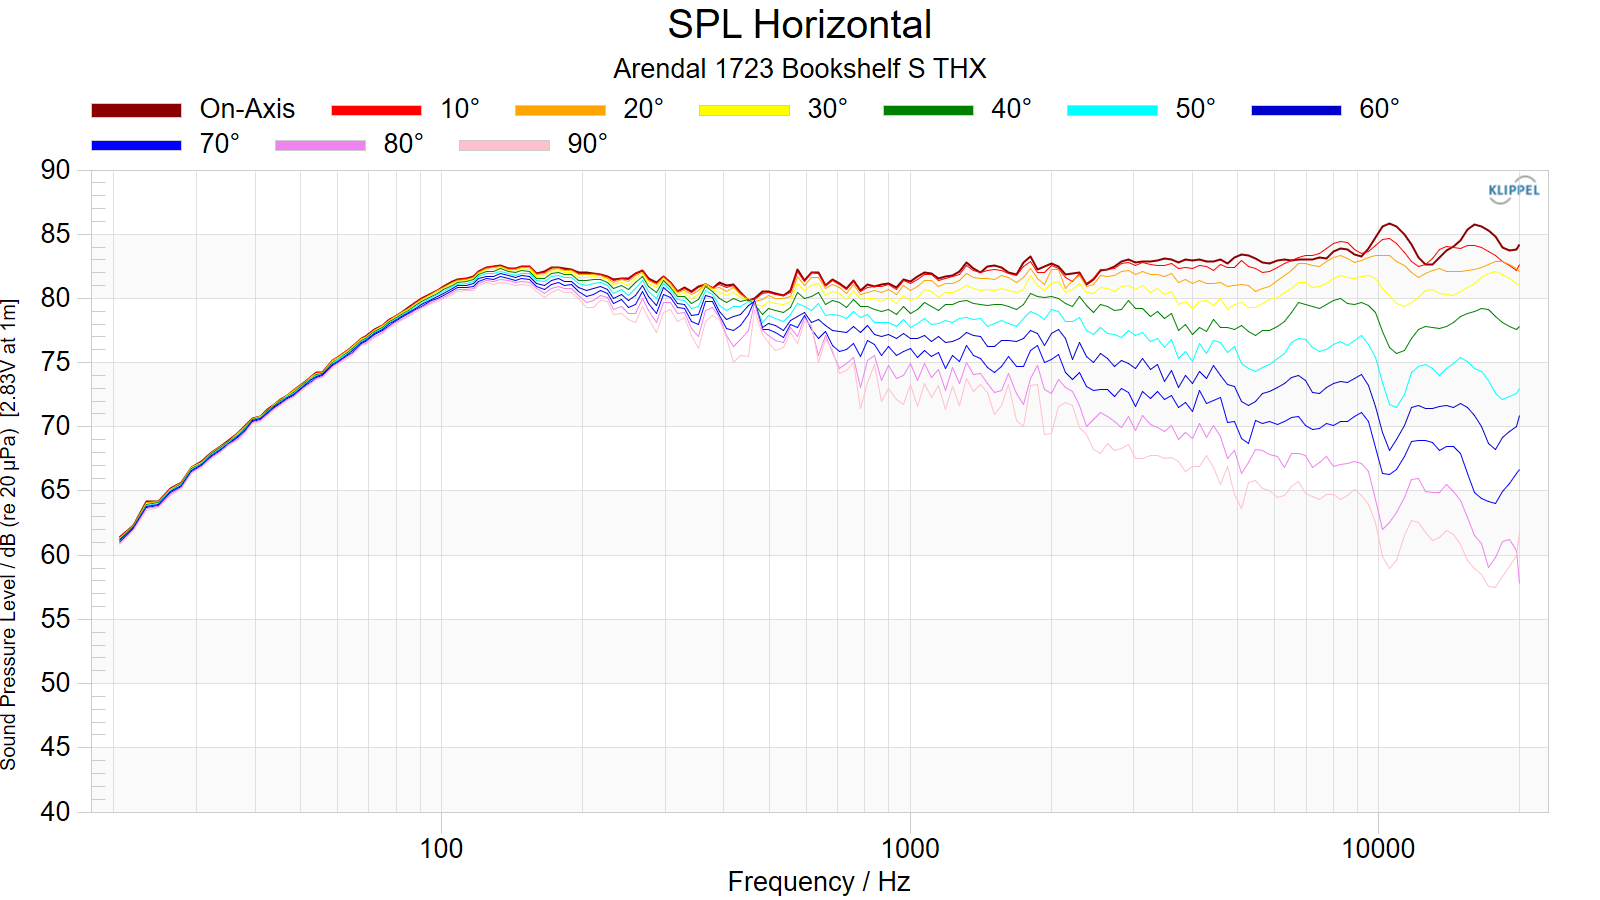
Horizontal Frequency Response (0° to ±90°):
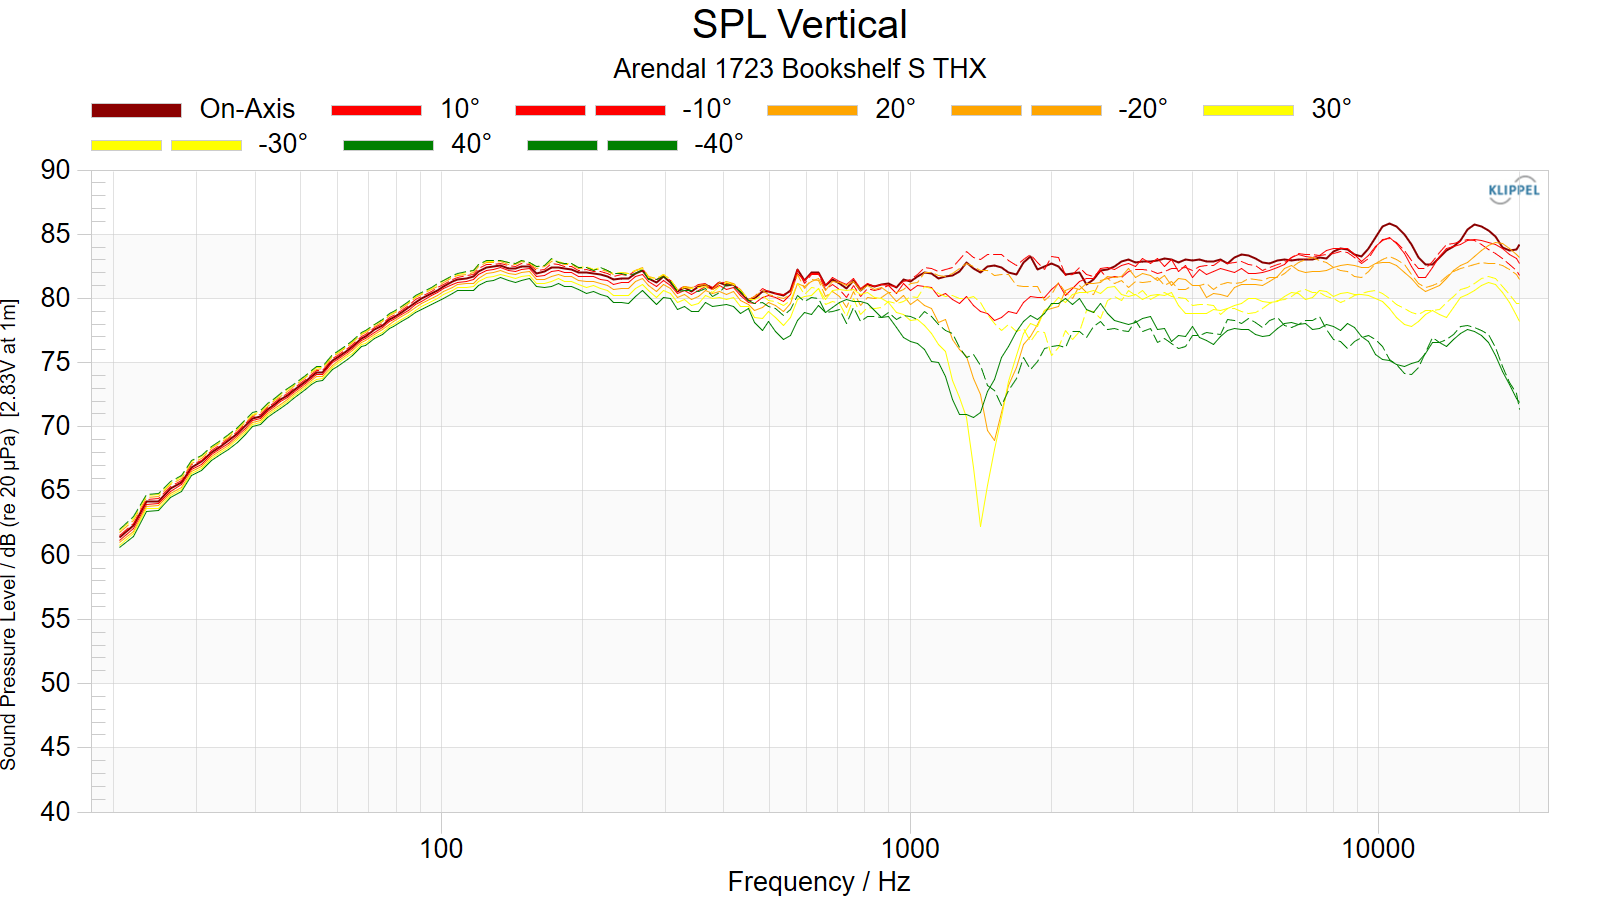
Vertical Frequency Response (0° to ±40°):
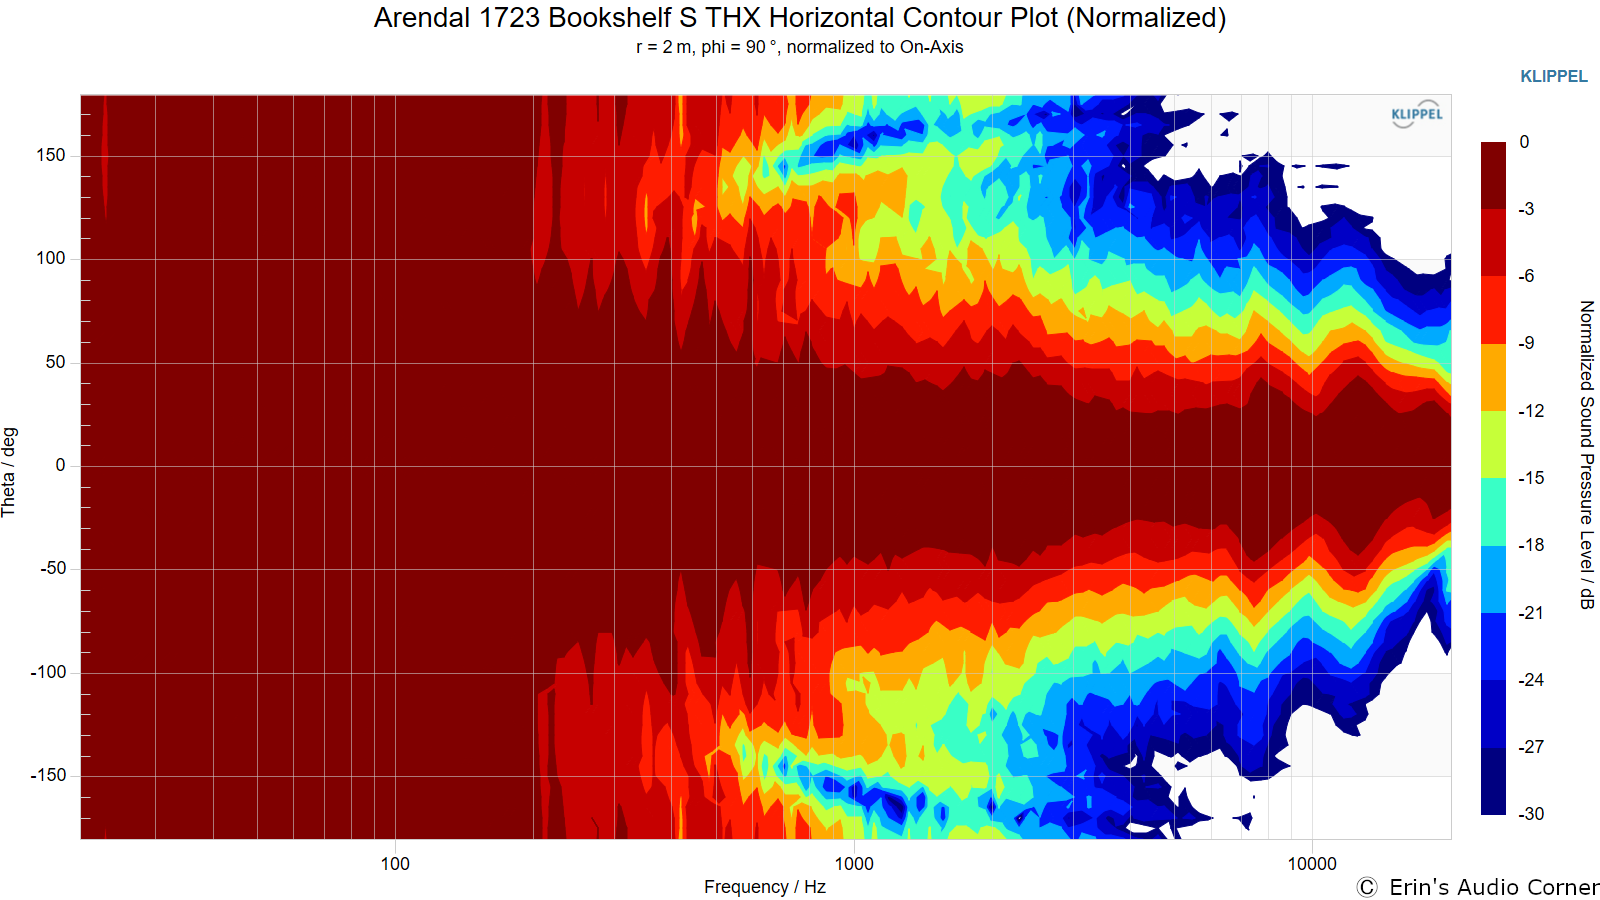
Horizontal Contour Plot (normalized):
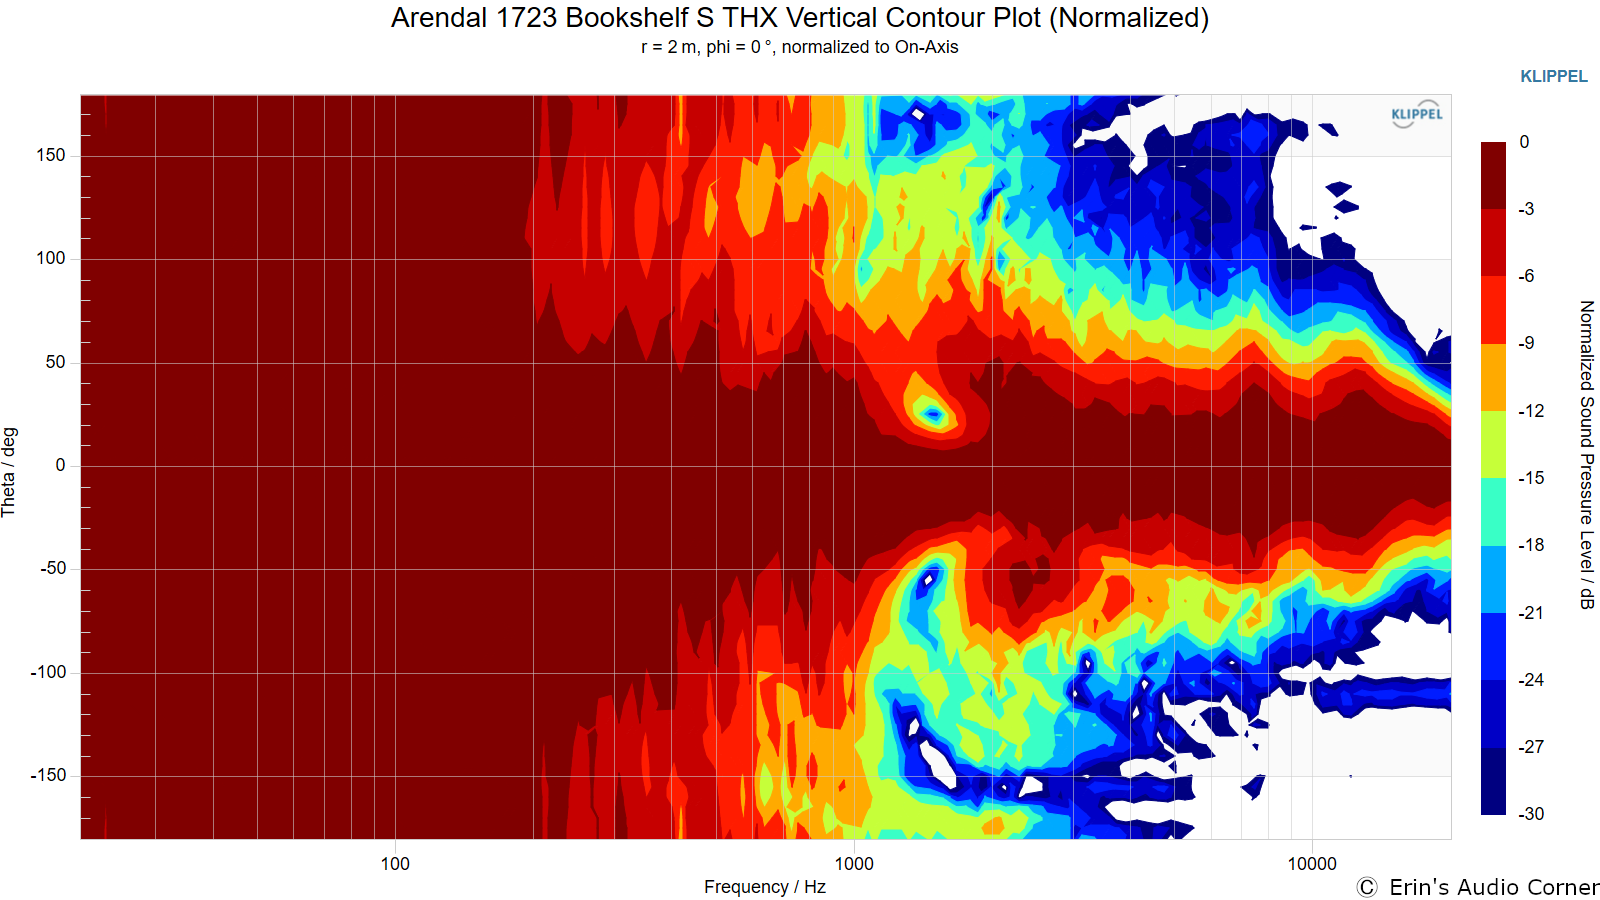
Vertical Contour Plot (normalized):
“Globe” Plots
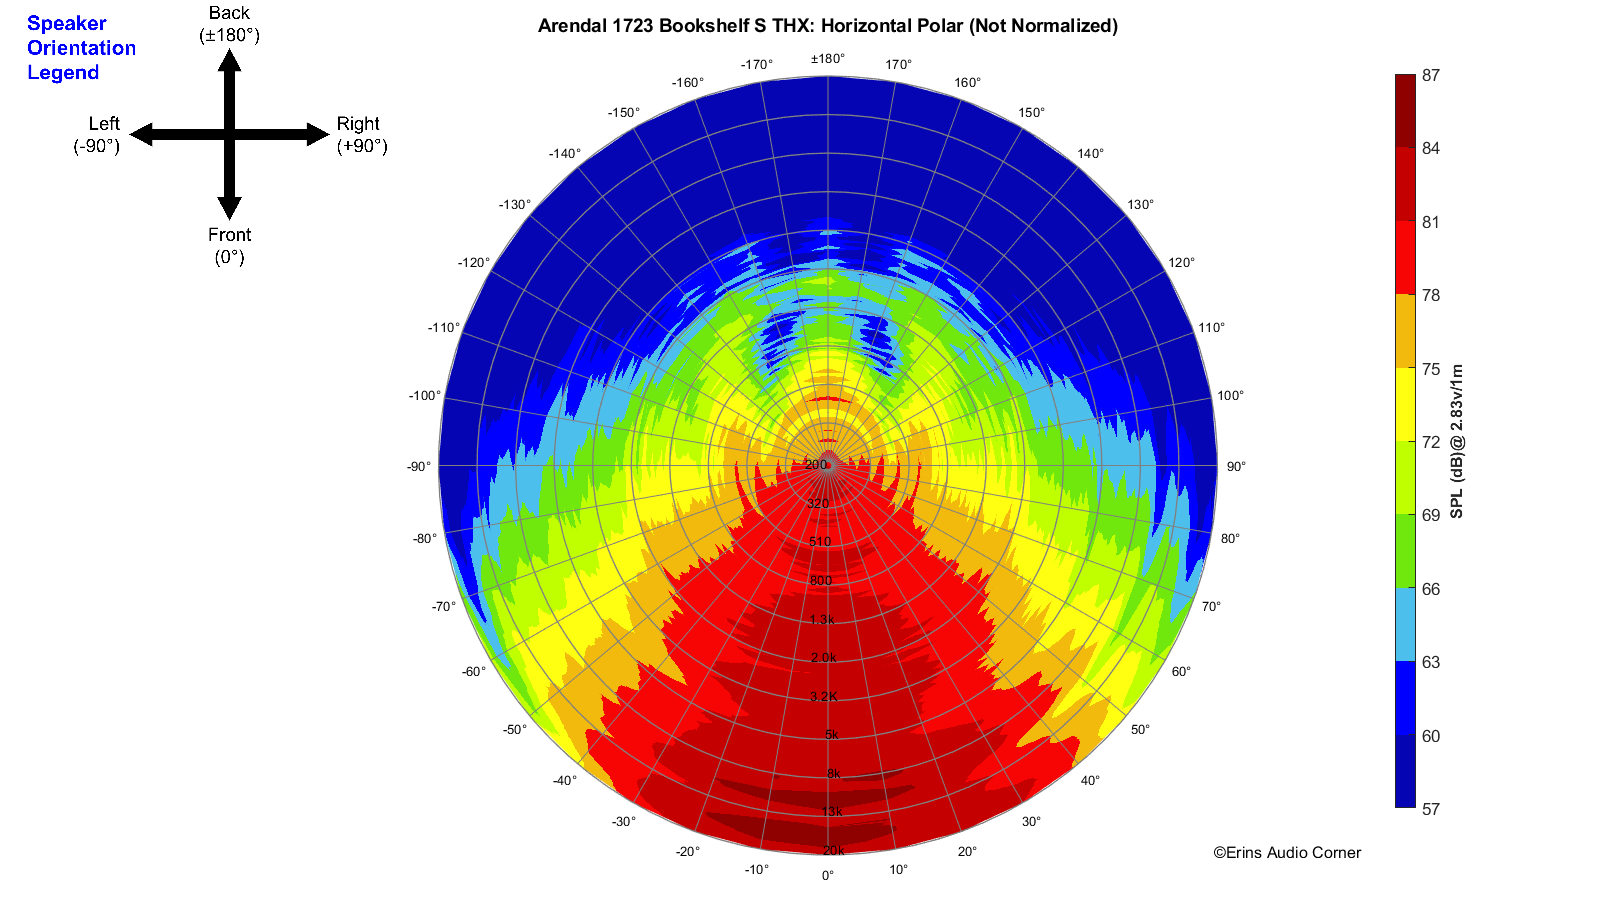
Horizontal Polar (Globe) Plot:
This represents the sound field at 2 meters - above 200Hz - per the legend in the upper left.
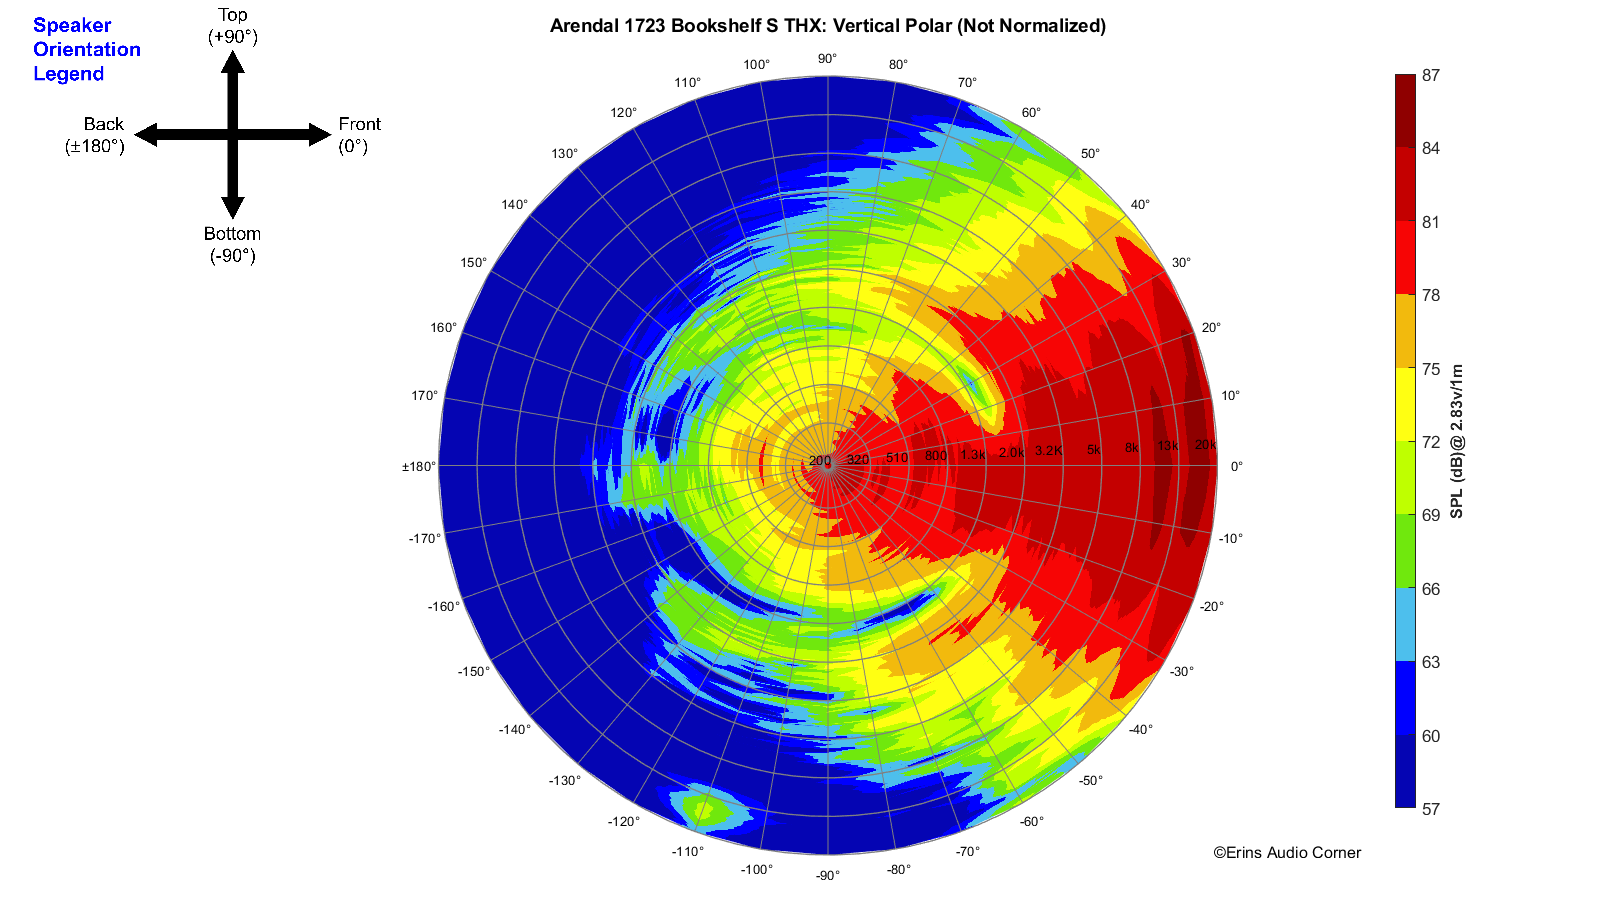
Vertical Polar (Globe) Plot:
This represents the sound field at 2 meters - above 200Hz - per the legend in the upper left.
Additional Measurements
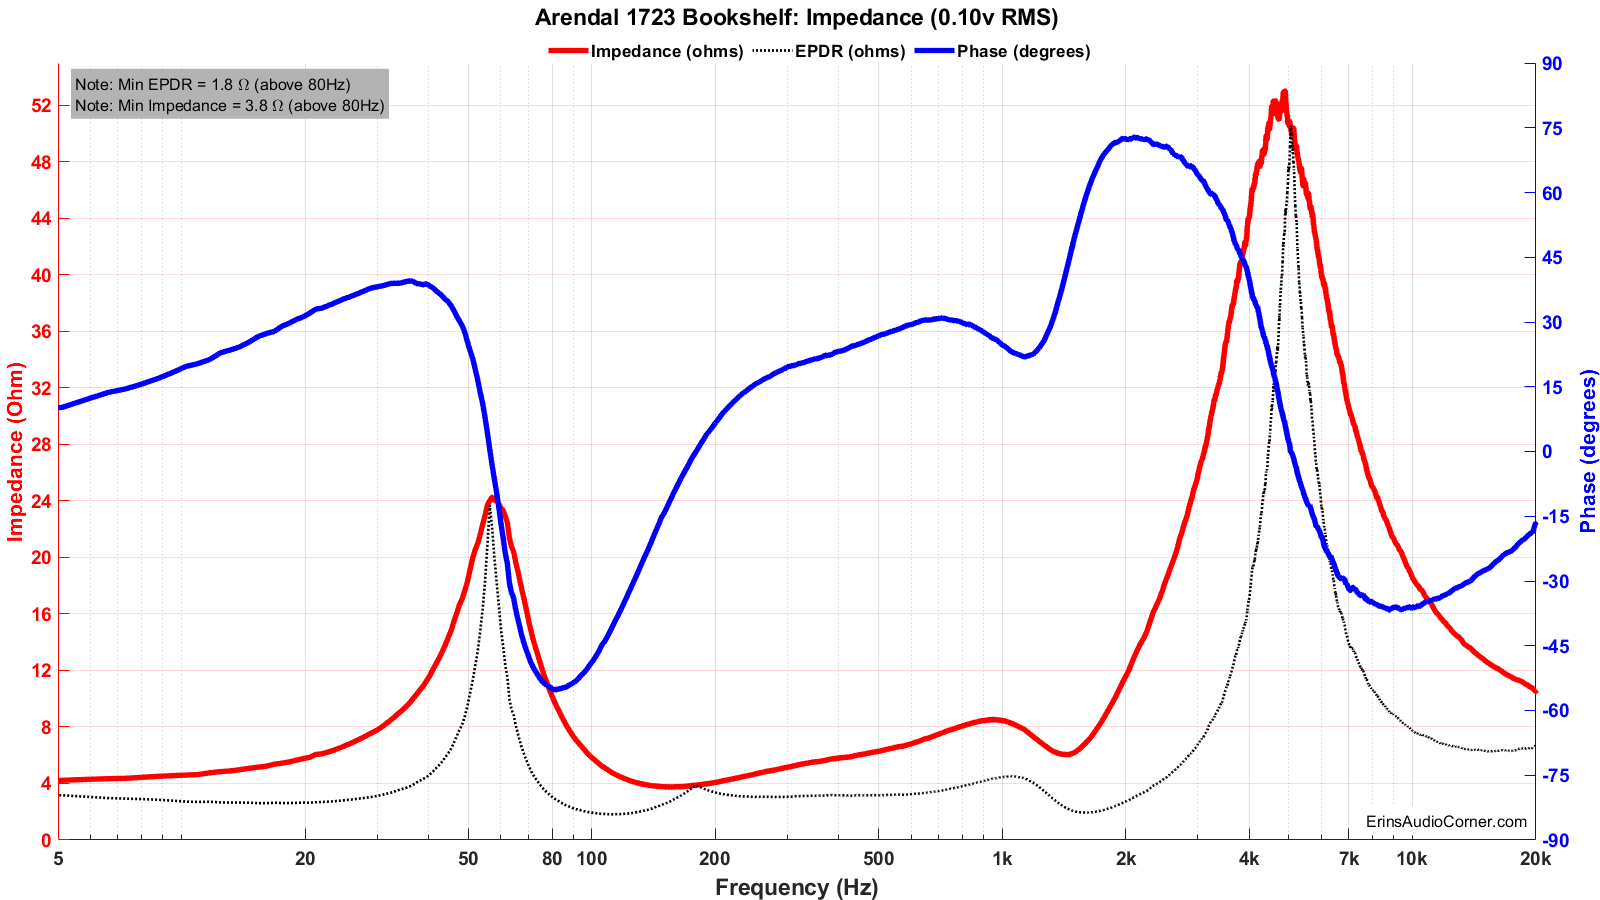
Impedance Magnitude and Phase
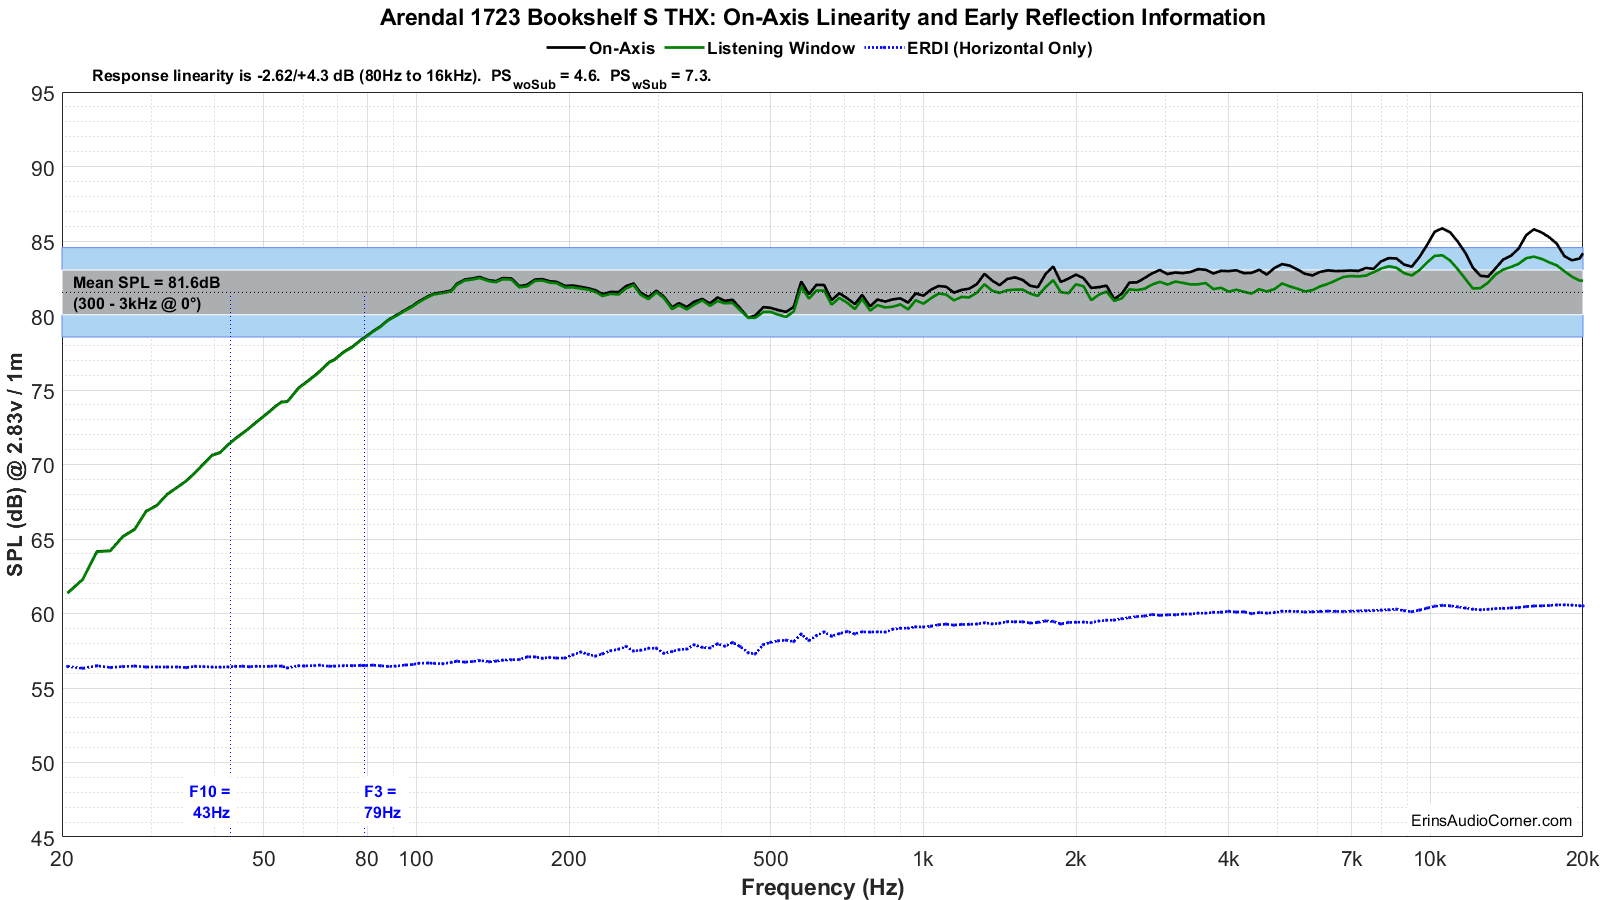
Response Linearity and Sensitivity
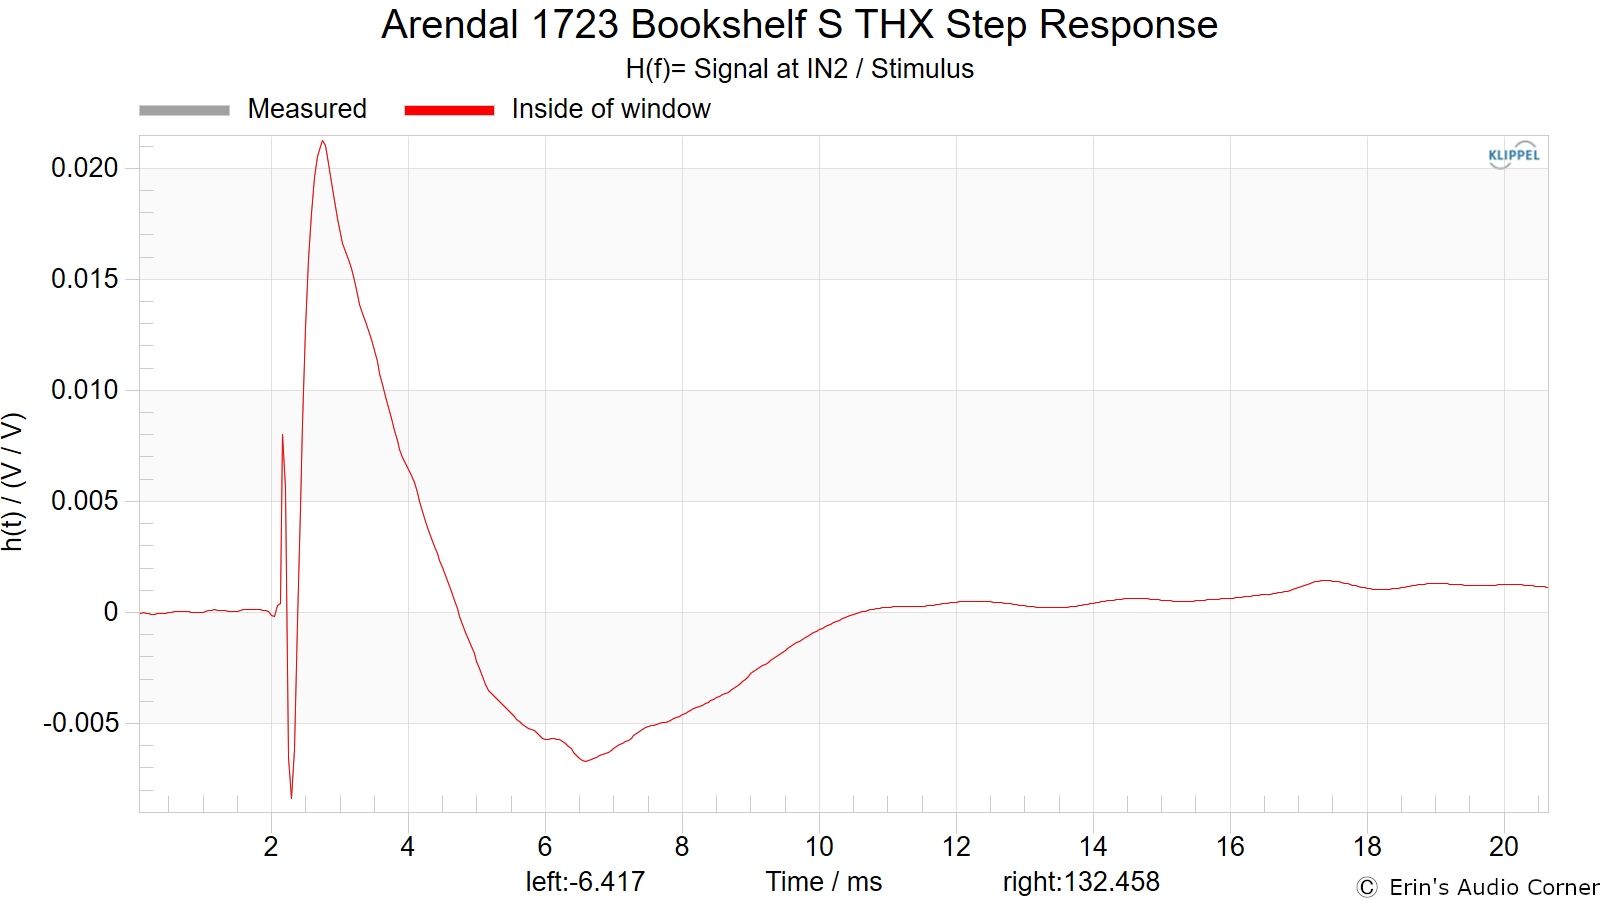
Step Response
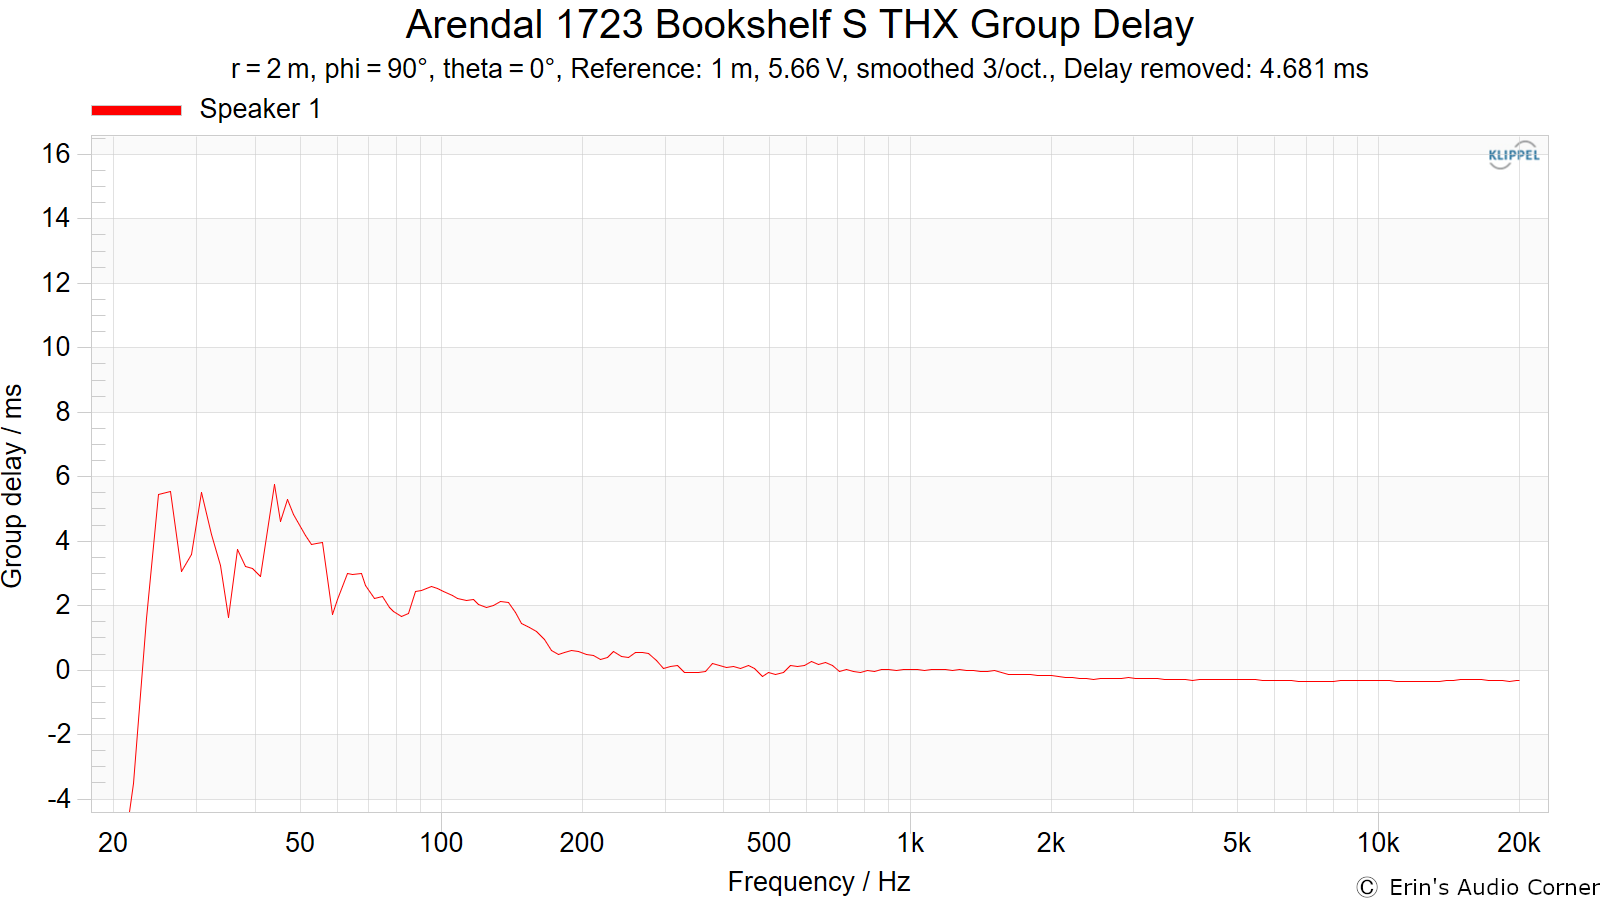
Group Delay
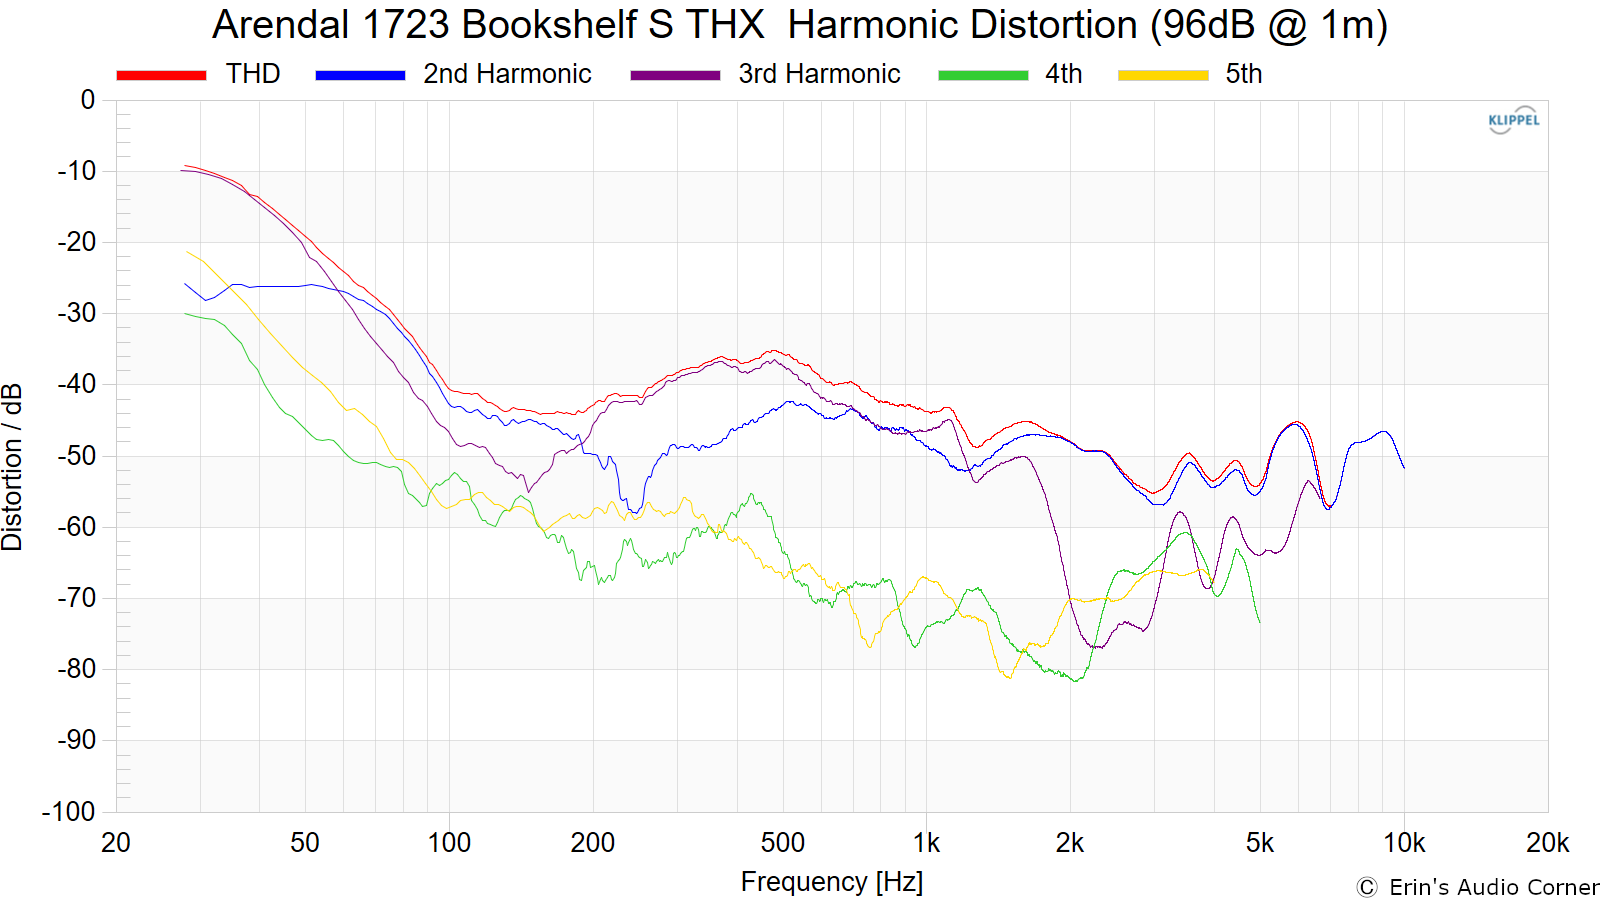
Harmonic Distortion
Harmonic Distortion at 86dB @ 1m:

Harmonic Distortion at 96dB @ 1m:
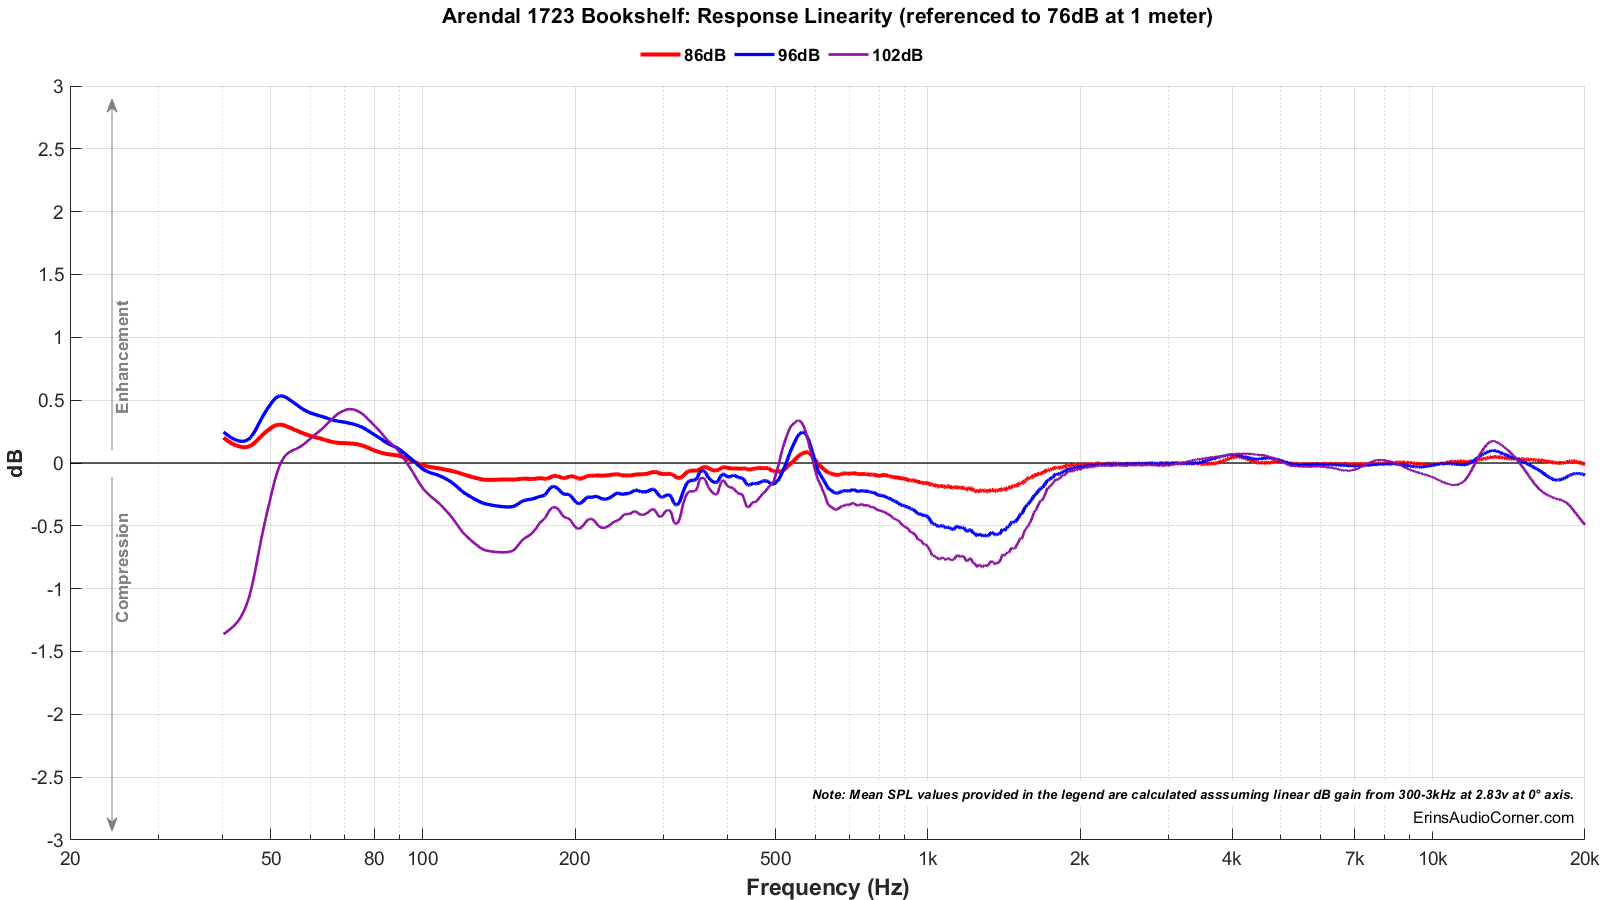
Dynamic Range (Instantaneous Compression Test)
The below graphic indicates just how much SPL is lost (compression) or gained (enhancement; usually due to distortion) when the speaker is played at higher output volumes instantly via a 2.7 second logarithmic sine sweep referenced to 76dB at 1 meter. The signals are played consecutively without any additional stimulus applied. Then normalized against the 76dB result.
The tests are conducted in this fashion:
- 76dB at 1 meter (baseline; black)
- 86dB at 1 meter (red)
- 96dB at 1 meter (blue)
- 102dB at 1 meter (purple)
The purpose of this test is to illustrate how much (if at all) the output changes as a speaker’s components temperature increases (i.e., voice coils, crossover components) instantaneously.
Parting / Random Thoughts
As stated in the Foreword, this written review is purposely a cliff’s notes version. For details about the performance (objectively and subjectively) please watch the YouTube video. But a few notes:
- Good midbass at 120Hz-160Hz but missing fundamental ~50-60Hz. Interestingly, when looking at the data I see a mild bump right between the 120-160Hz region which, honestly, amazes me that my listening lined up so well with this. Hey, maybe I’m not deaf after all!
- Mostly a neutral presentation which allows me to hear more details in my demo tracks (notably, bassline rhythm). However, the HF sounded bright. Since I had demoed these back-to-back with a few other speakers that also sounded the same, I thought maybe I was just letting my mind play tricks on me. When looking at the Estimated In-Room Response, however, it makes sense that I heard a boosted HF. You can see, too, in the horizontal SPL graphic there is a bump at approximately 8kHz that is followed by another about an octave up. I found the best way to listen to these speaekers (without EQ) was to turn them about 20° off-axis, facing out toward the room.
- Soundstage is rather narrow at about ±30° but when taking the above toe-out suggestion, the soundstage widens up a bit.
- Do not sit above the tweeter. You can possibly get away with sitting slightly below. Keep this in mind if you use these in a home theater application where there are multiple rows of listeners.
- Reasonably well-controlled directivity means good EQ’ability for tailoring the sound to taste or to adjust the HF if you need to face these directly on-axis to get less sidewall reflection and find the treble too bright as I did.
- Good output but will obviously need a subwoofer due to the F3=80Hz.
Support the Cause
If you find this review helpful and want to help support the cause there are a few ways you can do so below. Your support helps me pay for new items to test, hardware, miscellaneous items needed for testing and costs of the site’s server space and bandwidth. Any help is very much appreciated. Any little bit helps so thanks in advance for considering it.
Join my Patreon: Become a Patron!
Or using my generic affiliate links below to buy anything they sell that you want to try out. This will earn me a small commission at no additional cost to you. You can use these links anytime; now or in the future.
You can also join my Facebook and YouTube pages if you’d like to follow along with updates.