Foreword / YouTube Video Review
The review on this website is a brief overview and summary of the objective performance of this speaker. It is not intended to be a deep dive. Moreso, this is information for those who prefer “just the facts” and prefer to have the data without the filler. Discussion about the data and my subjective thoughts can be found in my video below.
For a primer on what the data means, please watch my series of videos where I provide in-depth discussion and examples of how to read the graphics presented hereon.
Information and Photos
Note: These speakers were loaned to me by Danley Sound Labs. They were in used condition but received the typical look over before being placed back in stock in the warehouse where they came from (which I saw with my own eyes, being lifted off a rack via forklift and loaded into my car with the help of a Danley employee).
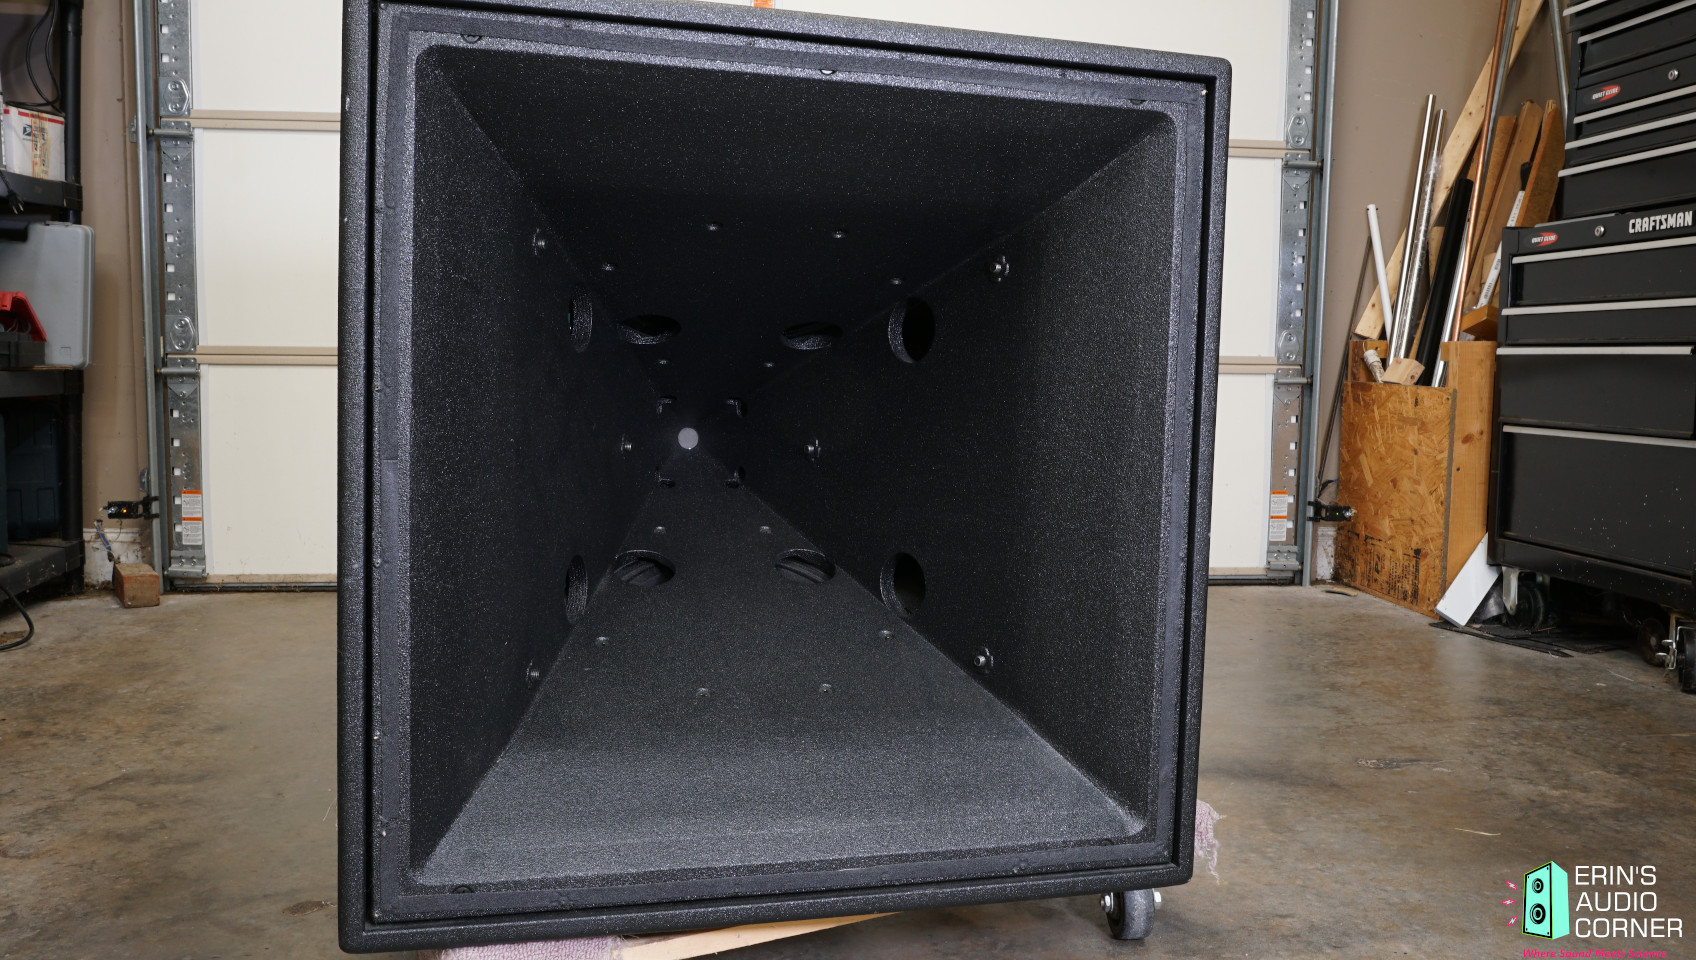
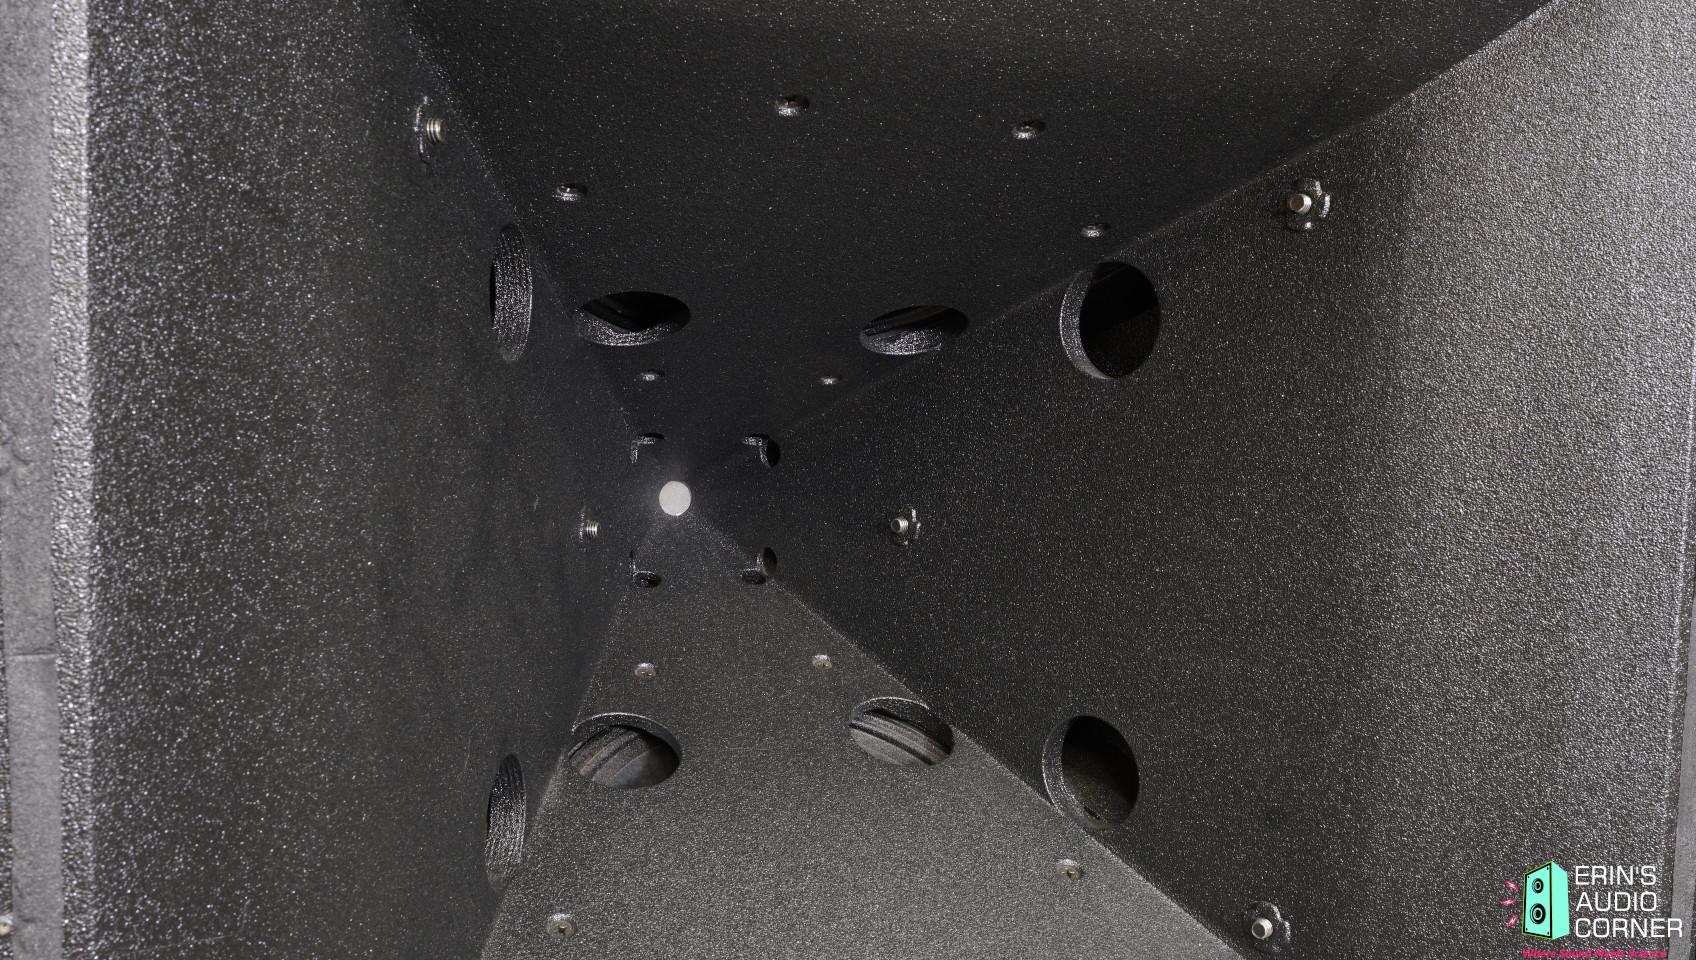
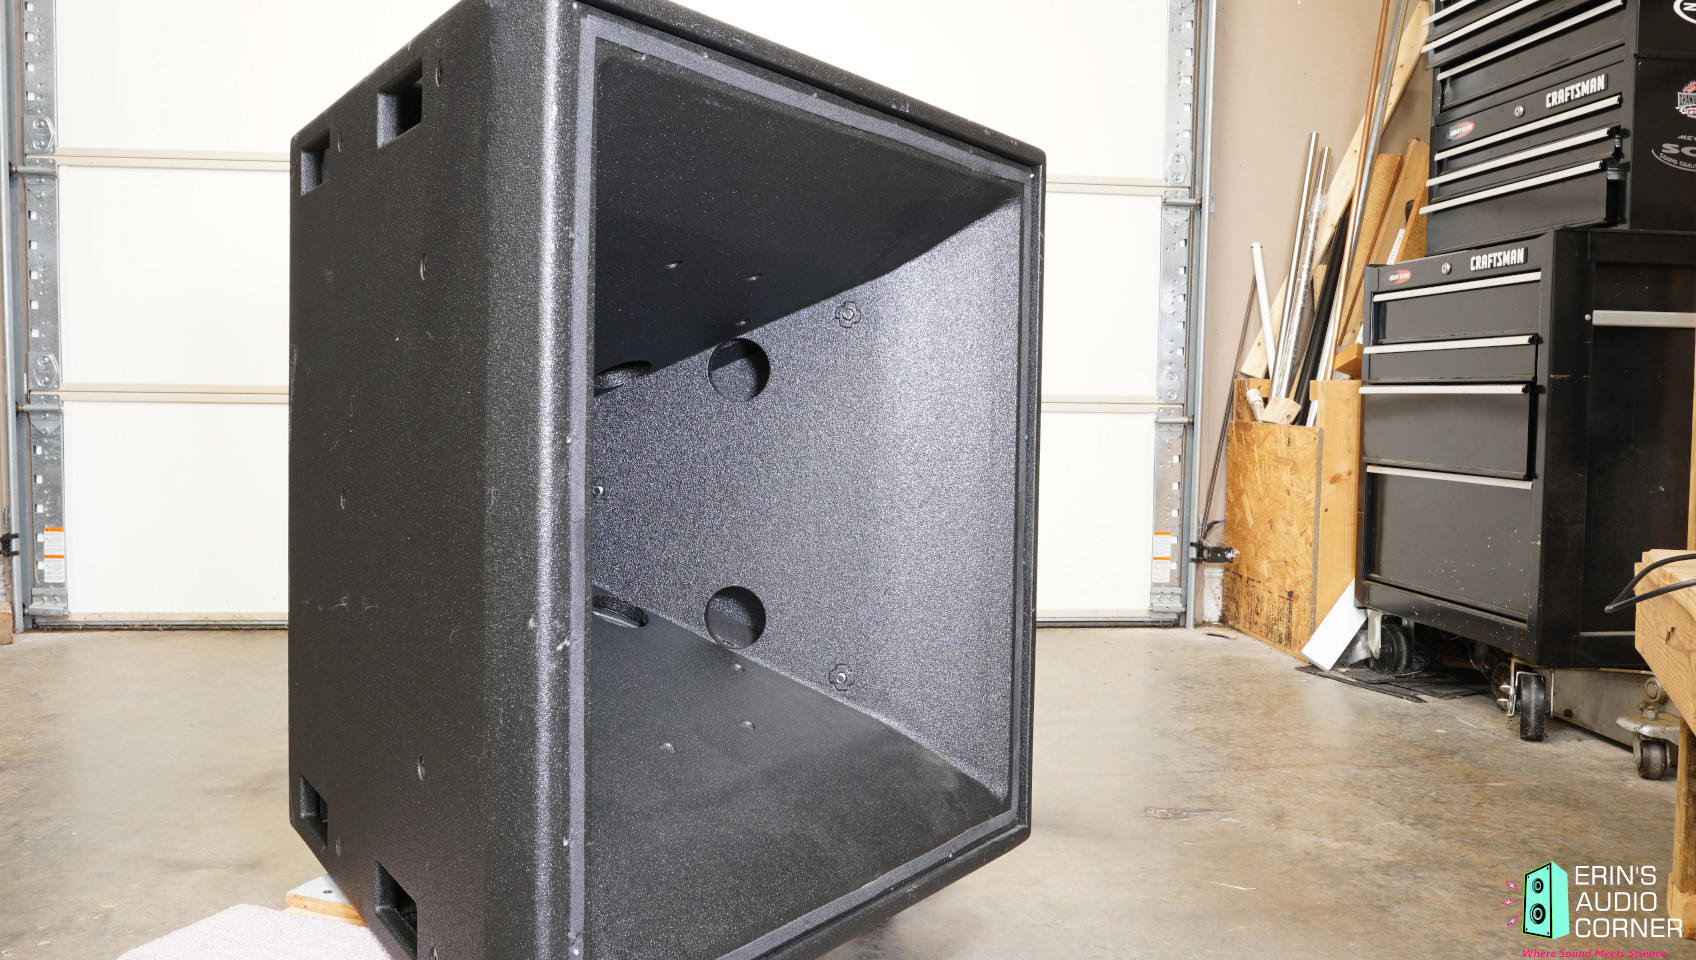
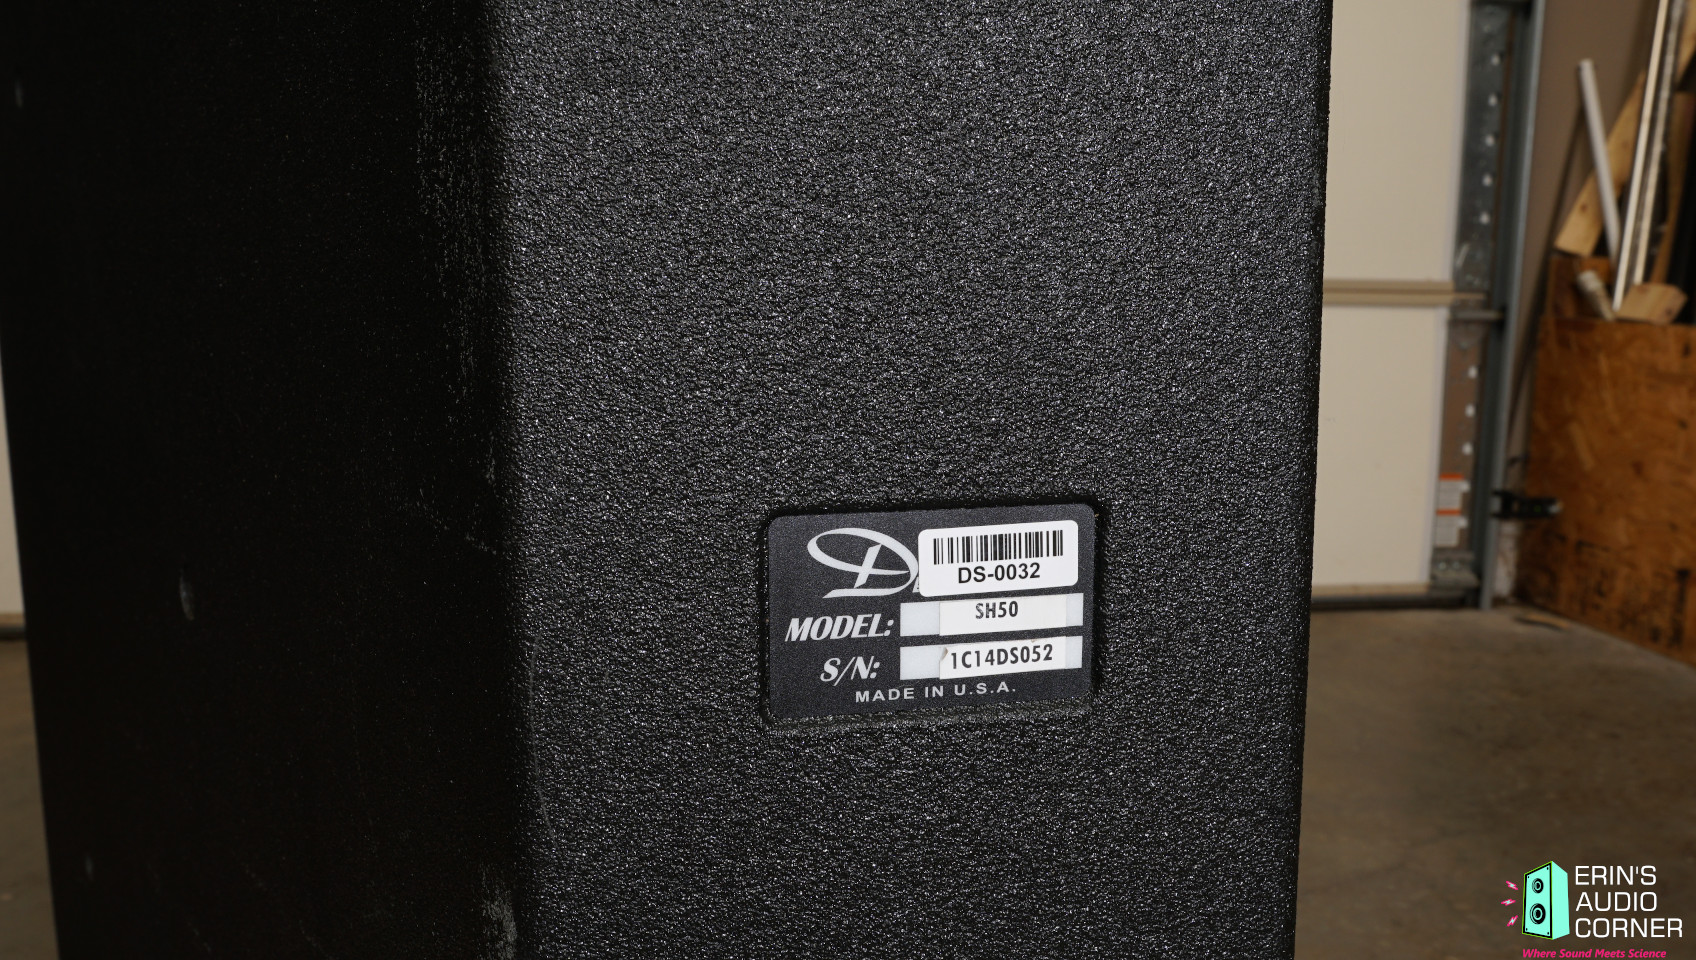
The Danley Sound Labs SH-50 is the flagship speaker from Danley’s Synergy Horn line. It is a monstrous pro-audio speaker intended for use in large venues (church halls, stadiums, etc.). The SH-50 features the following drive units: (2) 12-inch midwoofers, (4) 5-inch midranges and (1) High Frequency compression driver. It is built to withstand the elements, provide massive output with a power rating of 1000w continuous and has high sensitivity. The SH-50 can be used as a single unit or arrayed in multiples, daisy-chained via the speakON connectors located on the back. They weigh a whopping 130 pounds each. I had to enlist the help of my nephew to help me lift it on the Klippel stand.
Sure, these likely aren’t going to be the first idea for home audio listening. But, hey, it’s always fun to see what designs are out there and how different speakers perform. So while I was visiting Danley’s HQ in Georgia last month to listen to their new Hyperion home speakers, I got to talking about some of Danley’s various designs and was given the opportunity to take this SH-50 home with me (on loan) from Danley Sound Labs to test out and play around with. I’m there, dude!
Here is a quote from the designer:
The SH50 provides great fidelity, low frequency pattern control and unrivaled magnitude/phase response in the coverage angle The SH50 has the added benefit of truly modular array-ability, and delivers high SPL and low distortion sound reproduction. The SH50 standard model is available in powered or Cobramote models for easy installation, as well as passive versions, and the touring model features handles for simple portability.
CTA-2034 (SPINORAMA) and Accompanying Data
All data collected using Klippel’s Near-Field Scanner. The Near-Field-Scanner 3D (NFS) offers a fully automated acoustic measurement of direct sound radiated from the source under test. The radiated sound is determined in any desired distance and angle in the 3D space outside the scanning surface. Directivity, sound power, SPL response and many more key figures are obtained for any kind of loudspeaker and audio system in near field applications (e.g. studio monitors, mobile devices) as well as far field applications (e.g. professional audio systems). Utilizing a minimum of measurement points, a comprehensive data set is generated containing the loudspeaker’s high resolution, free field sound radiation in the near and far field. For a detailed explanation of how the NFS works and the science behind it, please watch the below discussion with designer Christian Bellmann:
The reference plane in this test is directly in front of the tweeter. I also tested with the reference set at the “baffle”. I took the speaker outdoors to perform a ground plane test (at 2 and 4 meters) to verify where the acoustic center really was and it turns out that it is - indeed - at the tweeter. Therefore, the results you see here are with this as the reference point. I also determined that the nearfield-to-farfield transition for this speaker occurs at approximately 1.50 meters. Meaning that at distance closer than 1.50 meters the speakers do not all sum as a coherent wavefront; you must be at least 1.50 meters distance away for this to occur.
Measurements are provided in a format in accordance with the Standard Method of Measurement for In-Home Loudspeakers (ANSI/CTA-2034-A R-2020). For more information, please see this link.
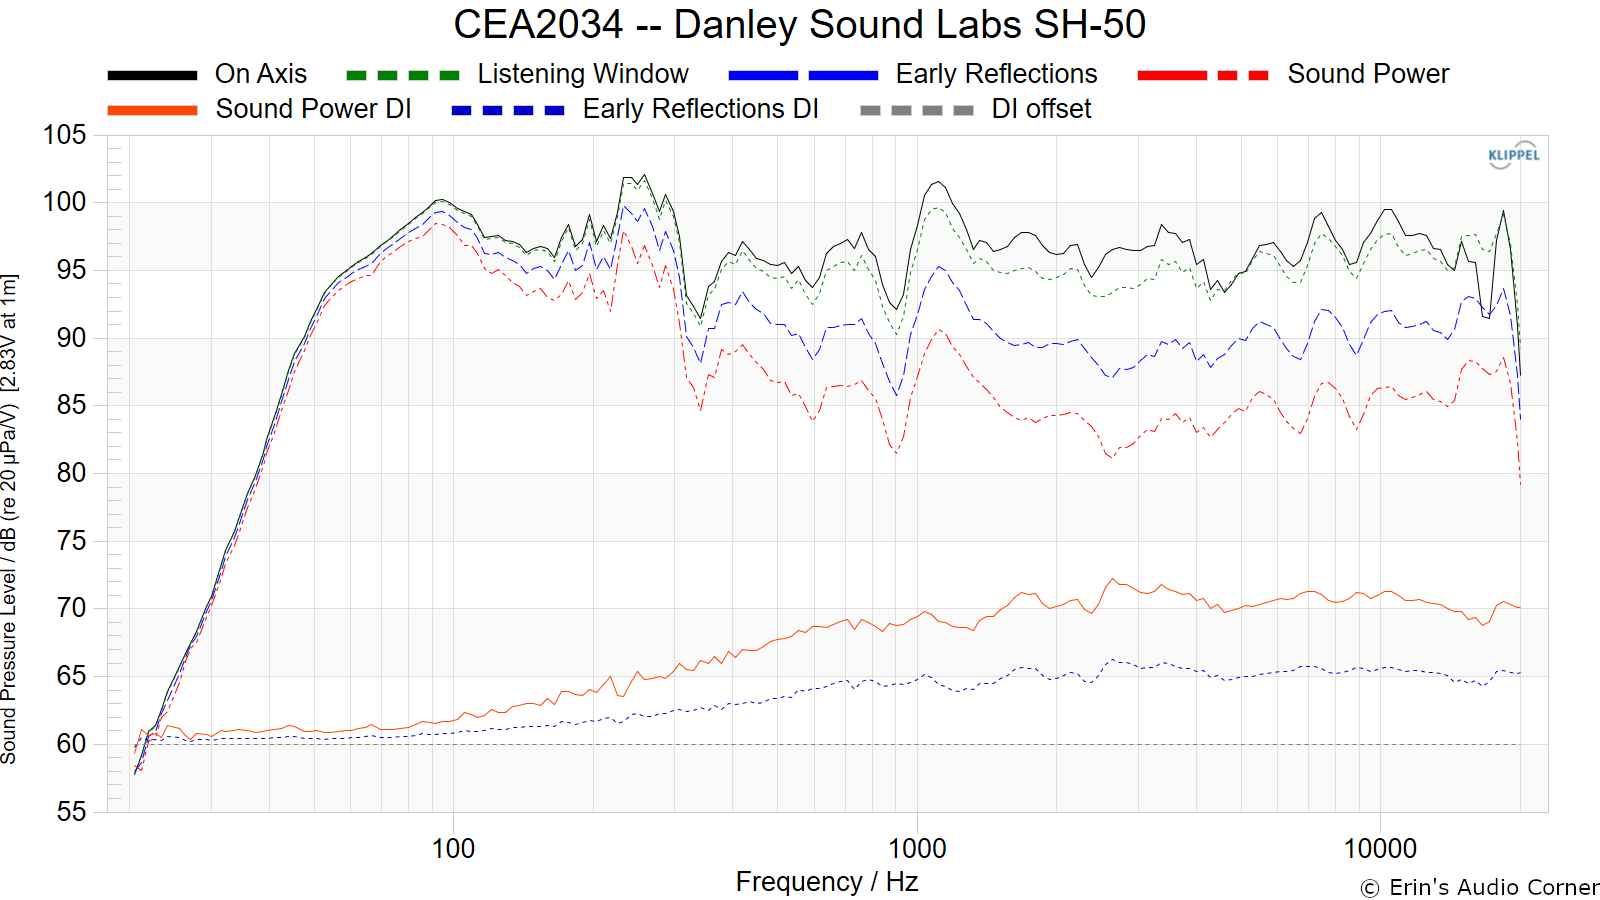
CTA-2034 / SPINORAMA:
The On-axis Frequency Response (0°) is the universal starting point and in many situations, it is a fair representation of the first sound to arrive at a listener’s ears.
The Listening Window is a spatial average of the nine amplitude responses in the ±10º vertical and ±30º horizontal angular range. This encompasses those listeners who sit within a typical home theater audience, as well as those who disregard the normal rules when listening alone.
The Early Reflections curve is an estimate of all single-bounce, first-reflections, in a typical listening room.
Sound Power represents all the sounds arriving at the listening position after any number of reflections from any direction. It is the weighted rms average of all 70 measurements, with individual measurements weighted according to the portion of the spherical surface that they represent.
Sound Power Directivity Index (SPDI): In this standard the SPDI is defined as the difference between the listening window curve and the sound power curve.
Early Reflections Directivity Index (EPDI): is defined as the difference between the listening window curve and the early reflections curve. In small rooms, early reflections figure prominently in what is measured and heard in the room so this curve may provide insights into potential sound quality.
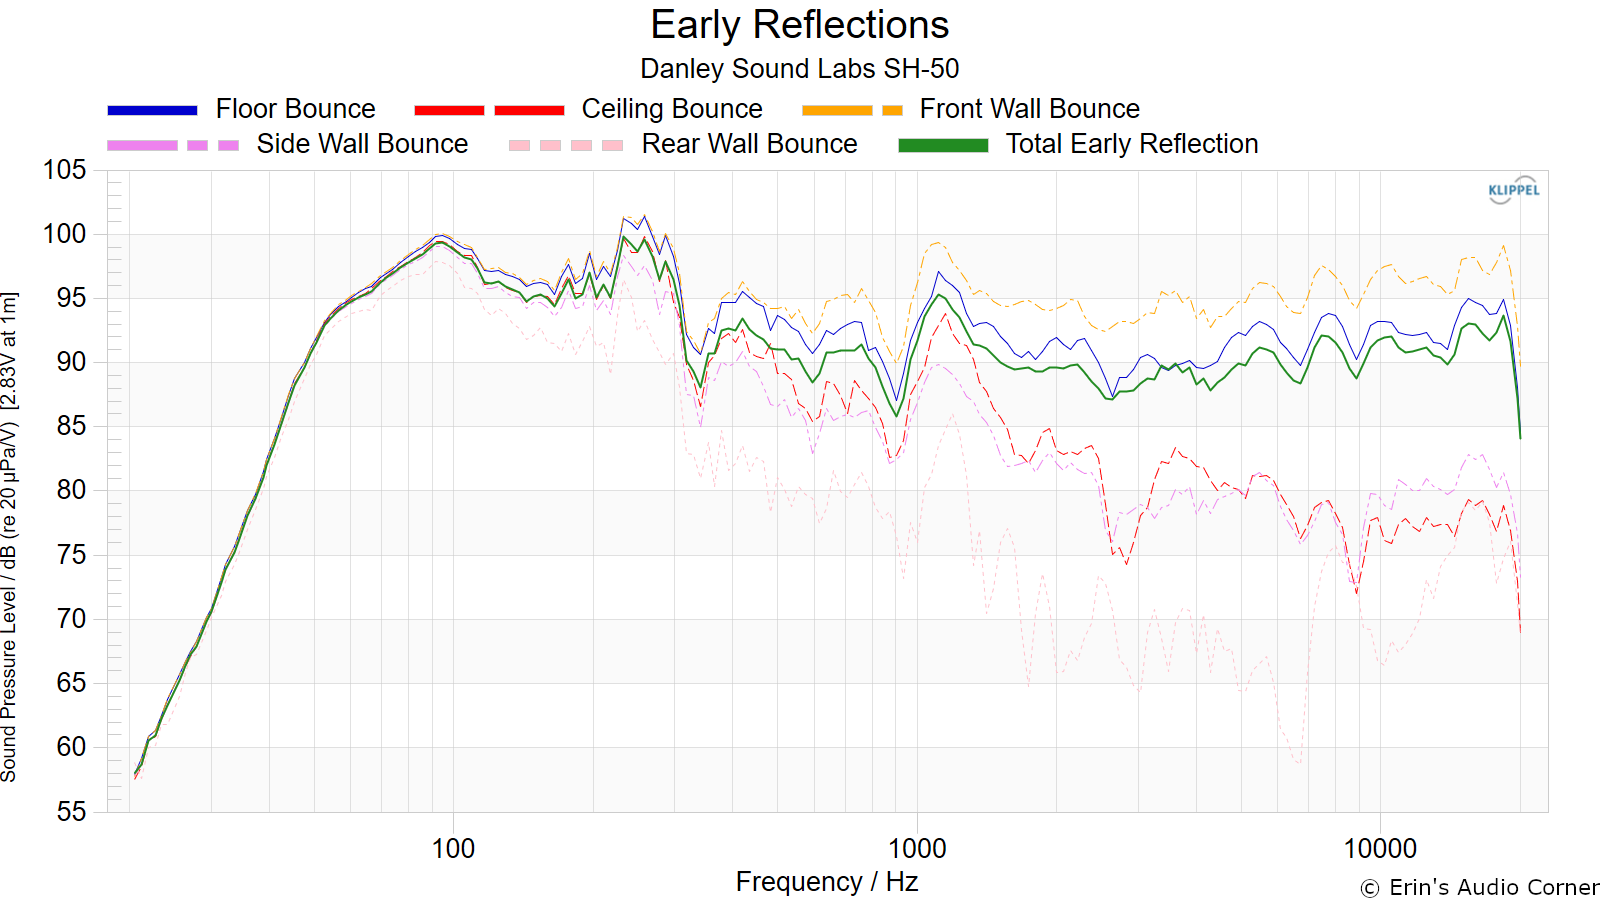
Early Reflections Breakout:
Floor bounce: average of 20º, 30º, 40º down
Ceiling bounce: average of 40º, 50º, 60º up
Front wall bounce: average of 0º, ± 10º, ± 20º, ± 30º horizontal
Side wall bounces: average of ± 40º, ± 50º, ± 60º, ± 70º, ± 80º horizontal
Rear wall bounces: average of 180º, ± 90º horizontal
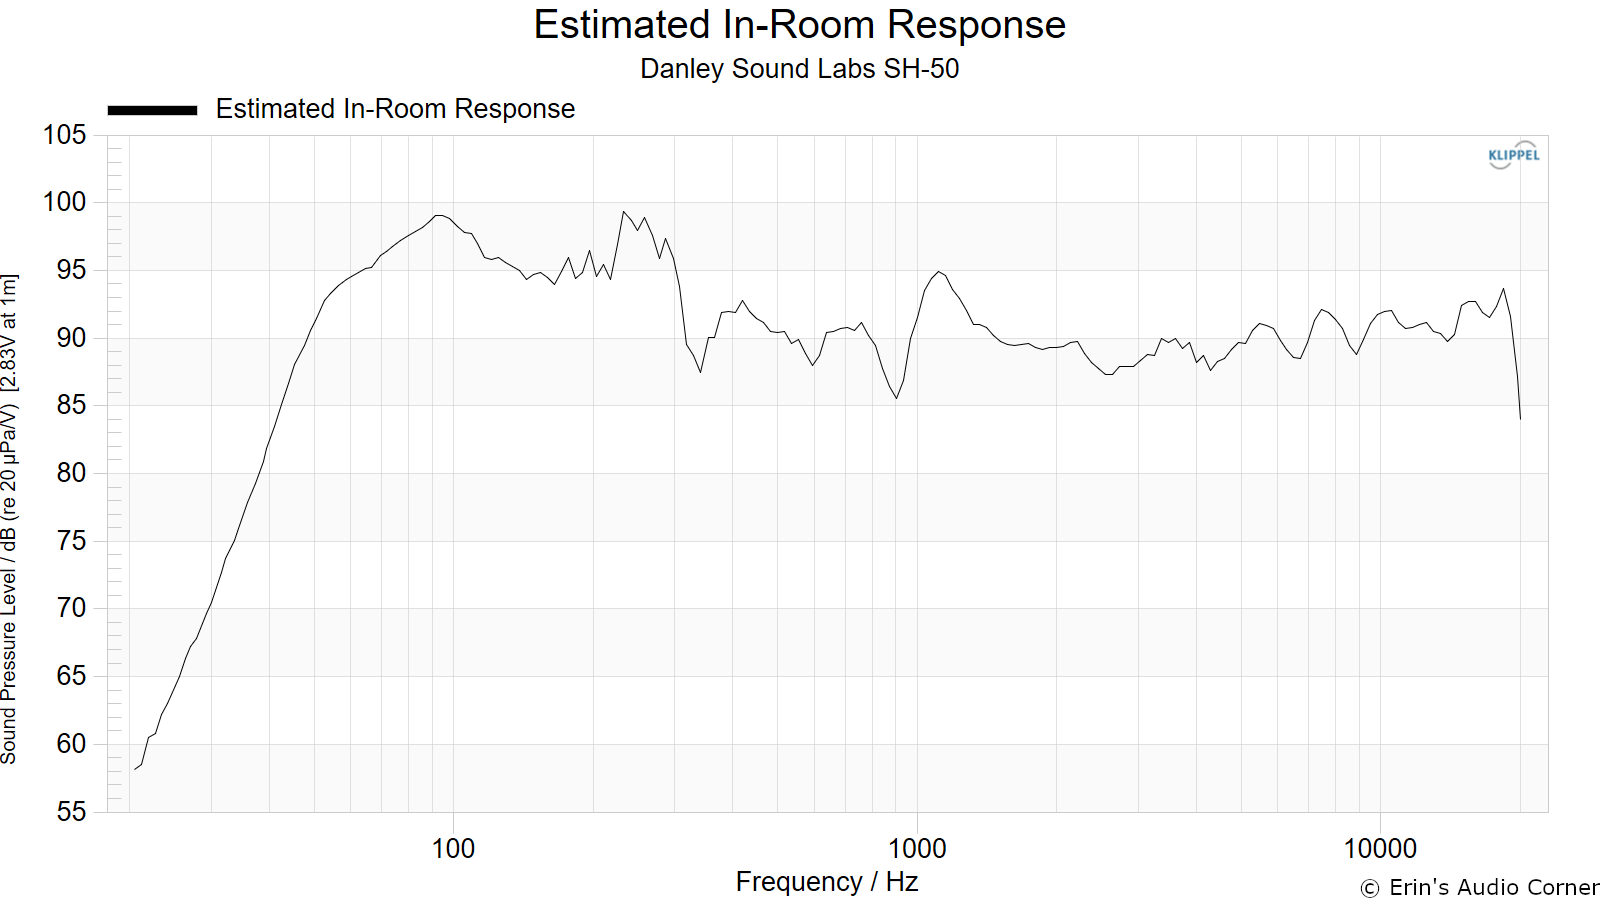
Estimated In-Room Response:
In theory, with complete 360-degree anechoic data on a loudspeaker and sufficient acoustical and geometrical data on the listening room and its layout it would be possible to estimate with good precision what would be measured by an omnidirectional microphone located in the listening area of that room. By making some simplifying assumptions about the listening space, the data set described above permits a usefully accurate preview of how a given loudspeaker might perform in a typical domestic listening room. Obviously, there are no guarantees because individual rooms can be acoustically aberrant. Sometimes rooms are excessively reflective (“live”) as happens in certain hot, humid climates, with certain styles of interior décor and in under-furnished rooms. Sometimes rooms are excessively “dead” as in other styles of décor and in some custom home theaters where acoustical treatment has been used excessively. This form of post processing is offered only as an estimate of what might happen in a domestic living space with carpet on the floor and a “normal” amount of seating, drapes, and cabinetry.
For these limited circumstances it has been found that a usefully accurate Predicted In-Room (PIR) amplitude response, also known as a “room curve” is obtained by a weighted average consisting of 12 % listening window, 44 % early reflections and 44 % sound power. At very high frequencies errors can creep in because of excessive absorption, microphone directivity, and room geometry. These discrepancies are not considered to be of great importance.
Horizontal Frequency Response (0° to ±90°):

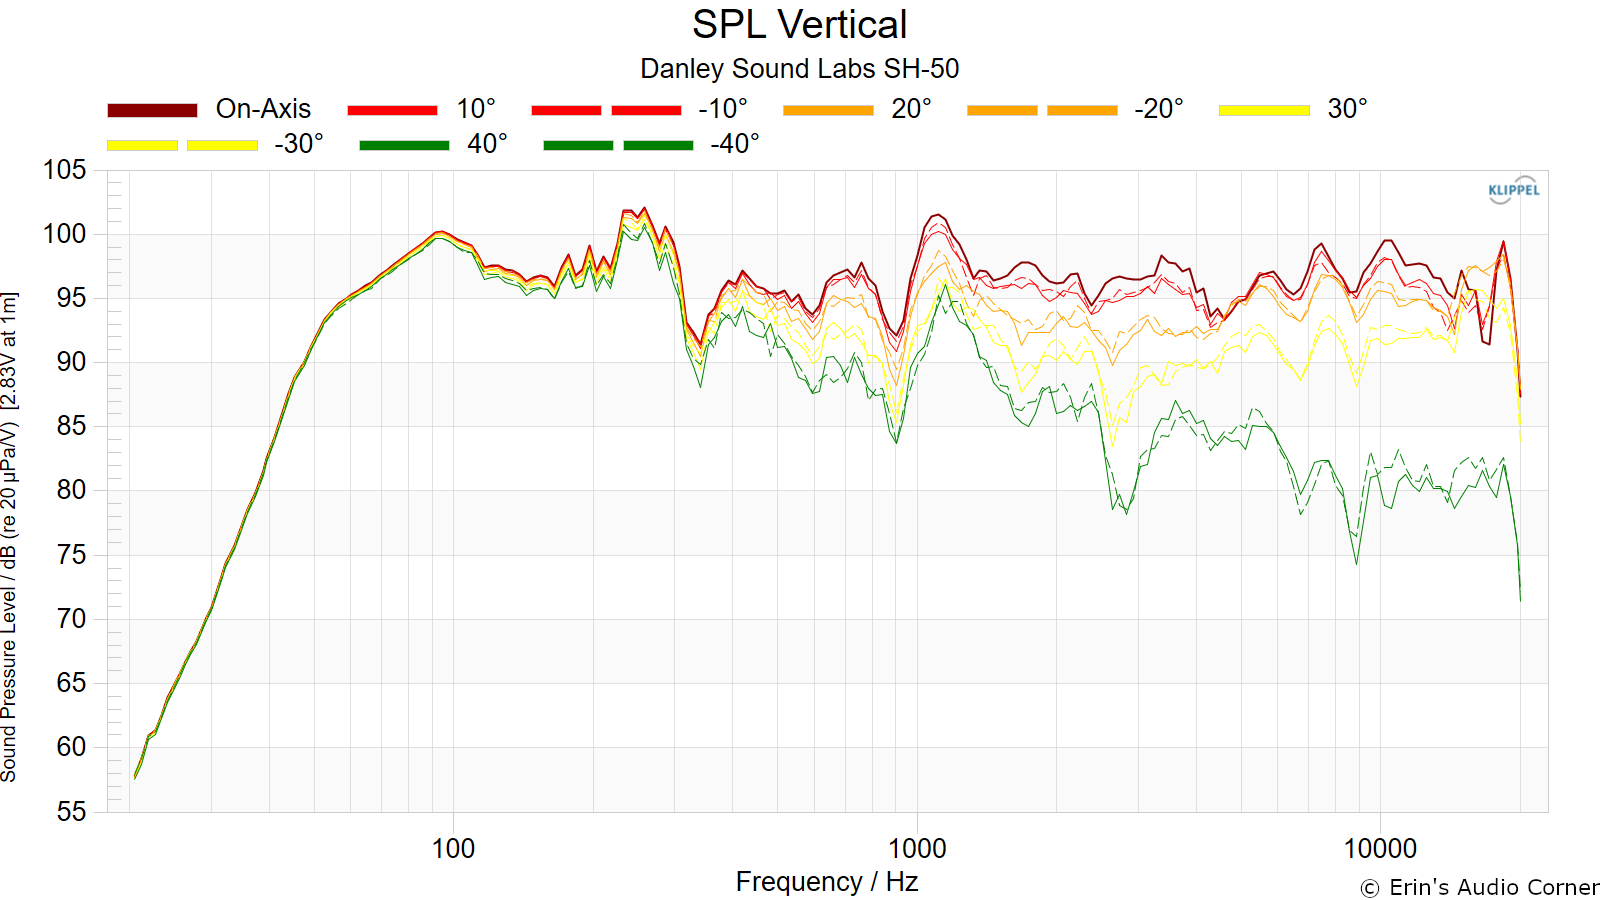
Vertical Frequency Response (0° to ±40°):
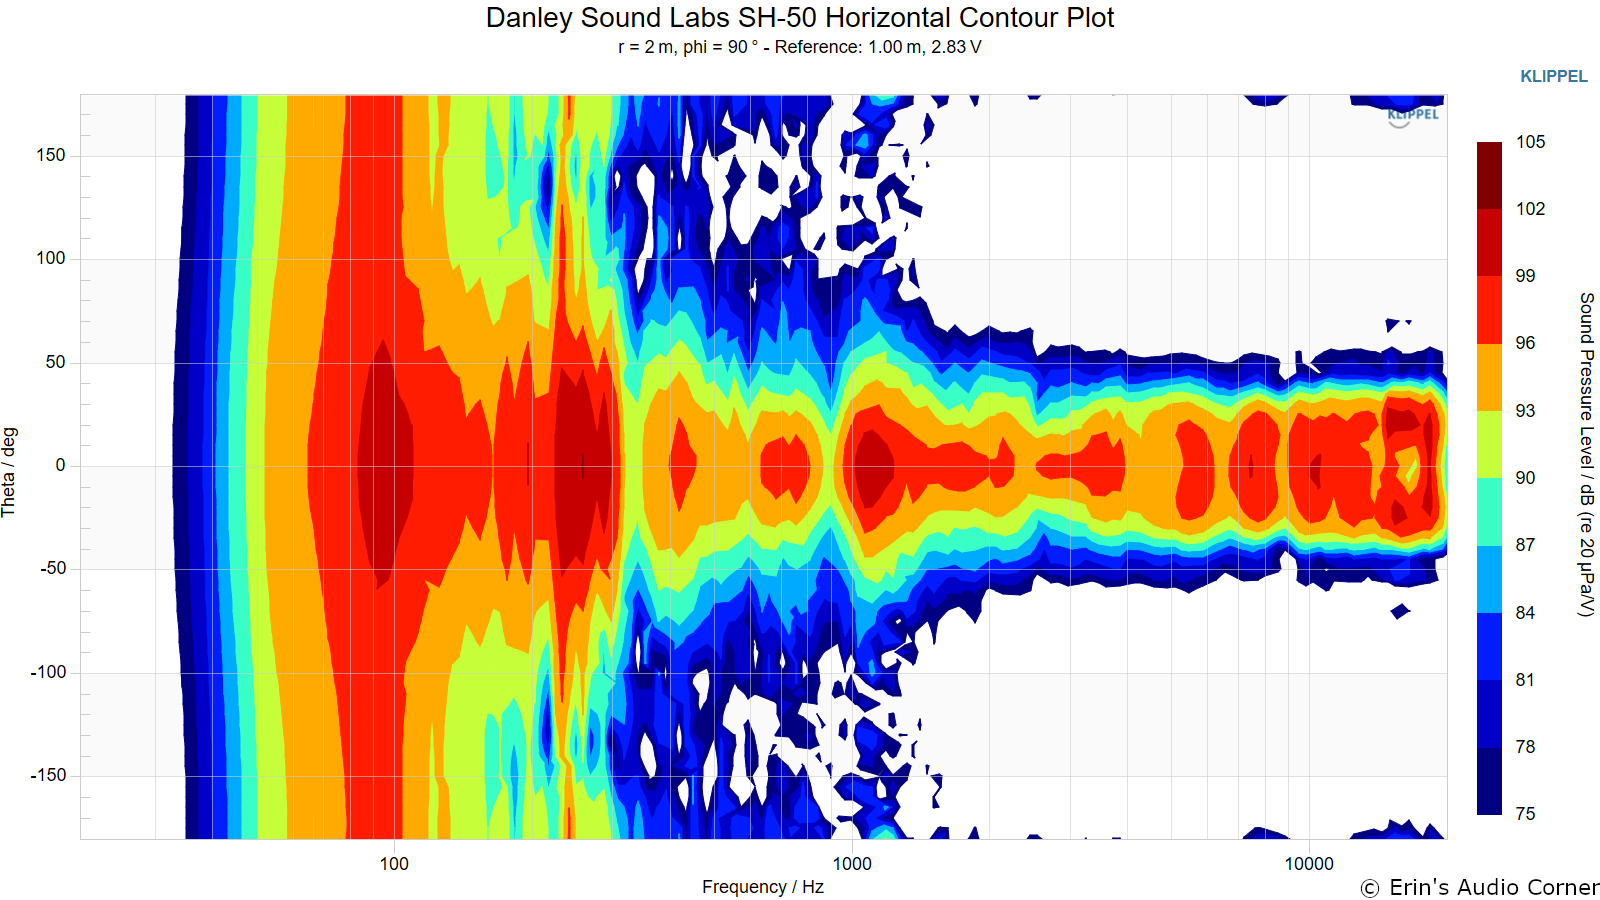
Horizontal Contour Plot (not normalized):
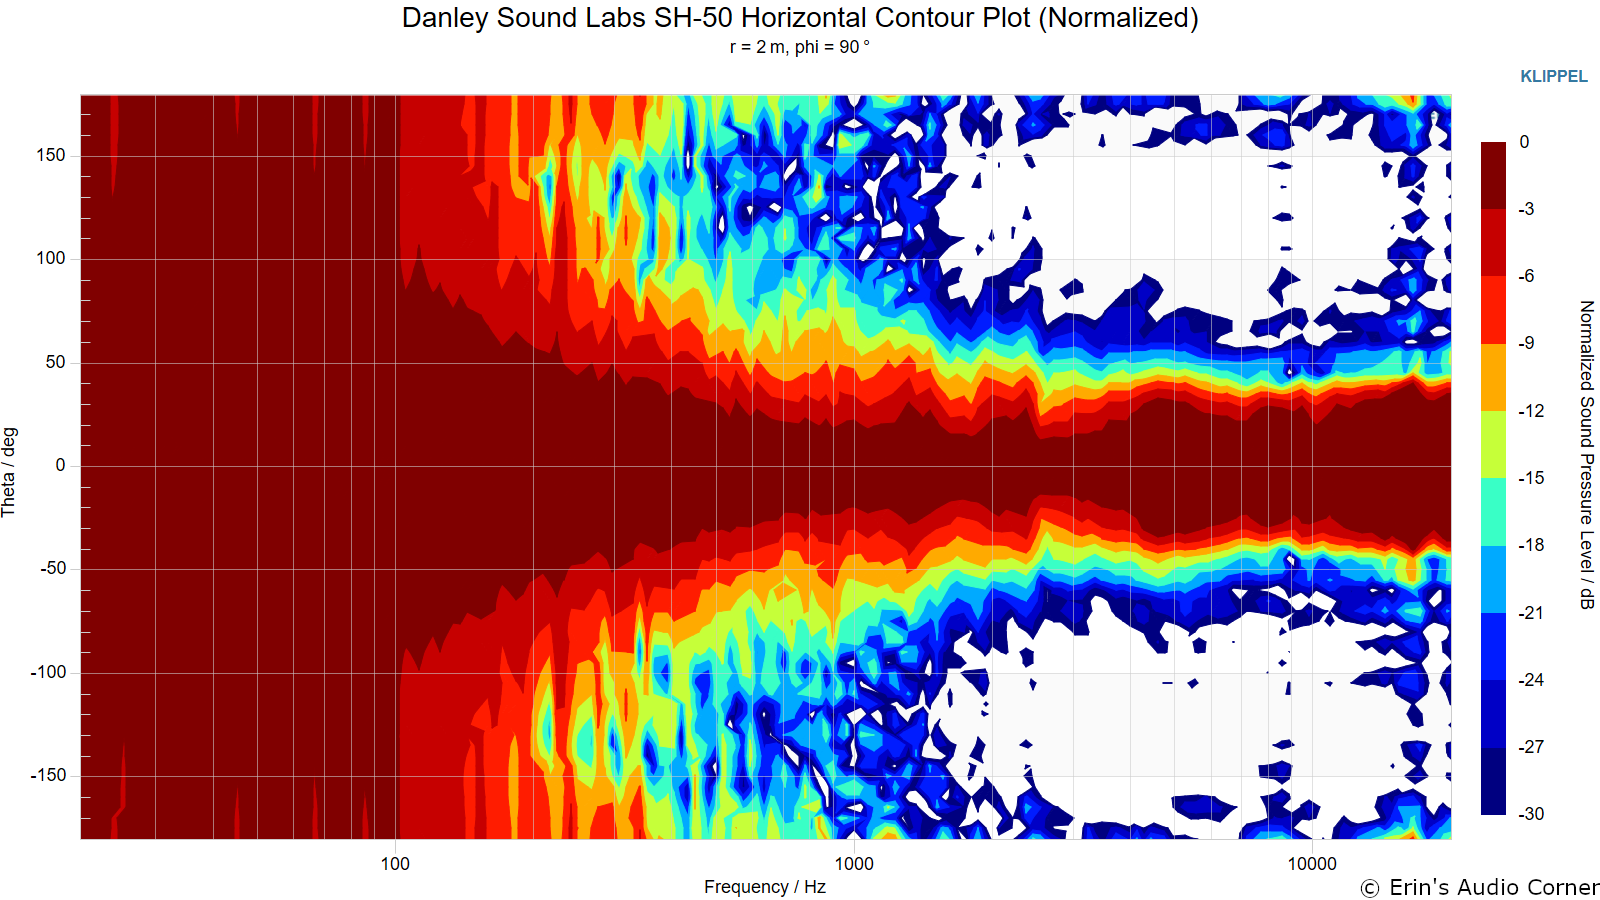
Horizontal Contour Plot (normalized):
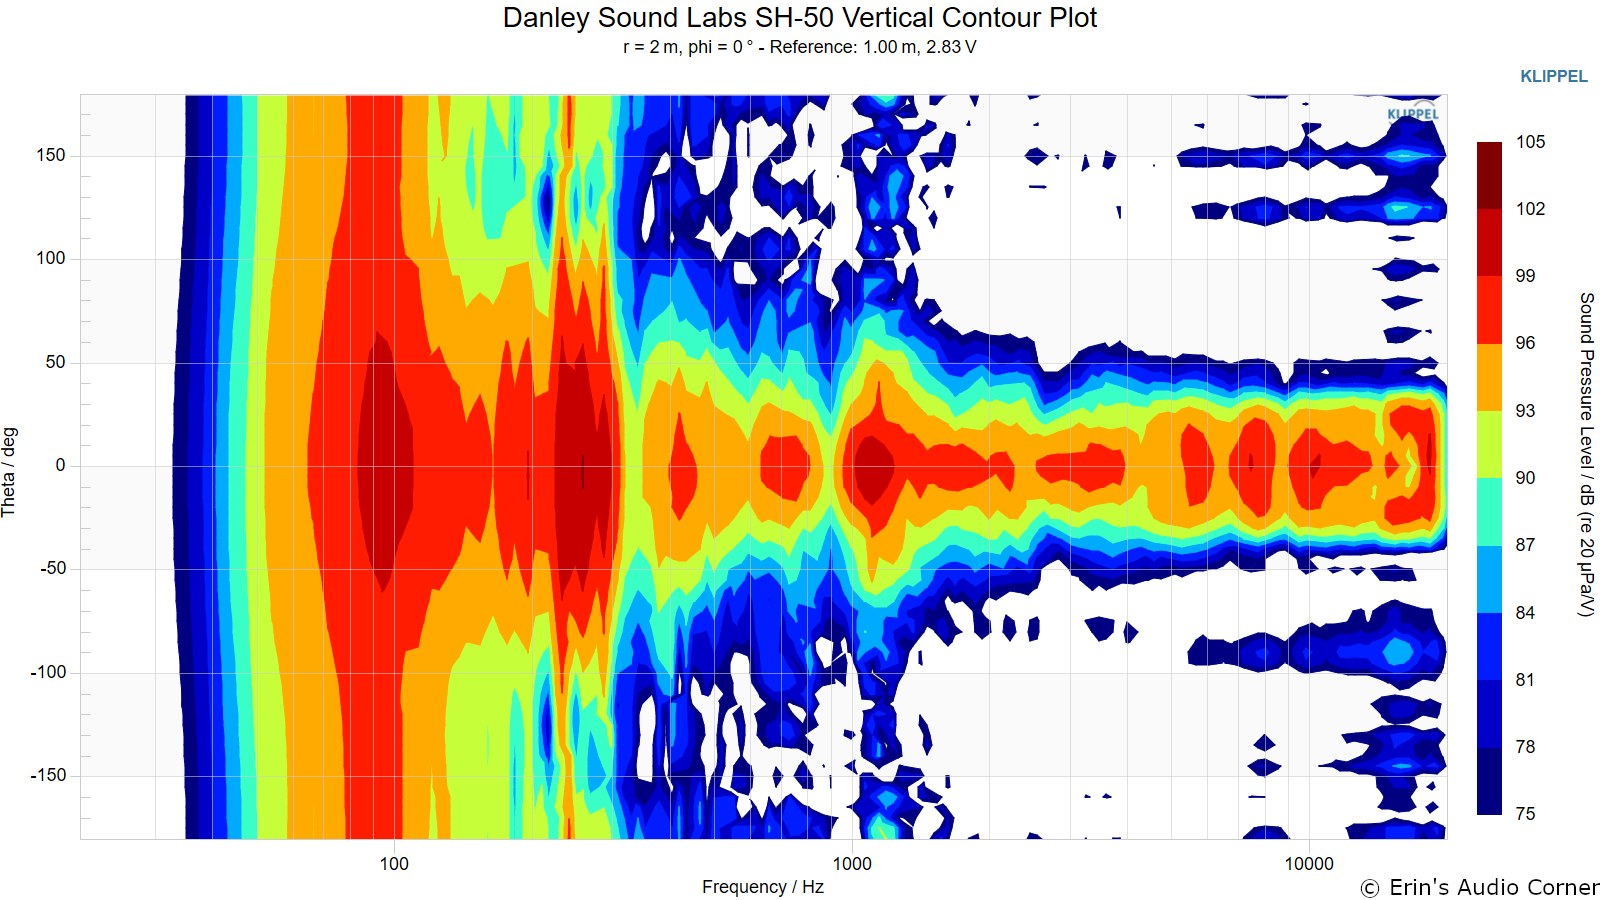
Vertical Contour Plot (not normalized):
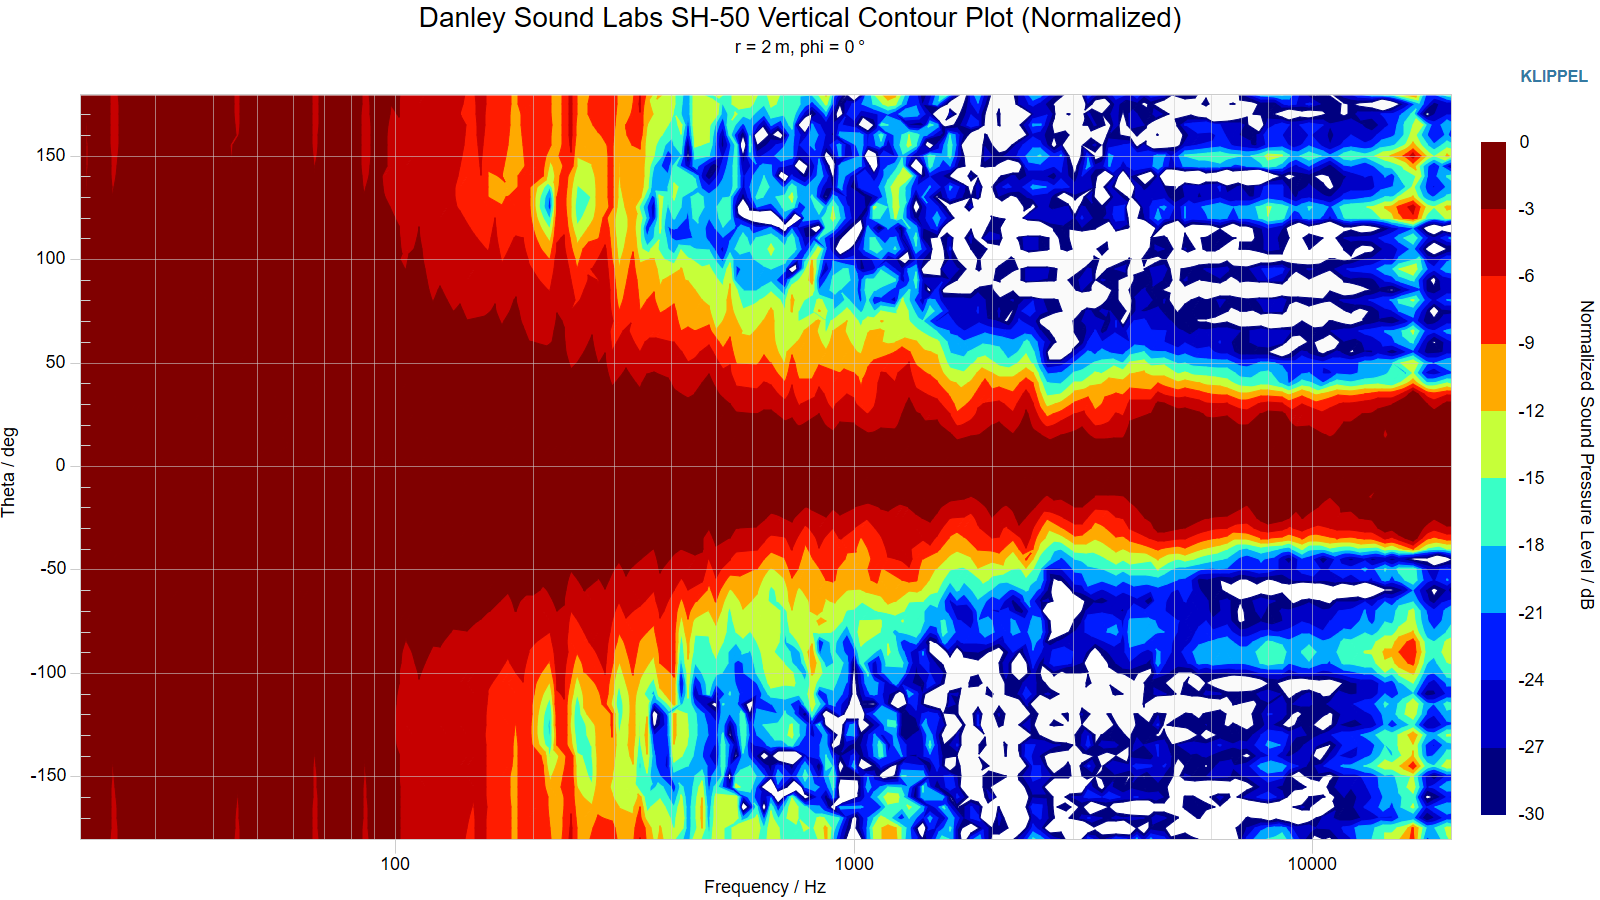
Vertical Contour Plot (normalized):
Additional Measurements
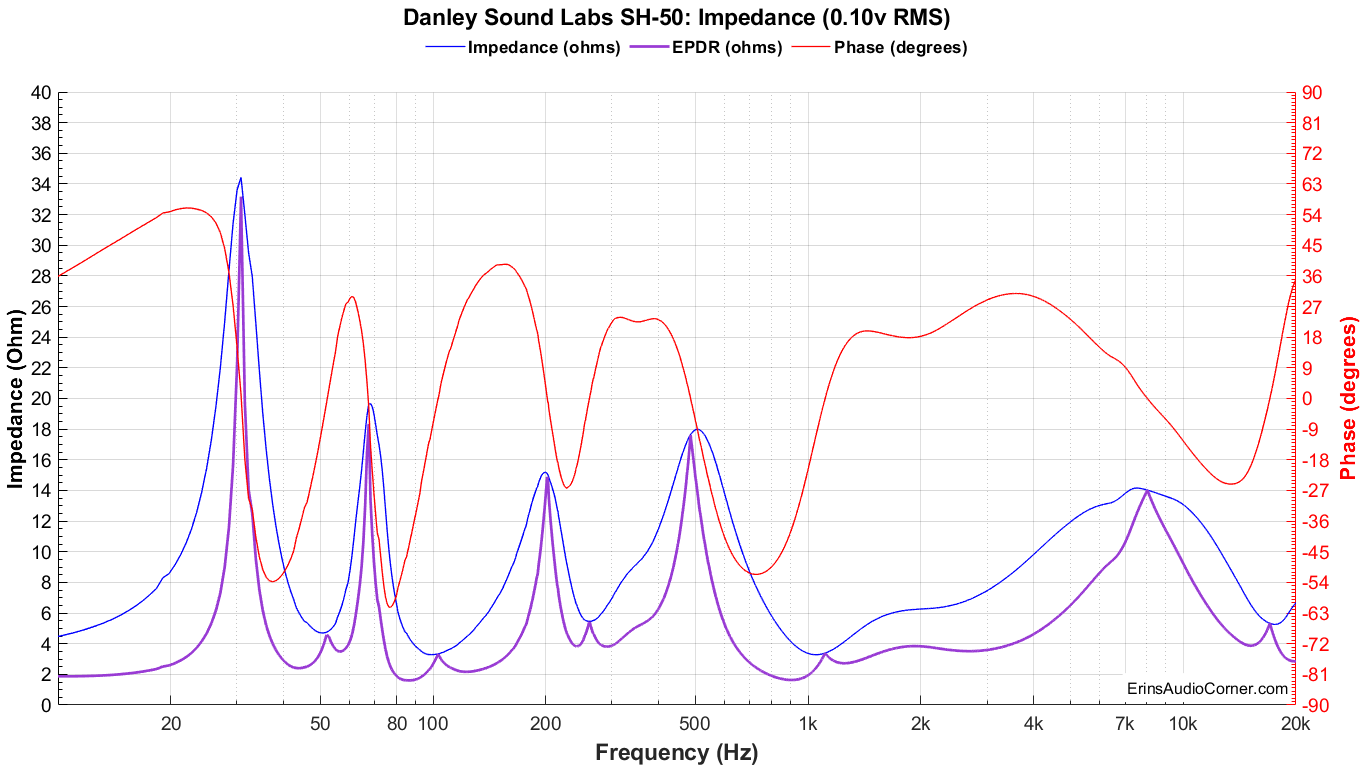
Impedance Magnitude and Phase + Equivalent Peak Dissipation Resistance (EPDR)
For those who do not know what EPDR is (ahem, me until 2020), Keith Howard came up with this metric which he defined in a 2007 article for Stereophile as:
… simply the resistive load that would give rise to the same peak device dissipation as the speaker itself.
A note from Dr. Jack Oclee-Brown of Kef (who supplied the formula for calculating EPDR):
Just a note of caution that the EPDR derivation is based on a class-B output stage so it’s valid for typical class-AB amps but certainly not for class-A and probably has only marginal relevance for class-D amps (would love to hear from a class-D expert on this topic).
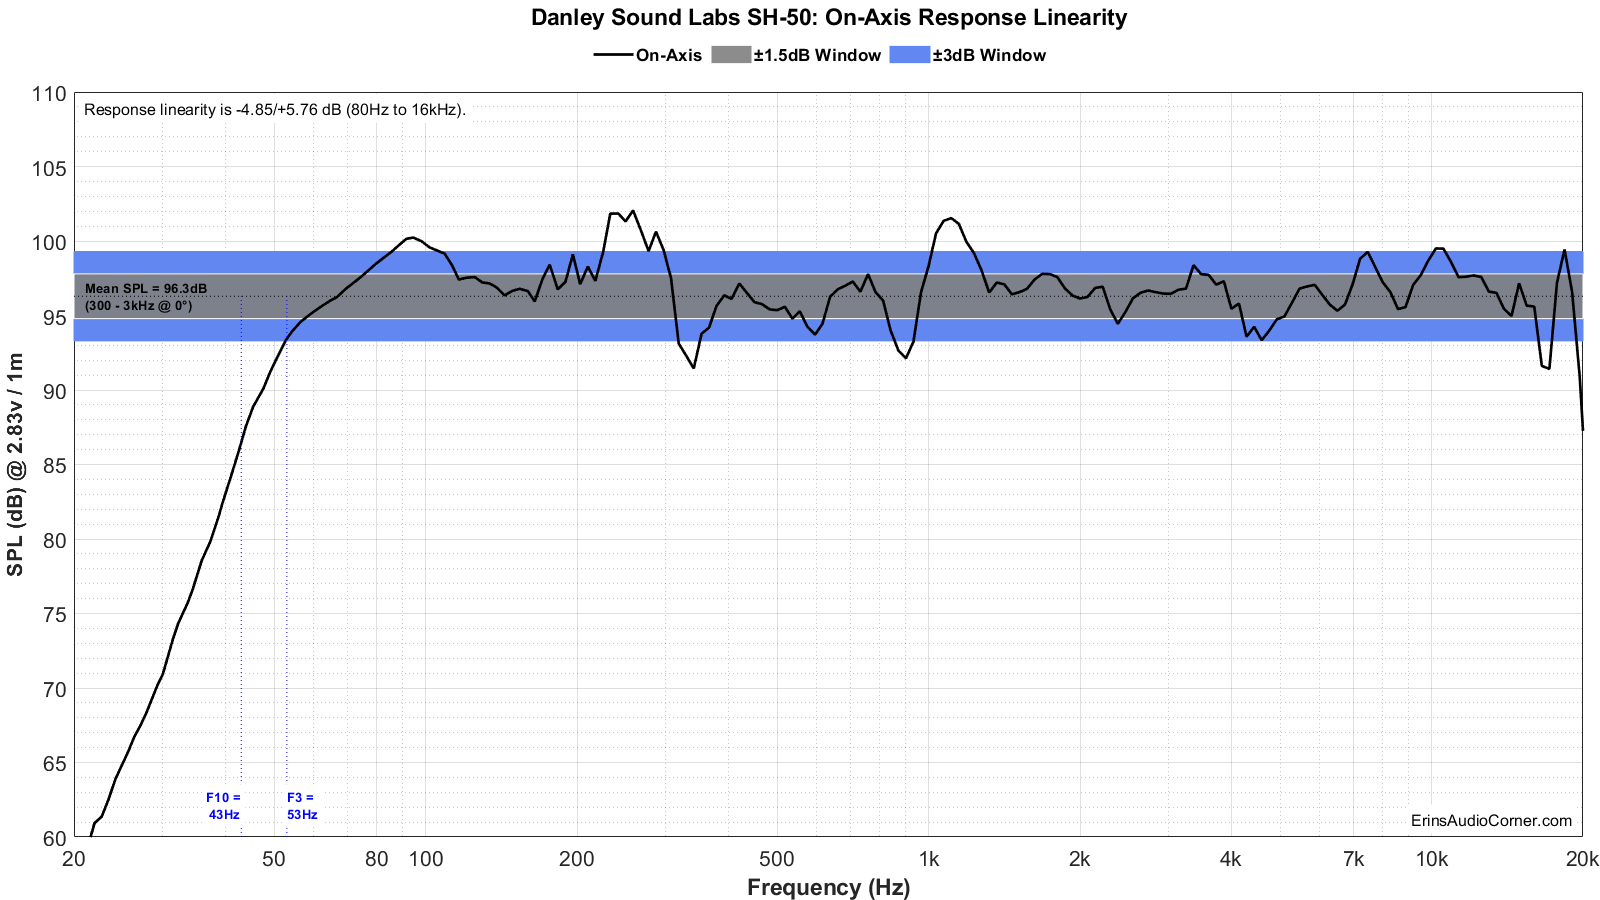
On-Axis Response Linearity
“Globe” Plots
These plots are generated from exporting the Klippel data to text files. I then process that data with my own MATLAB script to provide what you see. These are not part of any software packages and are unique to my tests.
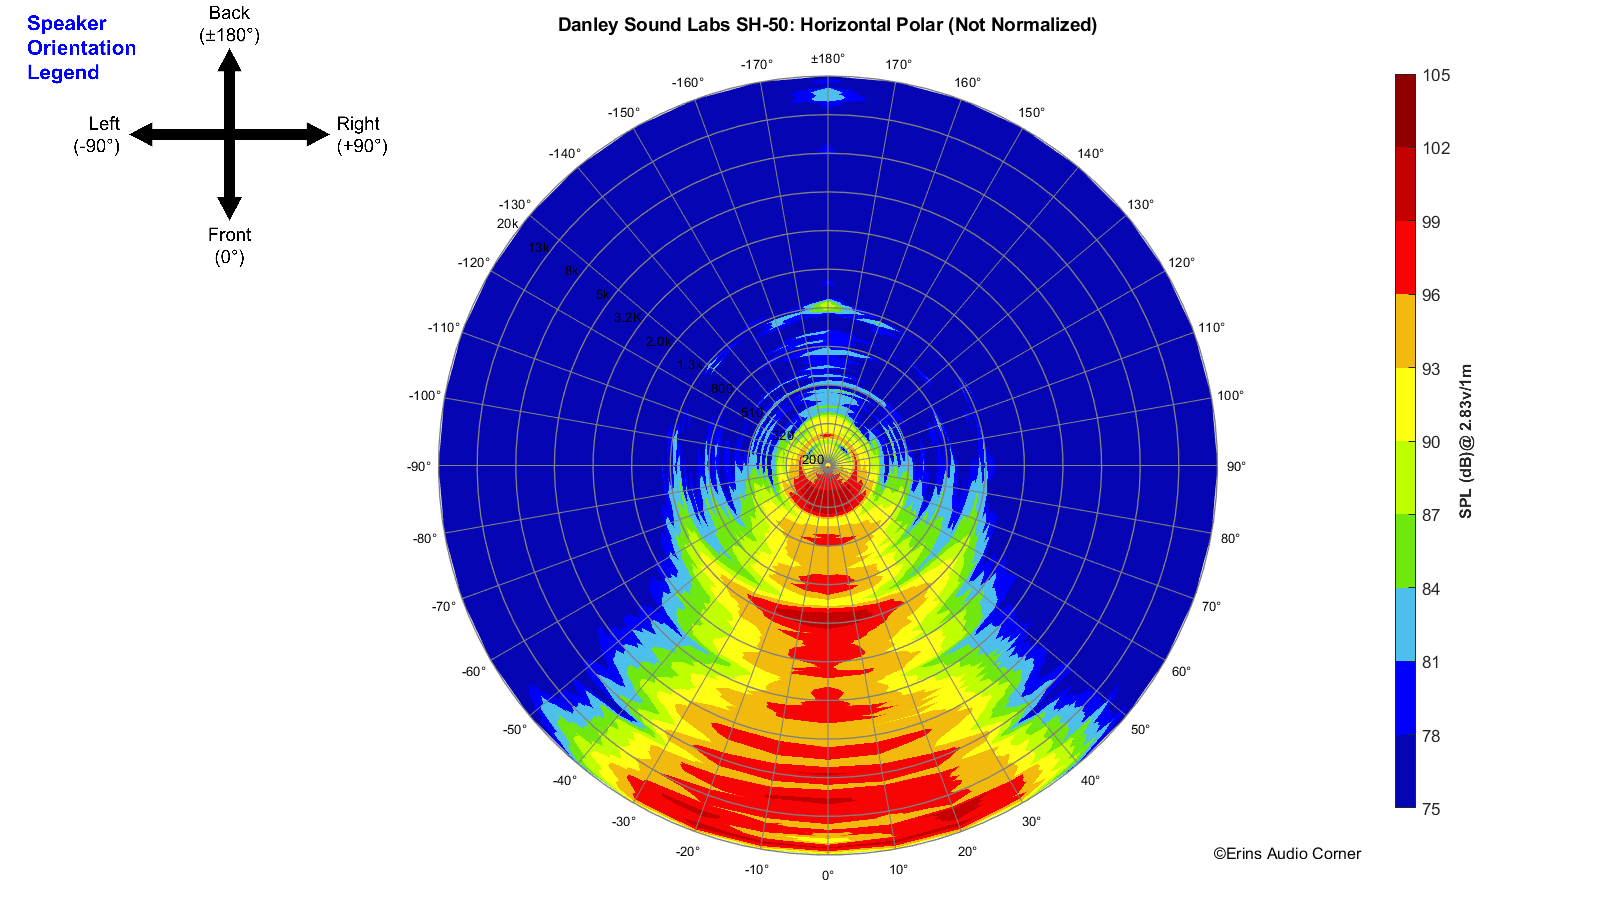
Horizontal Polar (Globe) Plot:
This represents the sound field at 2 meters - above 200Hz - per the legend in the upper left.
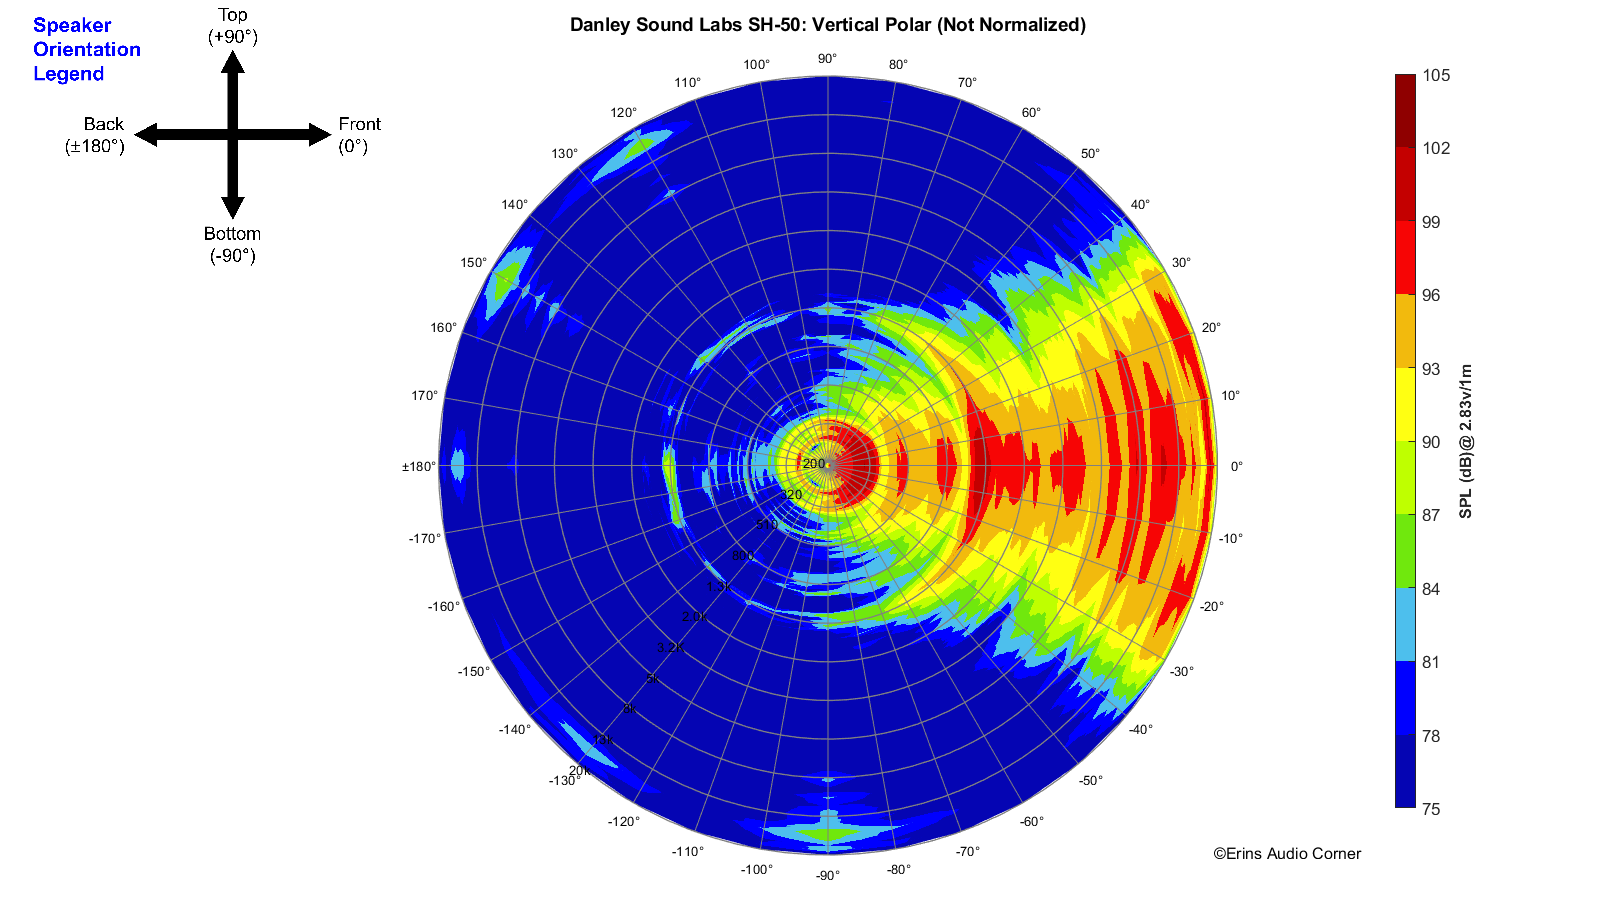
Vertical Polar (Globe) Plot:
This represents the sound field at 2 meters - above 200Hz - per the legend in the upper left.
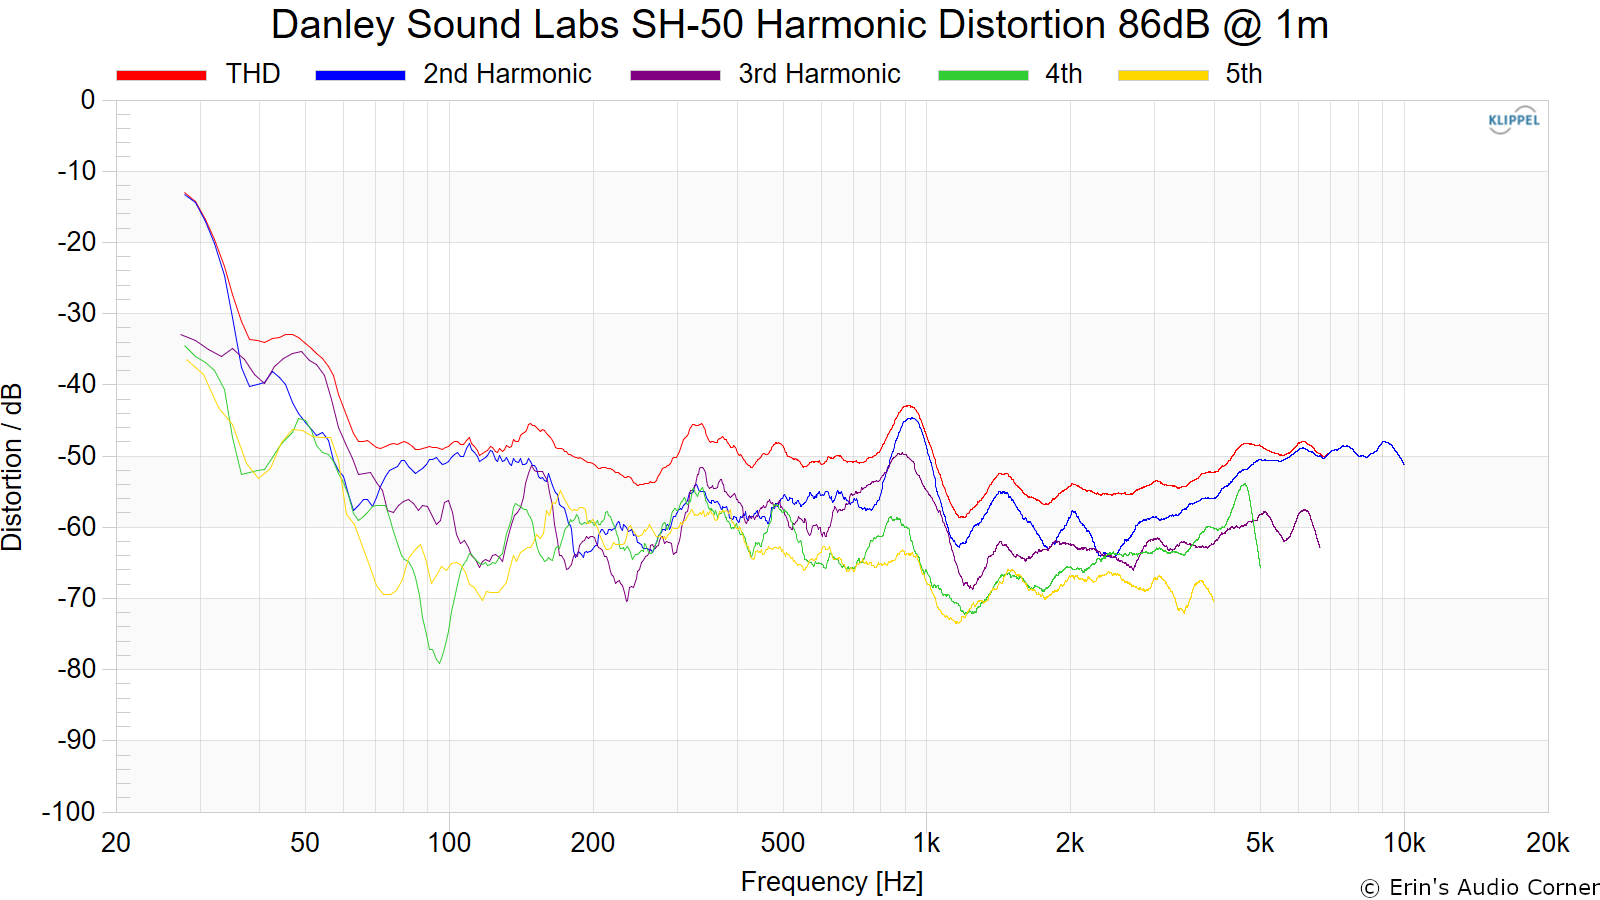
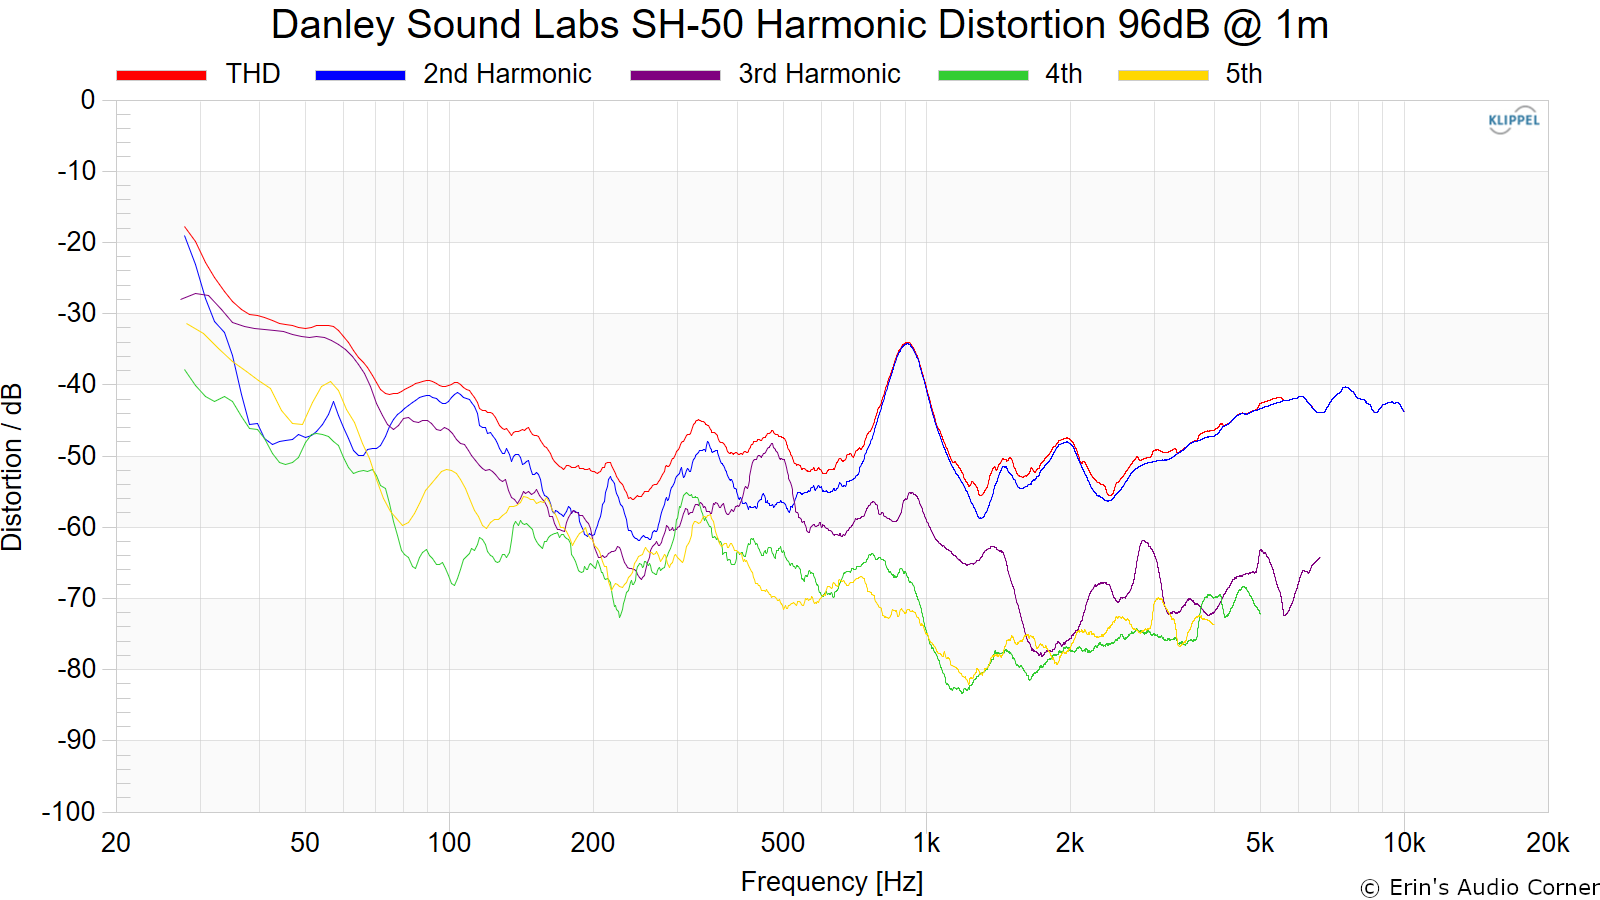
Harmonic Distortion
Harmonic Distortion at 86dB @ 1m:
Harmonic Distortion at 96dB @ 1m:
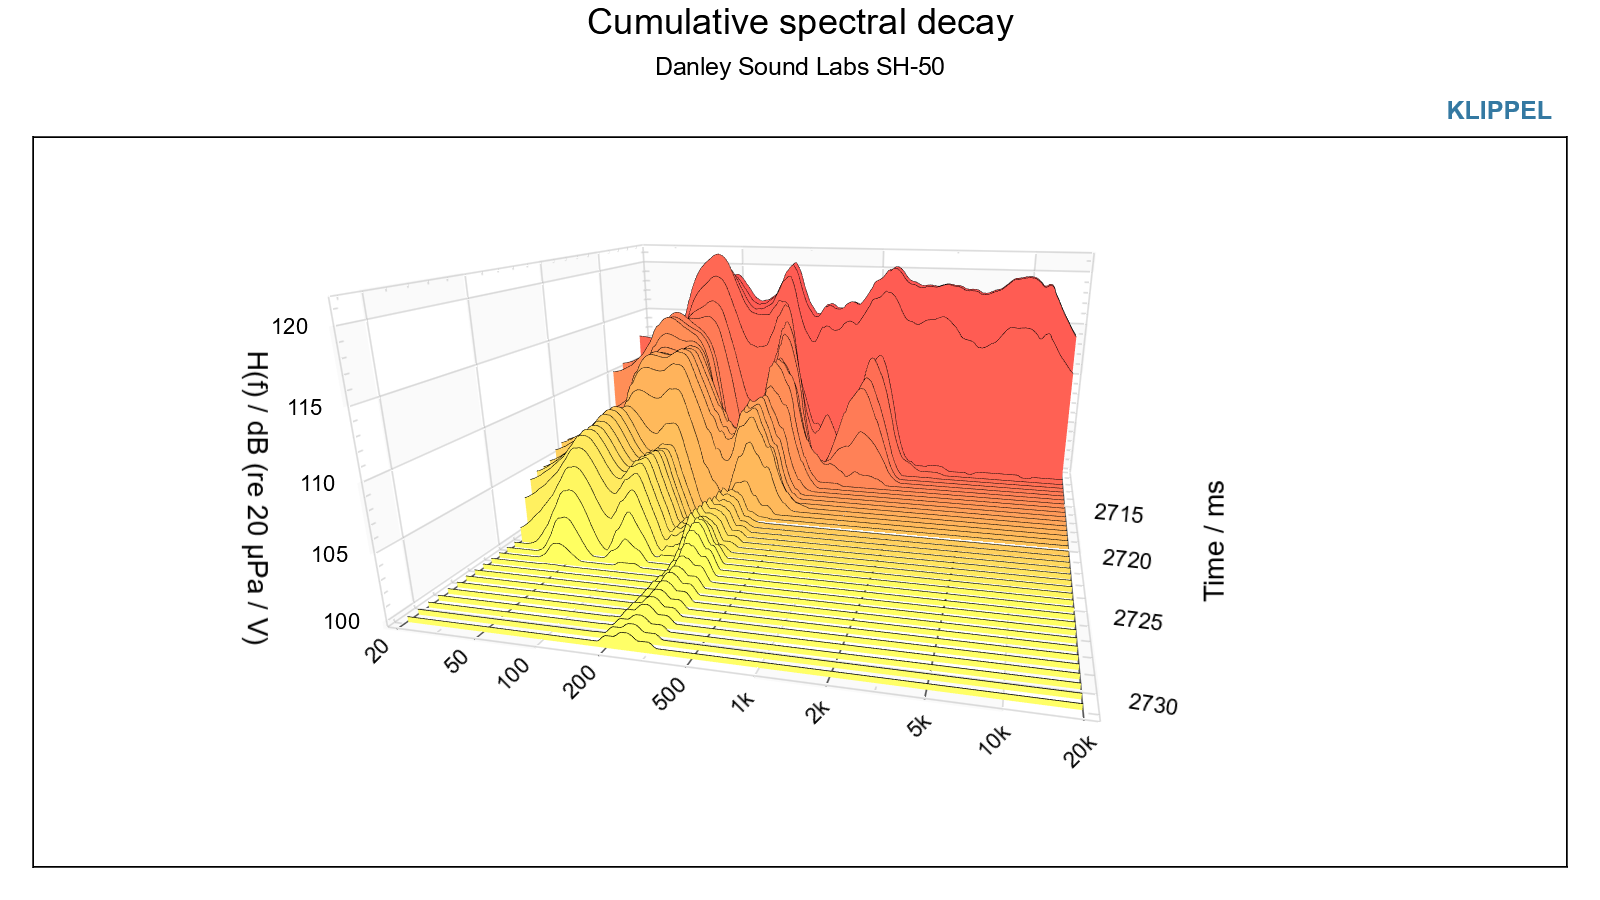
Cumulative Spectral Decay (CSD)
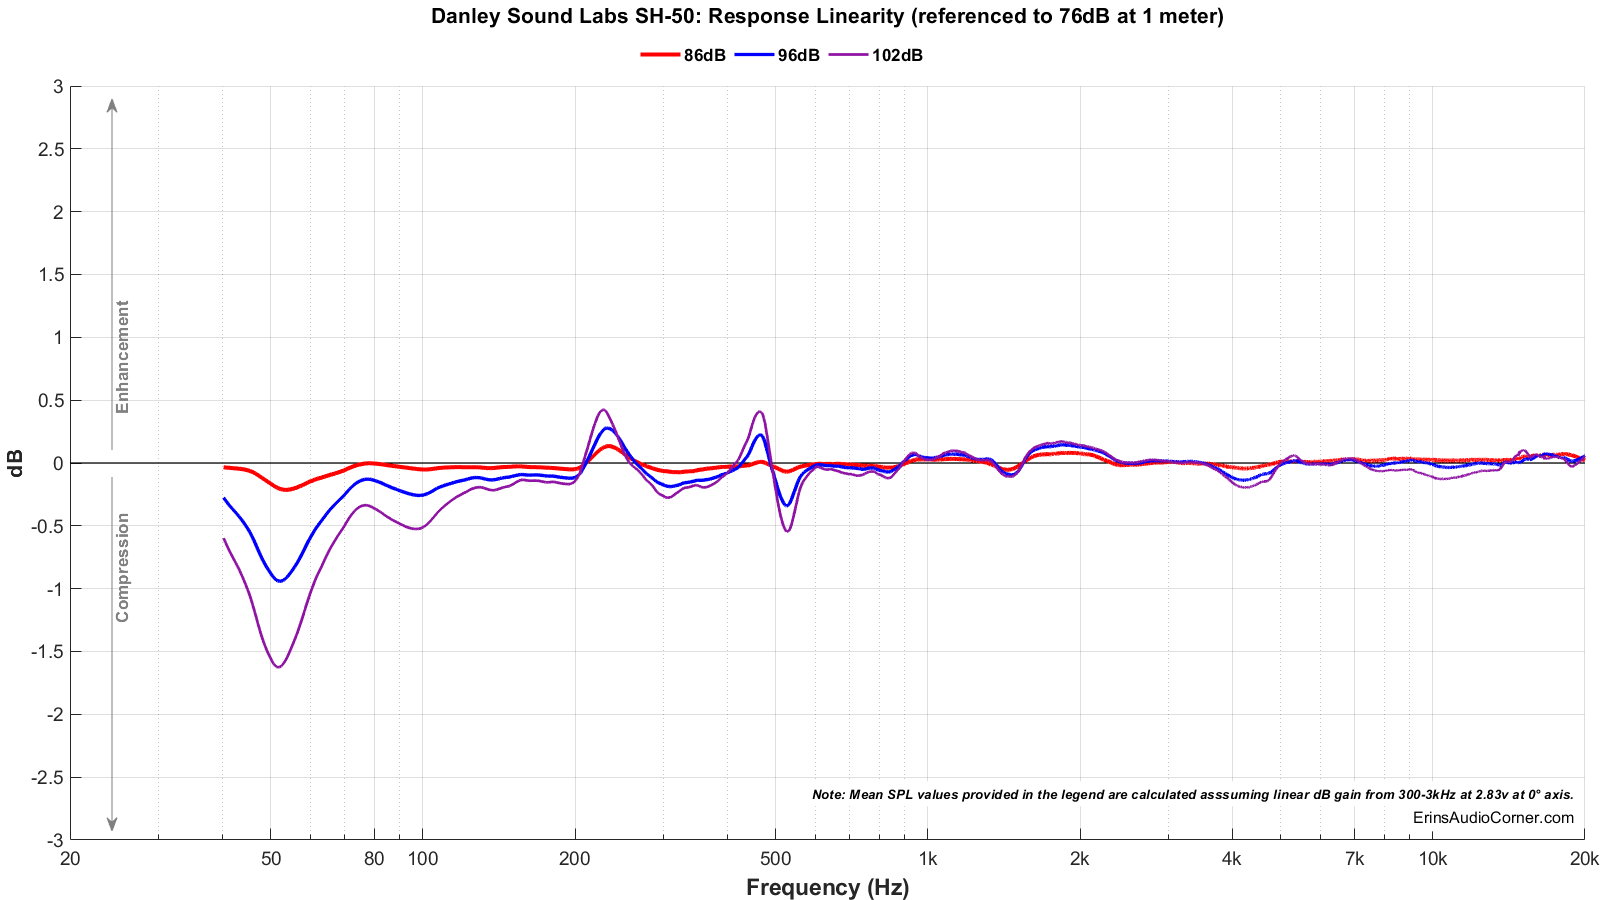
Dynamic Range (Instantaneous Compression Test)
The below graphic indicates just how much SPL is lost (compression) or gained (enhancement; usually due to distortion) when the speaker is played at higher output volumes instantly via a 2.7 second logarithmic sine sweep referenced to 76dB at 1 meter. The signals are played consecutively without any additional stimulus applied. Then normalized against the 76dB result.
The tests are conducted in this fashion:
- 76dB at 1 meter (baseline; black)
- 86dB at 1 meter (red)
- 96dB at 1 meter (blue)
- 102dB at 1 meter (purple)
The purpose of this test is to illustrate how much (if at all) the output changes as a speaker’s components temperature increases (i.e., voice coils, crossover components) instantaneously.
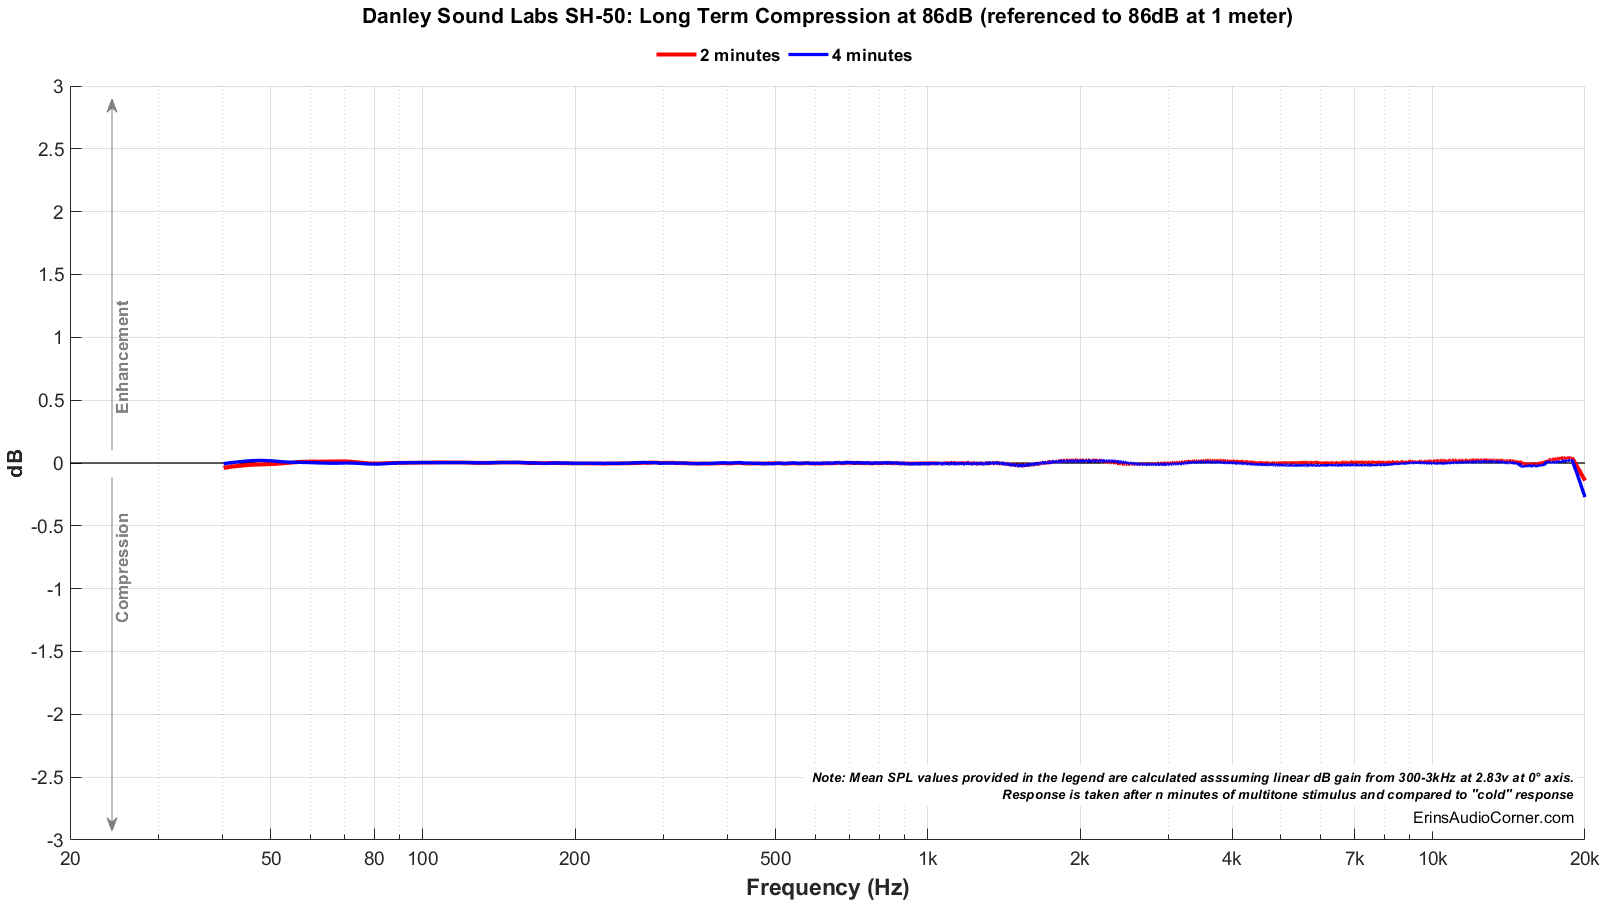
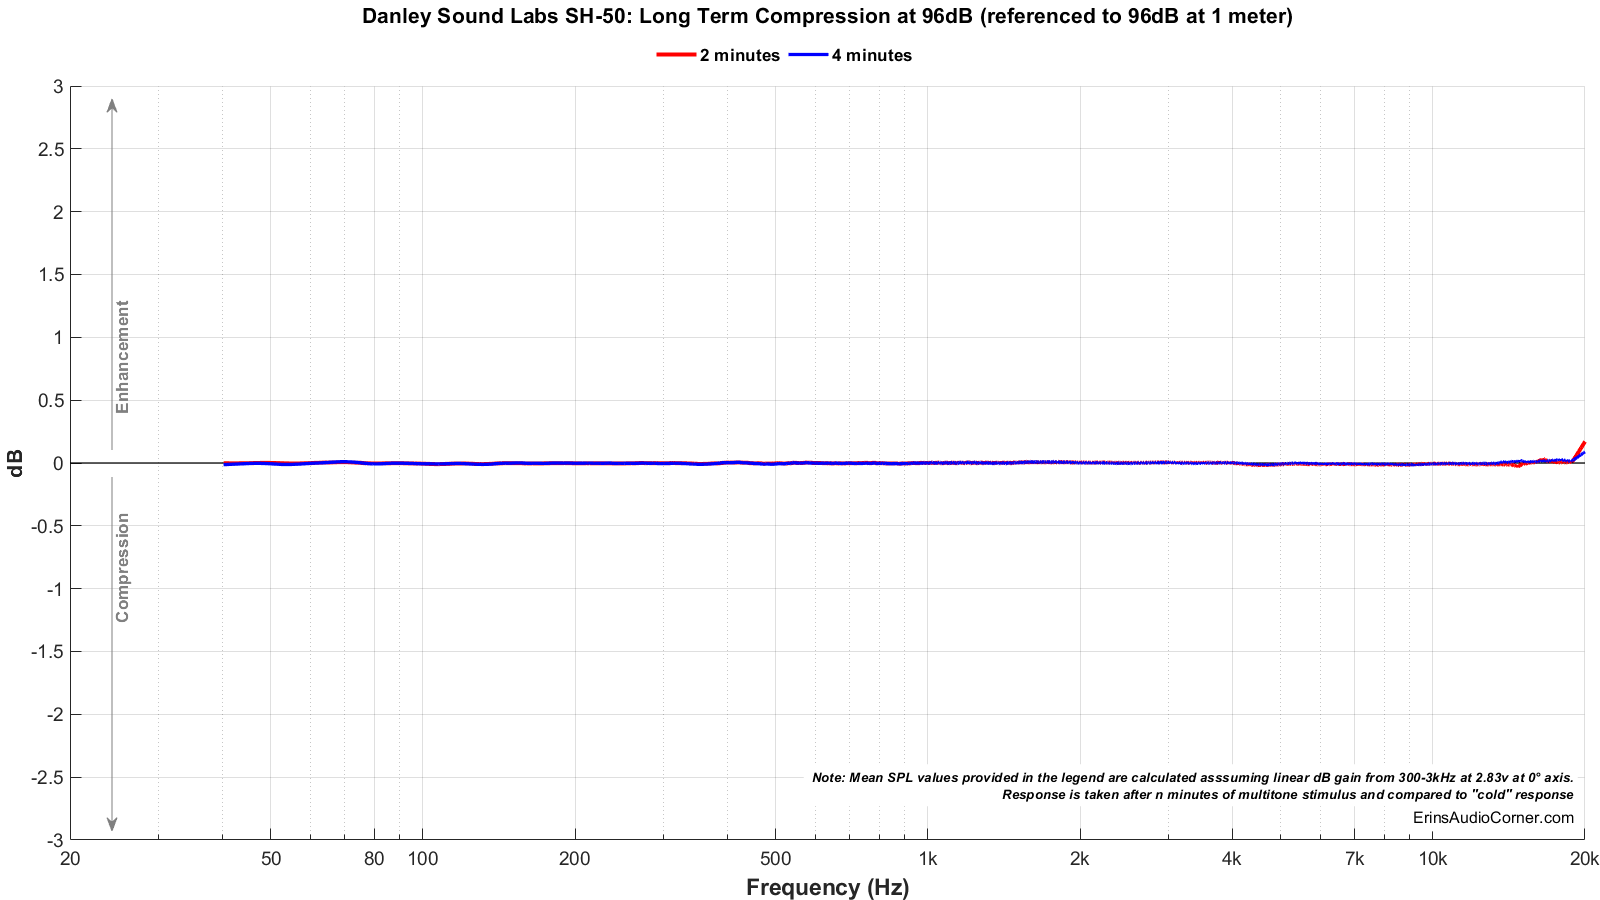
Long Term Compression Tests
The below graphics indicate how much SPL is lost or gained in the long-term as a speaker plays at the same output level for 2 minutes, in intervals. Each graphic represents a different SPL: 86dB and 96dB both at 1 meter.
The purpose of this test is to illustrate how much (if at all) the output changes as a speaker’s components temperature increases (i.e., voice coils, crossover components).
The tests are conducted in this fashion:
- “Cold” logarithmic sine sweep (no stimulus applied beforehand)
- Multitone stimulus played at desired SPL/distance for 2 minutes; intended to represent music signal
- Interim logarithmic sine sweep (no stimulus applied beforehand) (Red in graphic)
- Multitone stimulus played at desired SPL/distance for 2 minutes; intended to represent music signal
- Final logarithmic sine sweep (no stimulus applied beforehand) (Blue in graphic)
The red and blue lines represent changes in the output compared to the initial “cold” test.
Parting / Random Thoughts
If you want to see the music I use for evaluating speakers subjectively, see my Spotify playlist.
Now, keep in mind all of this is evaluating a pro audio speaker in a home environment. Is this the right way to evaluate such a speaker? I do know Danley recommends the SM-60 for home audio. But I don’t see any reason why the SH-50 can’t be evaluated in the home as long as the distance from the speaker is far enough away for the drivers to align acoustically (and they do this at around 1.50 meters).
- Subjective listening was mainly in the farfield at 3-4 meters in an open floorplan living room. Subjective listening was conducted at 80-95dB at these distances and occasionally higher. Higher volumes were done simply to test the output capability in case one wants to try to sit further away. I only had a single unit to test (the one barely fit in my car; two was out of the question).
- This speaker gets crazy loud. I mean… crazy loud. But it should, right? After all, it is a PA speaker. I measured the output of the single unit to be about 112dB @ 4 meters. That was with one speaker. Another speaker would have put it to 118dB @ 4 meters. That is insane levels; levels no listener would ever realistically need. At this end of things you could hear the compression creeping in but this was also fullrange. When I had implemented a high-pass filter with these speakers set at 80Hz (as you likely would when using a subwoofer) then the low-frequency distortion was freed up and the output was super-clean (that is a technical term, sarcasm). Imagine having that much dynamic range on tap. Crazy.
- Speaking of low end, the bass extension was enough for the majority of my music (I love me some good 80’s synth-pop) but, yea, you’d need a subwoofer for varied genres and certainly movies with LFE. I can’t imagine a customer or venue that would have a bunch of these but not also have some extremely large subwoofer cabinets with high efficiency subwoofers flanking the mains.
- “Out of the box” the tonality was not to my liking. The midrange was “thin” and the upper midbass was a bit boomy. Looking at the data, I made some EQ adjustments: -3dB @ 250Hz and -3dB @ 1100Hz on a basic graphic equalizer. Much better. Now the midrange wasn’t overshadowed by these frequencies and the overall tonality was more neutral. Still, not perfect. Though, honestly, I don’t expect people to buy this particular speaker for home audio use. I know they have. But I think Danley has better offerings if that is your goal (the SM-60 as I mentioned previously… or you can go full-tilt and get their incredible-sounding Danley Hyperion speaker I was able to demo (linked below)).
- Acoustically, the thing that really impressed me about this speaker was the depth of the soundstage. Once again, coaxially mounted speaker does a great job at this. But even in mono, the depth of the soundstage of this speaker was unlike nothing I have heard before.
- The radiation pattern is quite narrow but well controlled. Once you go beyond about 30° to the side or above/below the speaker, the SPL drops off.
Here is my video discussing my demo of the Hyperion speaker which implements a synergy horn closer to that of the SM-60:
Support the Cause
If you like what you see here and want to help support the cause there are a few ways you can do so:
- Join my Patreon here.
- Contribute via PayPal here.
- Using my Amazon affiliate link below as it helps me gain a small commission at no additional cost to you.
Your support helps me pay for new items to test, hardware, miscellaneous items and costs of the site’s server space and bandwidth. All of which I otherwise pay out of pocket. So, if you can help chip in a few bucks, know that it is very much appreciated.
You can also join my Facebook and YouTube pages if you’d like to follow along with updates.