Foreword / YouTube Video Review
This speaker was loaned to me by their owner in LNIB condition.
The review on this website is a brief overview and summary of the objective performance of this speaker. It is not intended to be a deep dive. Moreso, this is information for those who prefer “just the facts” and prefer to have the data without the filler. The video below has more discussion on how to read and understand the data.
Information and Photos
Some specs from the manufacturer:
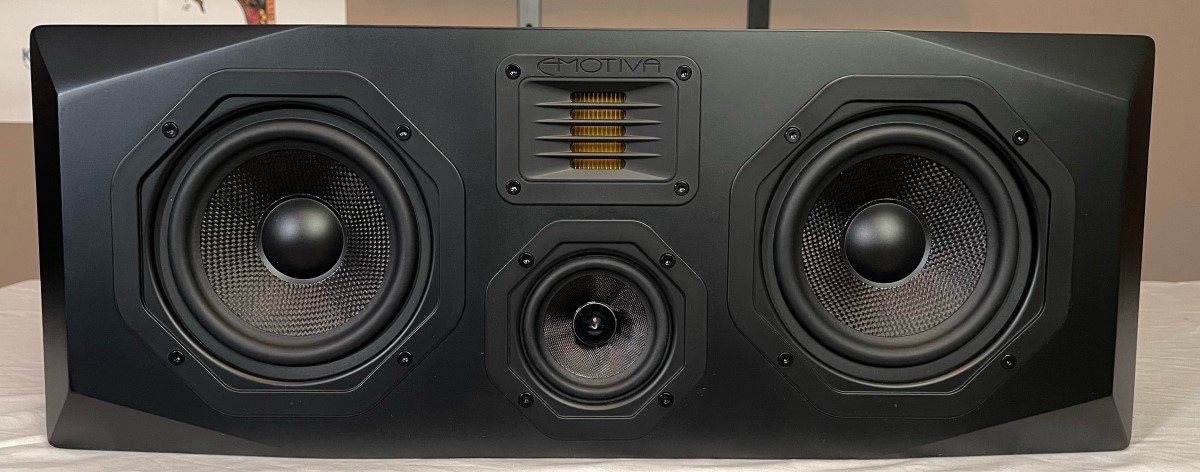
The Airmotiv C1+ is a three-way center channel loudspeaker that delivers a superb listening experience with surround sound music and movies. The Airmotiv C1+ combines exceptional accuracy, amazing precision and detail retrieval, and unsurpassed smoothness - all in one truly great sounding loudspeaker. The Airmotiv C1+ features a 32 mm Airmotiv folded ribbon tweeter, a 3” woven fiber midrange driver, and dual 5-1/4” woven fiber woofers. The center channel loudspeaker is one of the most critical components in a high-performance home theater system. Because most important dialog is directed to the center channel, it is especially important that your center channel speaker be able to accurately reproduce both instruments and voice clearly and intelligibly, but without the slightest hint of distortion or harshness. And, in order to ensure proper positioning of sounds within the sound stage, the ideal center channel speaker must offer exceptionally wide flat frequency response, both on and off axis. With its full three-way design the Airmotiv C1+ avoids the limitations of many other center channel designs, to blend perfectly with your main speakers, and deliver pinpoint accurate imaging across the entire sound stage.
Price is approximately $299 USD for the single speaker.
If you are interested in purchasing this speaker, please consider using the following affiliate link which earns me a small commission at no additional cost to you: Buy from Emotiva
CTA-2034 (SPINORAMA) and Accompanying Data
All data collected using Klippel’s Near-Field Scanner. The Near-Field-Scanner 3D (NFS) offers a fully automated acoustic measurement of direct sound radiated from the source under test. The radiated sound is determined in any desired distance and angle in the 3D space outside the scanning surface. Directivity, sound power, SPL response and many more key figures are obtained for any kind of loudspeaker and audio system in near field applications (e.g. studio monitors, mobile devices) as well as far field applications (e.g. professional audio systems). Utilizing a minimum of measurement points, a comprehensive data set is generated containing the loudspeaker’s high resolution, free field sound radiation in the near and far field. For a detailed explanation of how the NFS works and the science behind it, please watch the below discussion with designer Christian Bellmann:
The reference plane in this test is at the tweeter as this yielded the most neutral response overall. Testing was performed without the grille.
Measurements are provided in a format in accordance with the Standard Method of Measurement for In-Home Loudspeakers (ANSI/CTA-2034-A R-2020). For more information, please see this link.
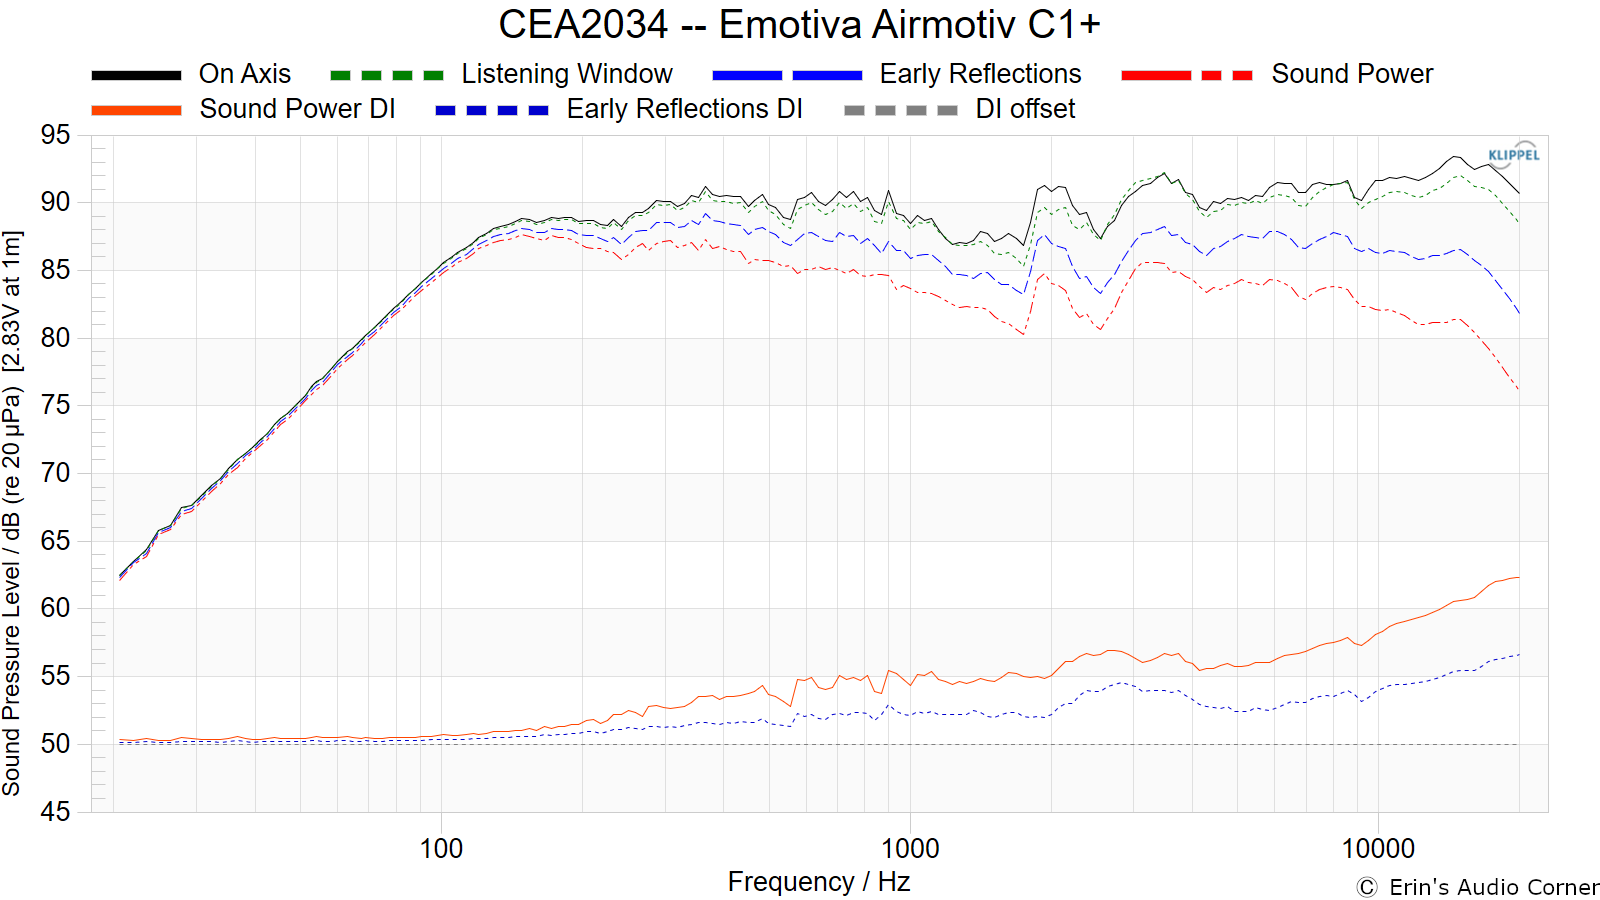
CTA-2034 / SPINORAMA:
The On-axis Frequency Response (0°) is the universal starting point and in many situations, it is a fair representation of the first sound to arrive at a listener’s ears.
The Listening Window is a spatial average of the nine amplitude responses in the ±10º vertical and ±30º horizontal angular range. This encompasses those listeners who sit within a typical home theater audience, as well as those who disregard the normal rules when listening alone.
The Early Reflections curve is an estimate of all single-bounce, first-reflections, in a typical listening room.
Sound Power represents all of the sounds arriving at the listening position after any number of reflections from any direction. It is the weighted rms average of all 70 measurements, with individual measurements weighted according to the portion of the spherical surface that they represent.
Sound Power Directivity Index (SPDI): In this standard the SPDI is defined as the difference between the listening window curve and the sound power curve.
Early Reflections Directivity Index (EPDI): is defined as the difference between the listening window curve and the early reflections curve. In small rooms, early reflections figure prominently in what is measured and heard in the room so this curve may provide insights into potential sound quality.
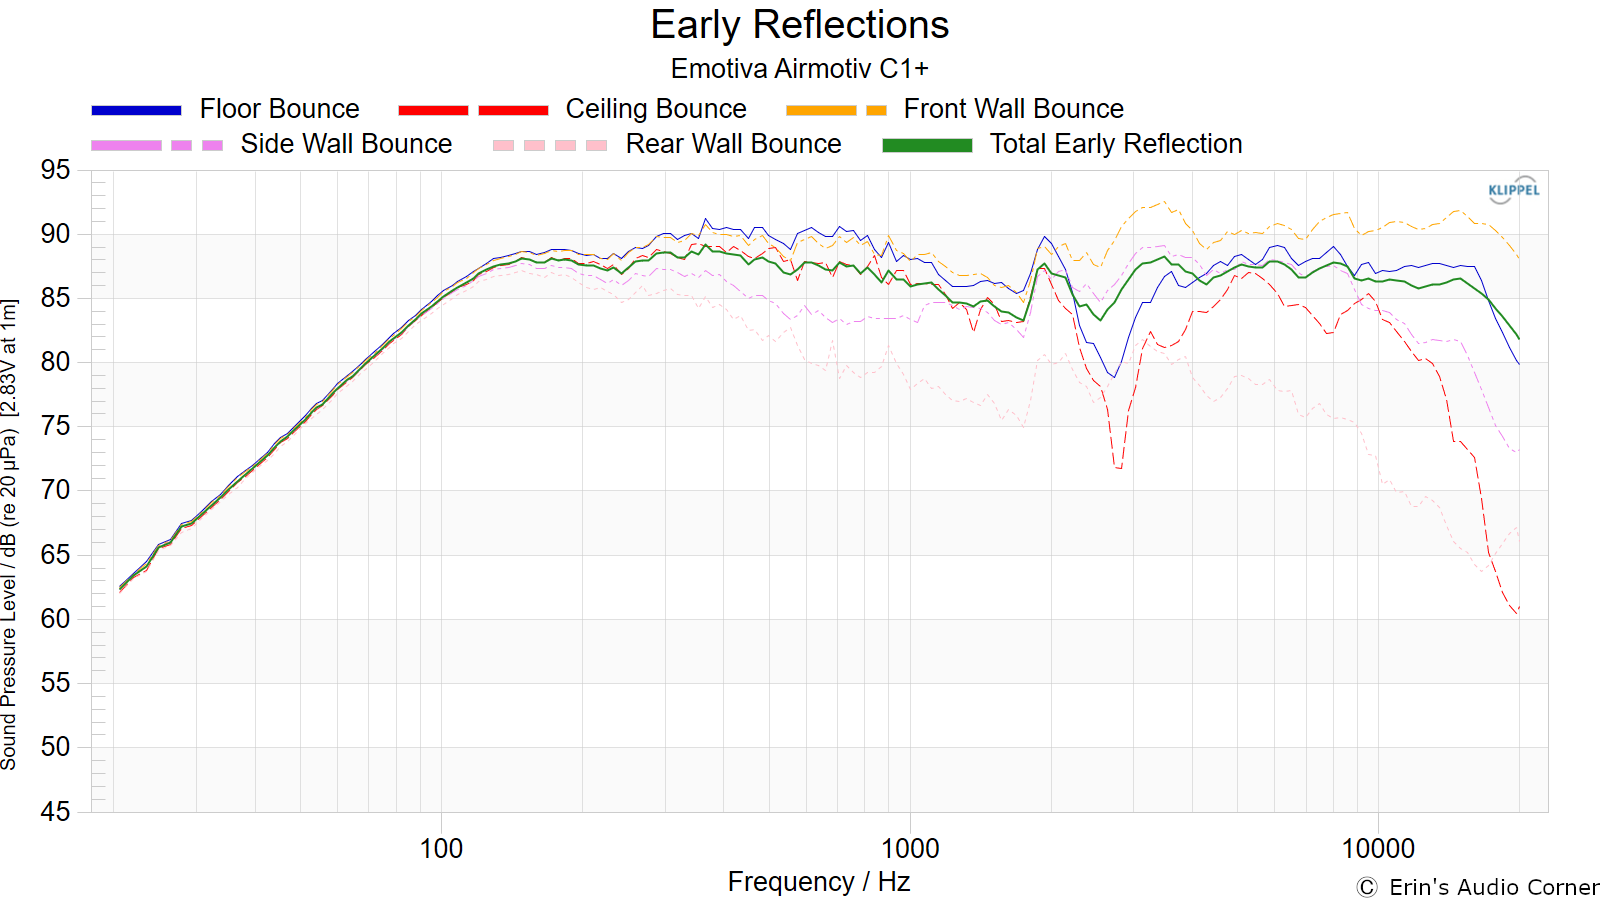
Early Reflections Breakout:
Floor bounce: average of 20º, 30º, 40º down
Ceiling bounce: average of 40º, 50º, 60º up
Front wall bounce: average of 0º, ± 10º, ± 20º, ± 30º horizontal
Side wall bounces: average of ± 40º, ± 50º, ± 60º, ± 70º, ± 80º horizontal
Rear wall bounces: average of 180º, ± 90º horizontal
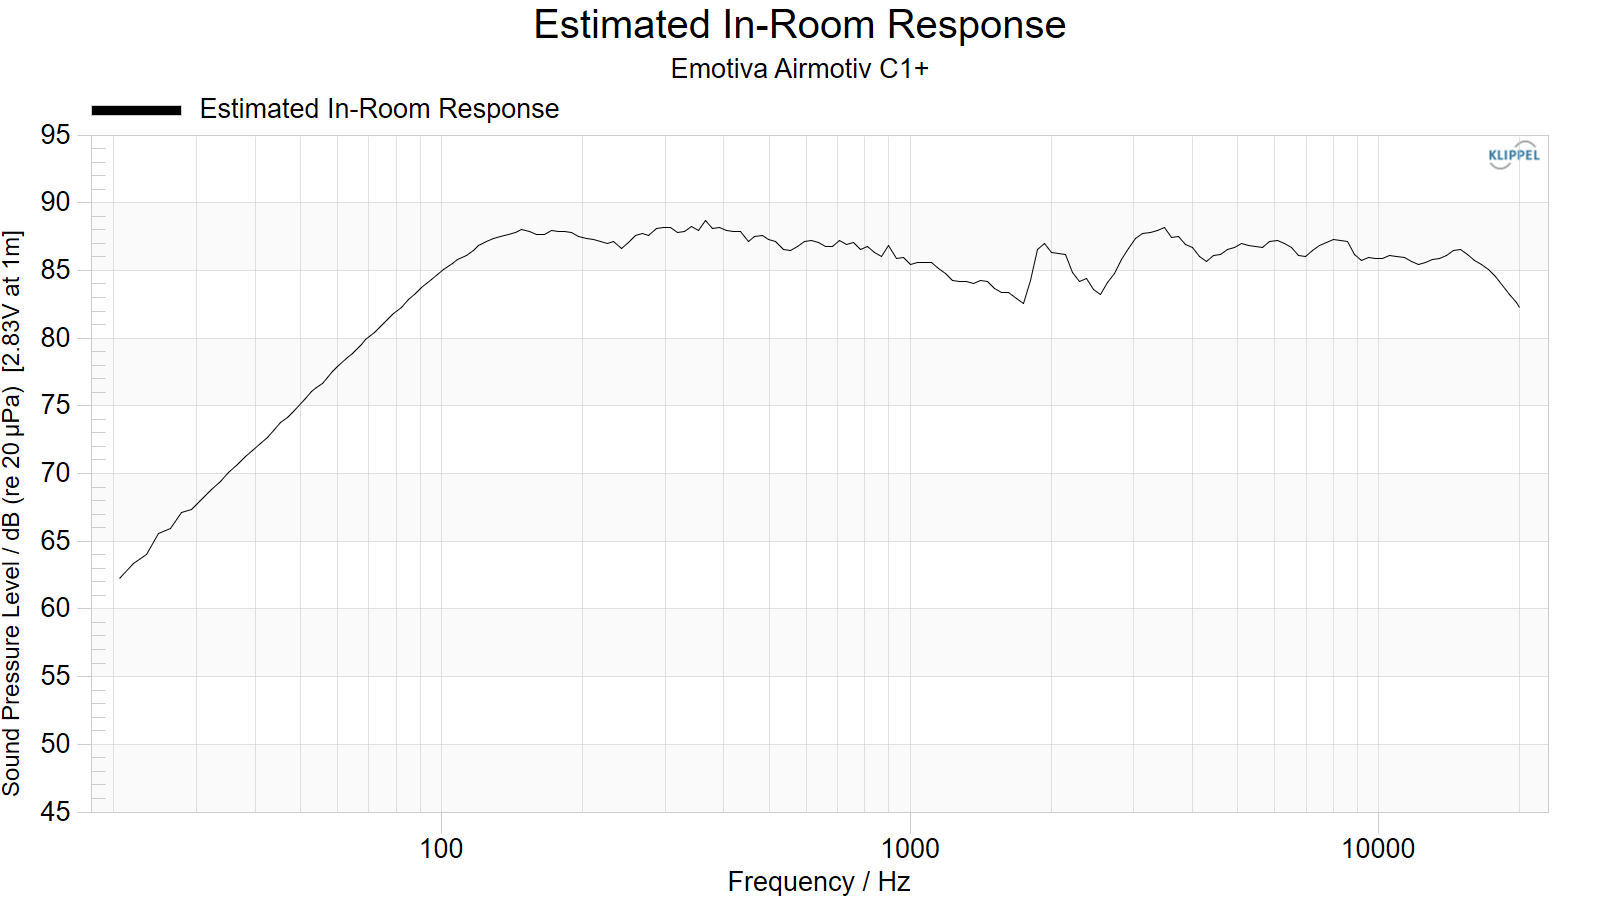
Estimated In-Room Response:
In theory, with complete 360-degree anechoic data on a loudspeaker and sufficient acoustical and geometrical data on the listening room and its layout it would be possible to estimate with good precision what would be measured by an omnidirectional microphone located in the listening area of that room. By making some simplifying assumptions about the listening space, the data set described above permits a usefully accurate preview of how a given loudspeaker might perform in a typical domestic listening room. Obviously, there are no guarantees, because individual rooms can be acoustically aberrant. Sometimes rooms are excessively reflective (“live”) as happens in certain hot, humid climates, with certain styles of interior décor and in under-furnished rooms. Sometimes rooms are excessively “dead” as in other styles of décor and in some custom home theaters where acoustical treatment has been used excessively. This form of post processing is offered only as an estimate of what might happen in a domestic living space with carpet on the floor and a “normal” amount of seating, drapes and cabinetry.
For these limited circumstances it has been found that a usefully accurate Predicted In-Room (PIR) amplitude response, also known as a “room curve” is obtained by a weighted average consisting of 12 % listening window, 44 % early reflections and 44 % sound power. At very high frequencies errors can creep in because of excessive absorption, microphone directivity, and room geometry. These discrepancies are not considered to be of great importance.
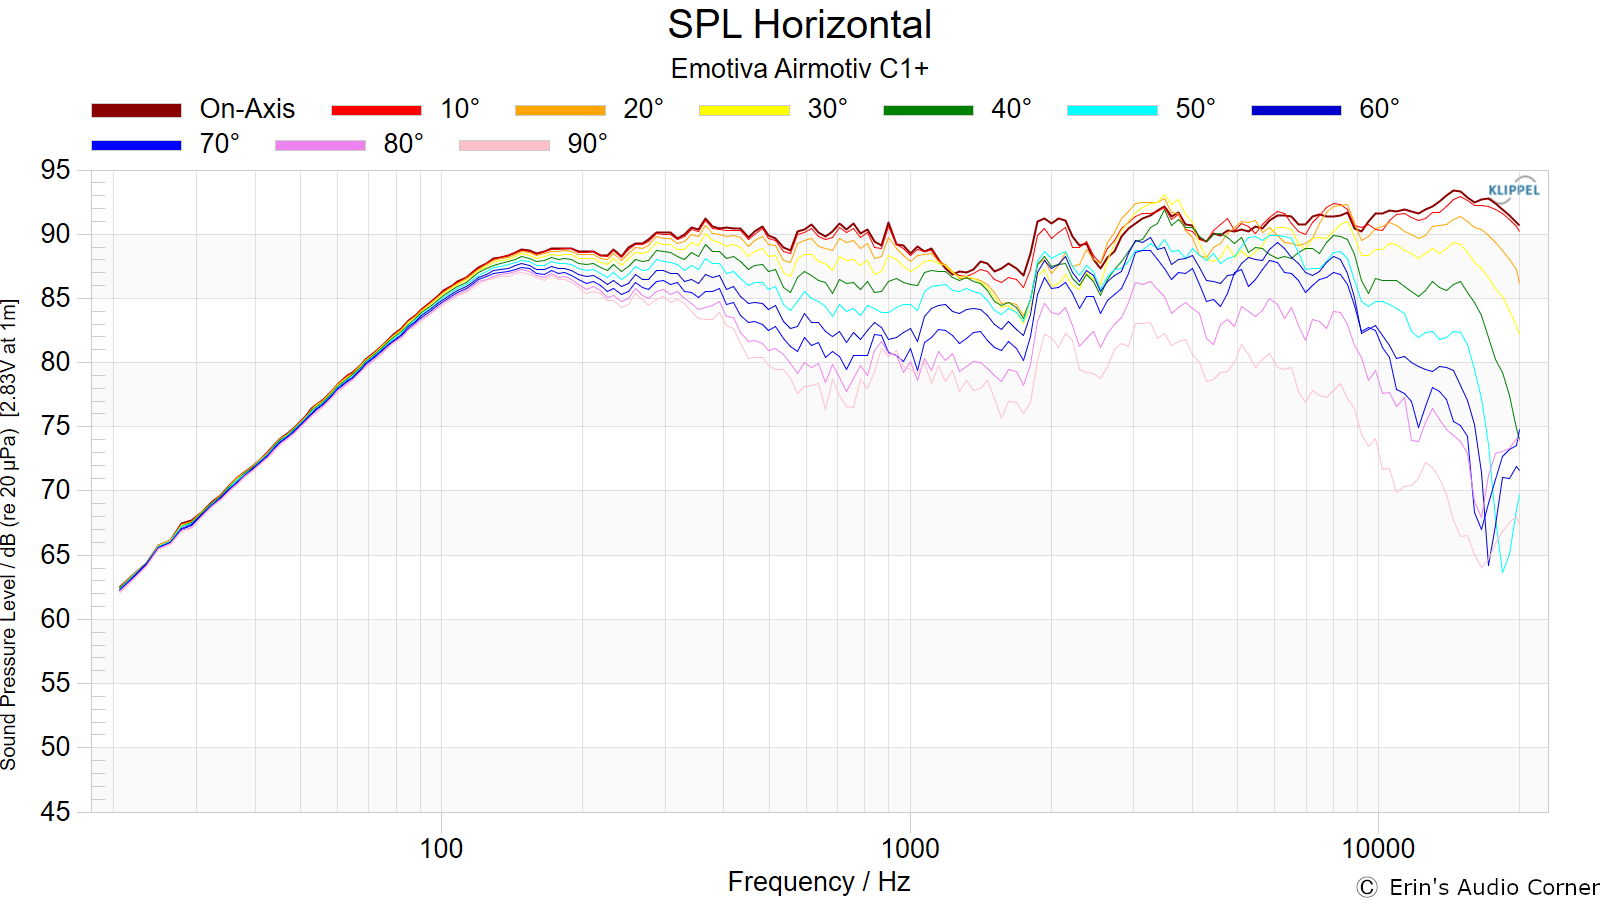
Horizontal Frequency Response (0° to ±90°):
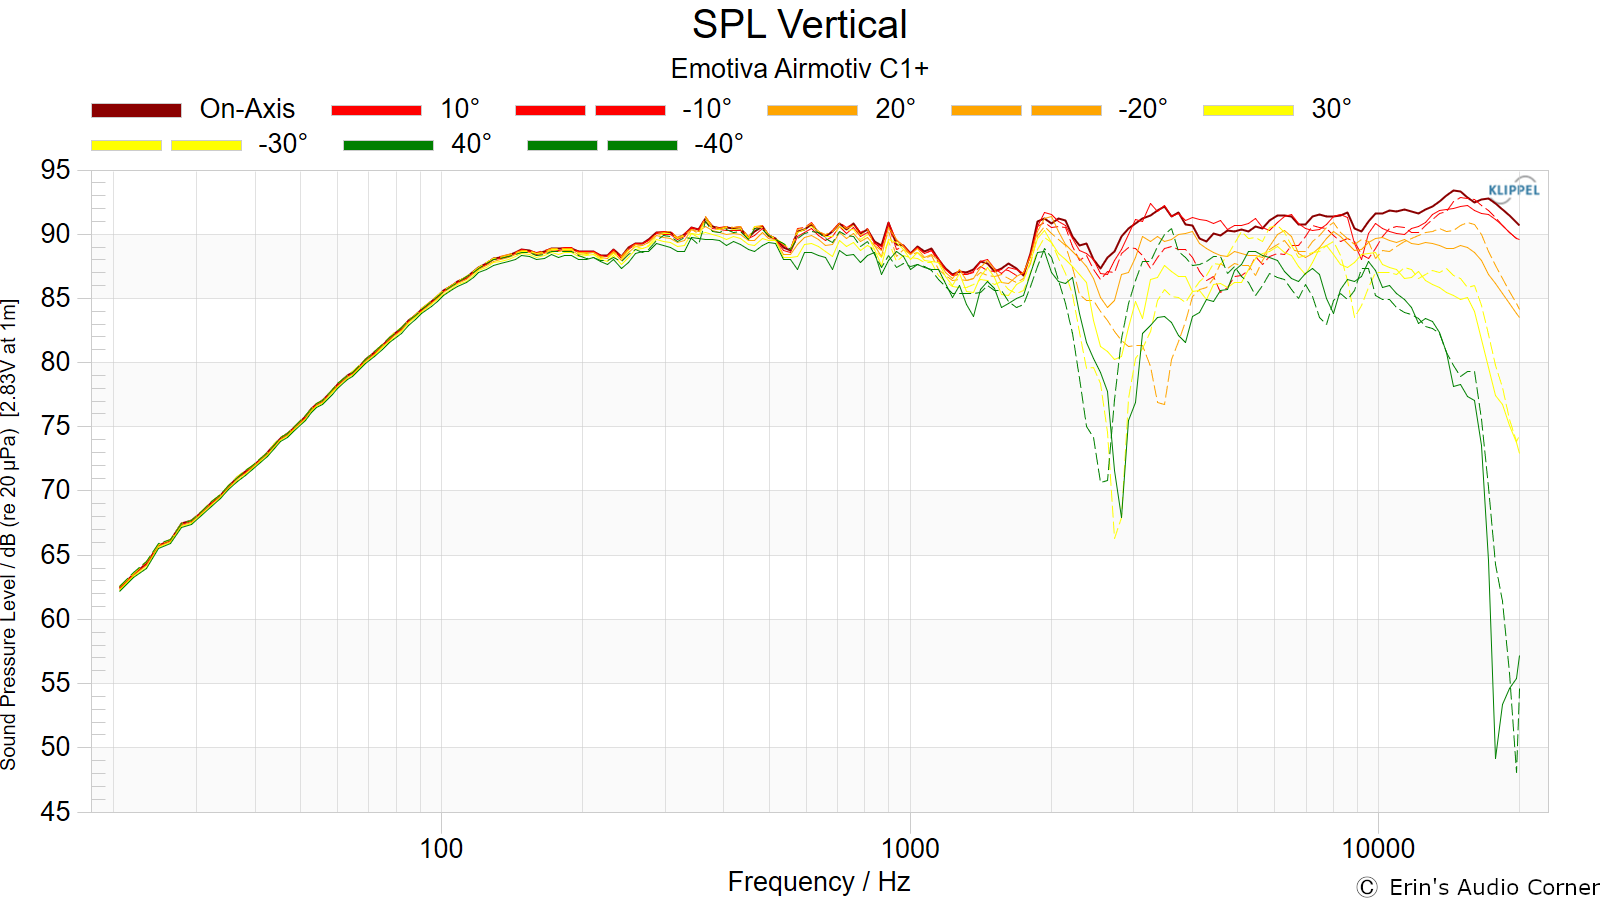
Vertical Frequency Response (0° to ±40°):
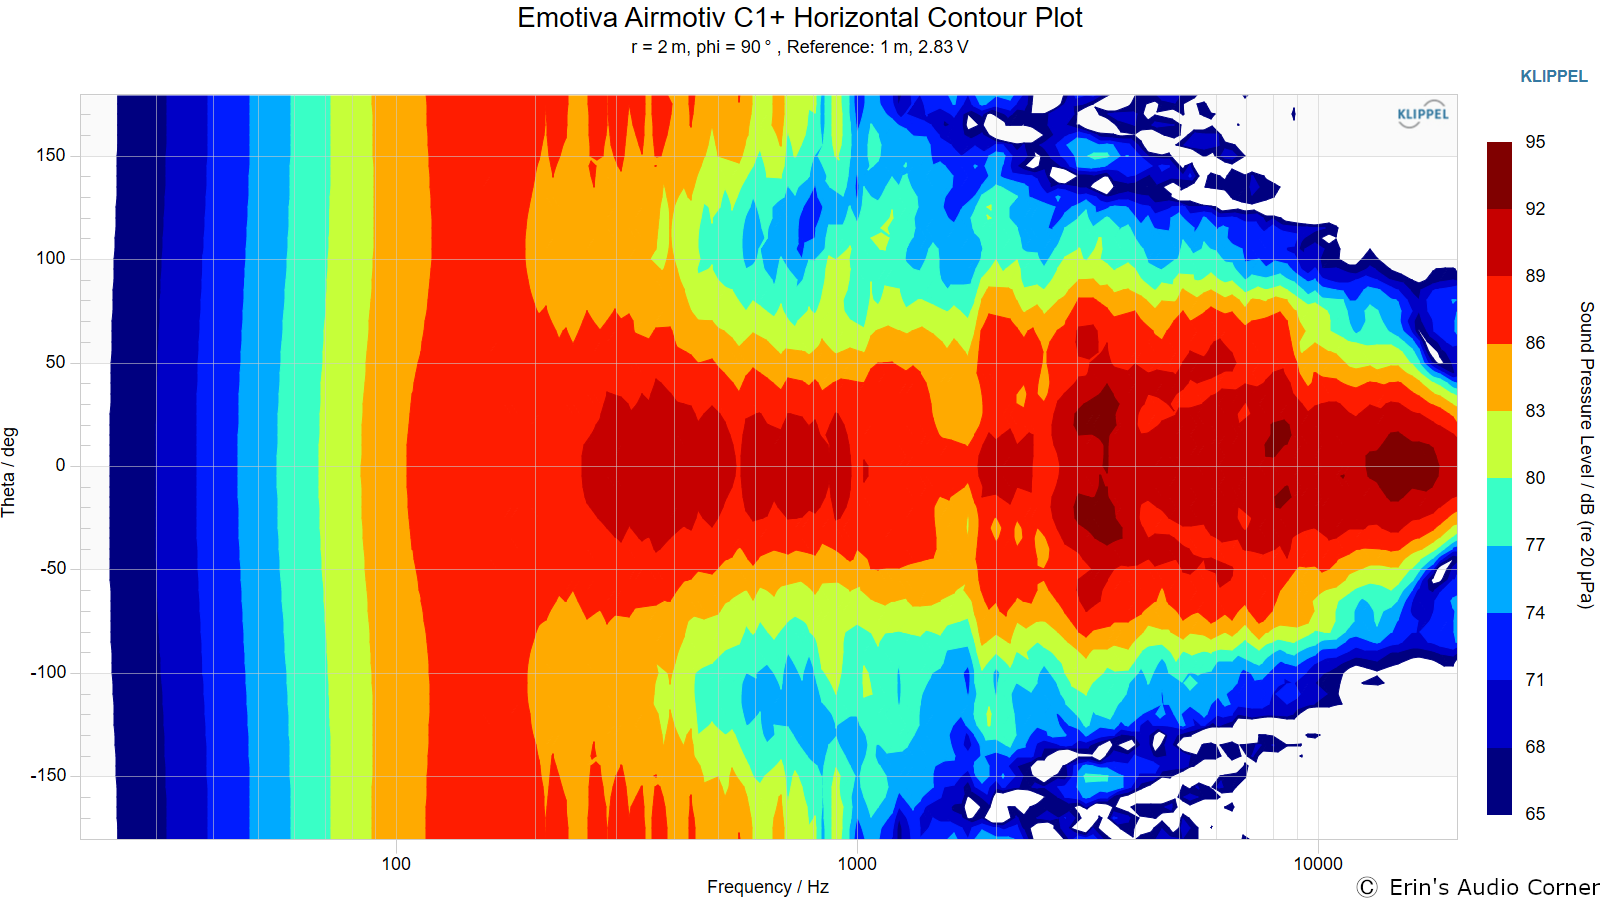
Horizontal Contour Plot (not normalized):
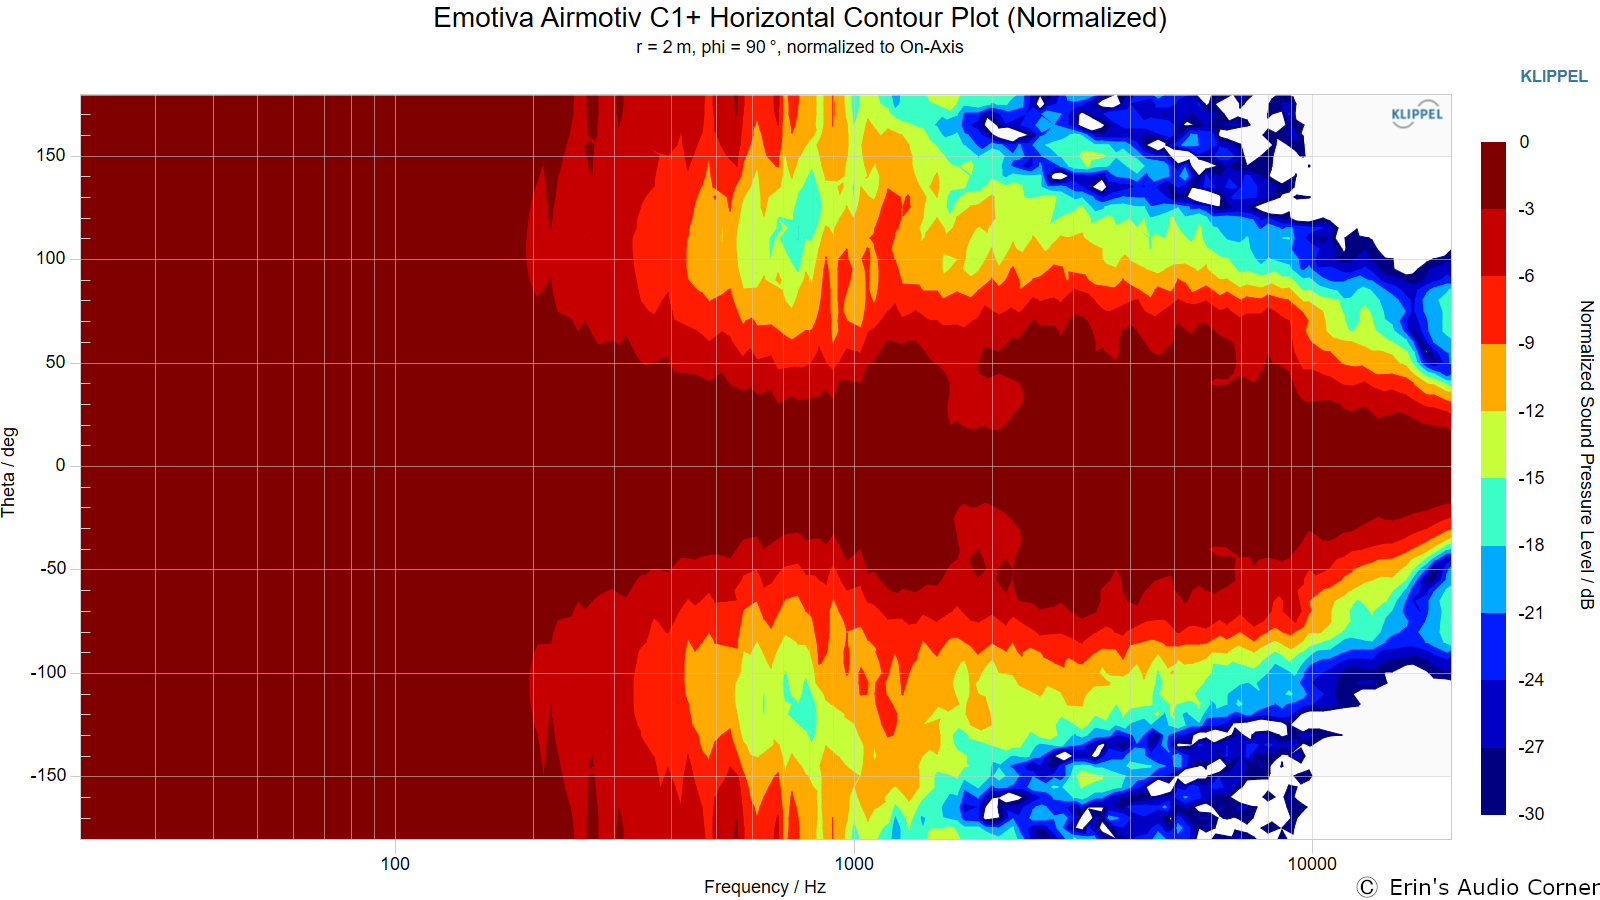
Horizontal Contour Plot (normalized):
Vertical Contour Plot (not normalized):

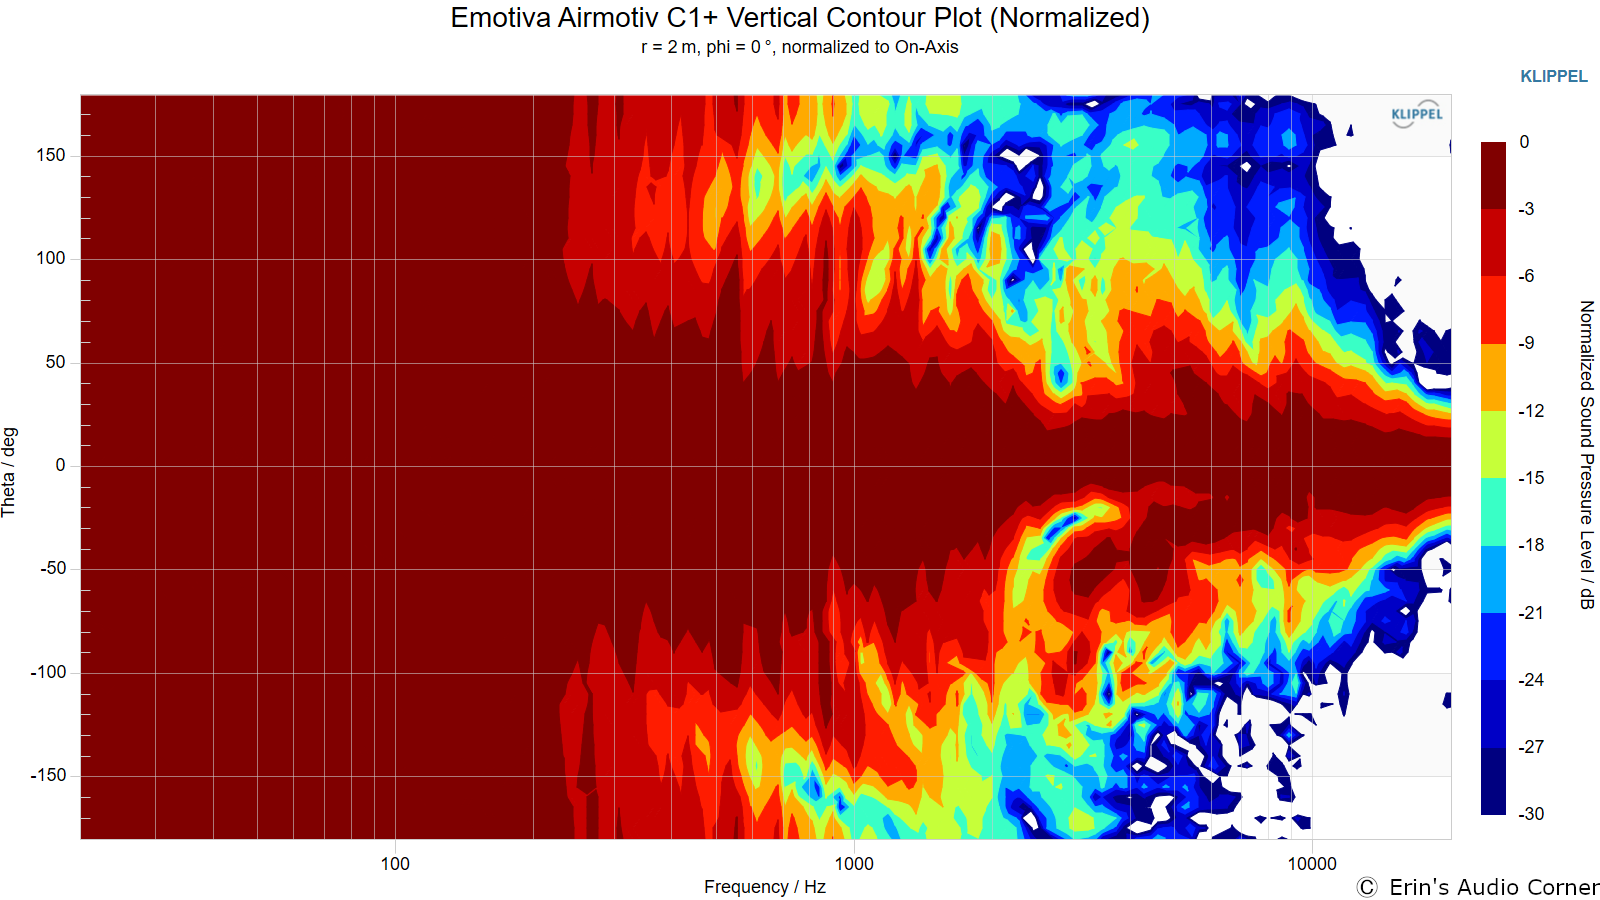
Vertical Contour Plot (normalized):
“Globe” Plots
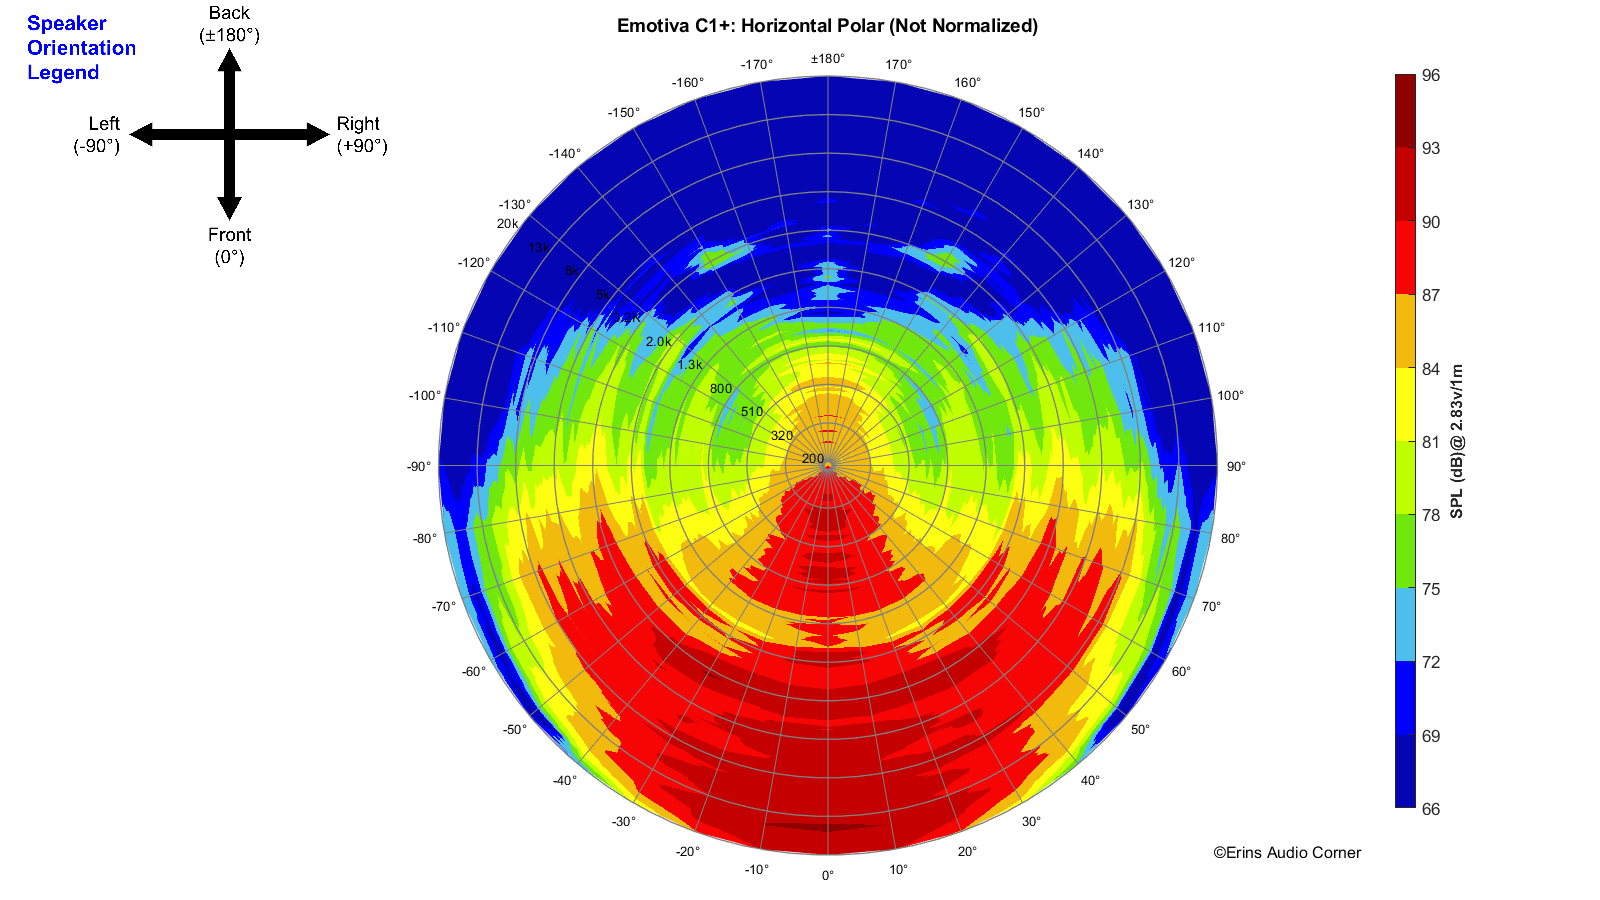
Horizontal Polar (Globe) Plot:
This represents the sound field at 2 meters - above 200Hz - per the legend in the upper left.
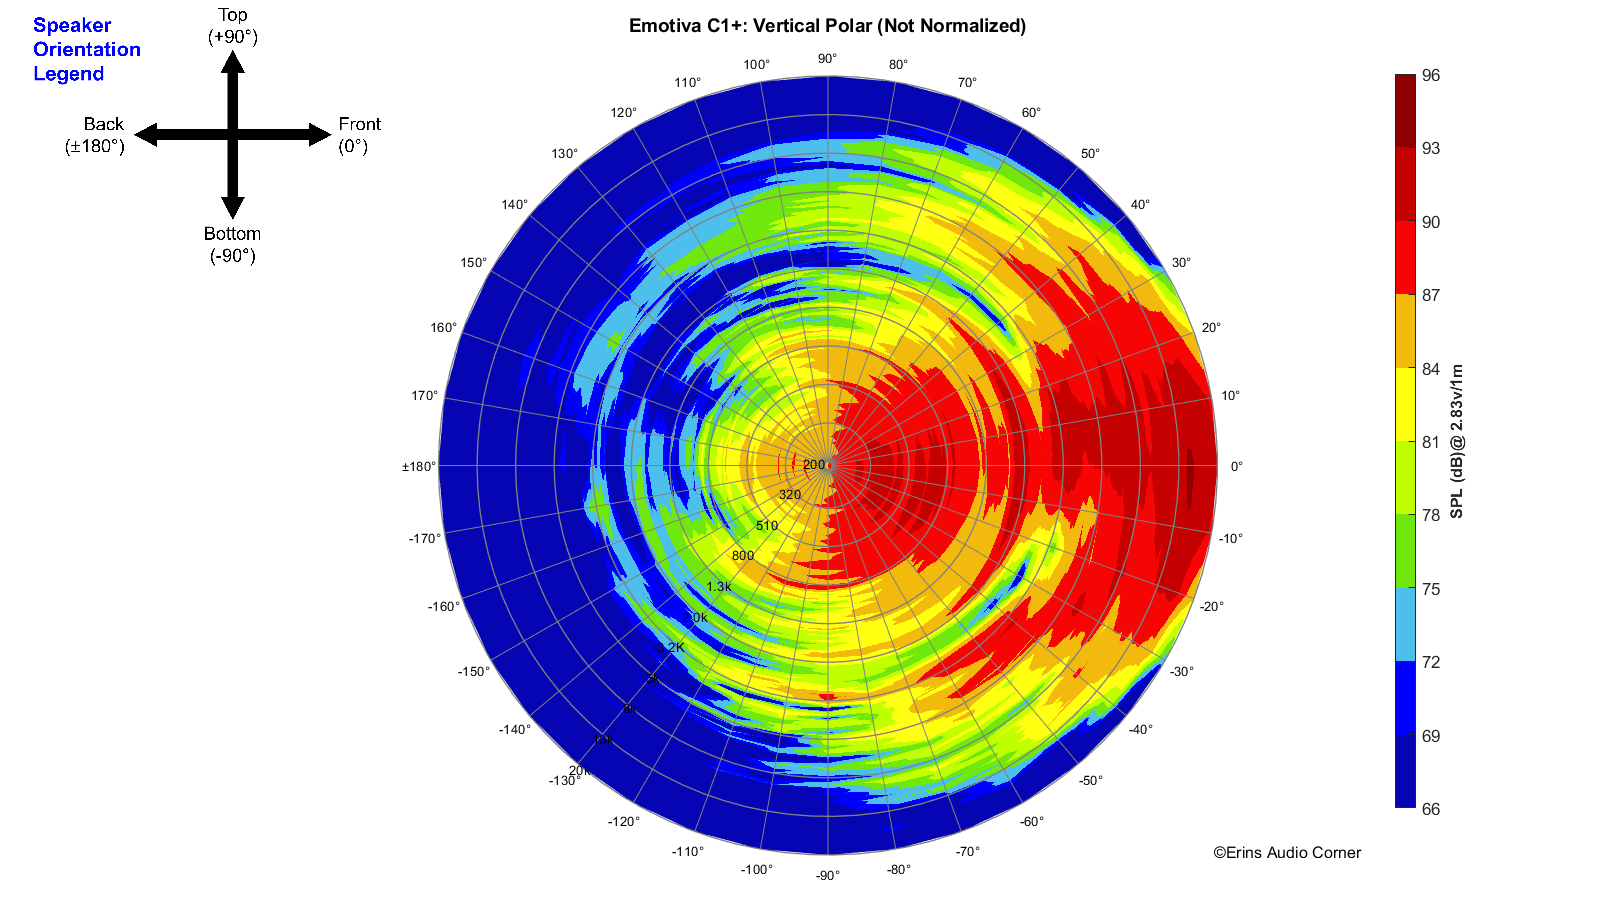
Vertical Polar (Globe) Plot:
This represents the sound field at 2 meters - above 200Hz - per the legend in the upper left.
Additional Measurements
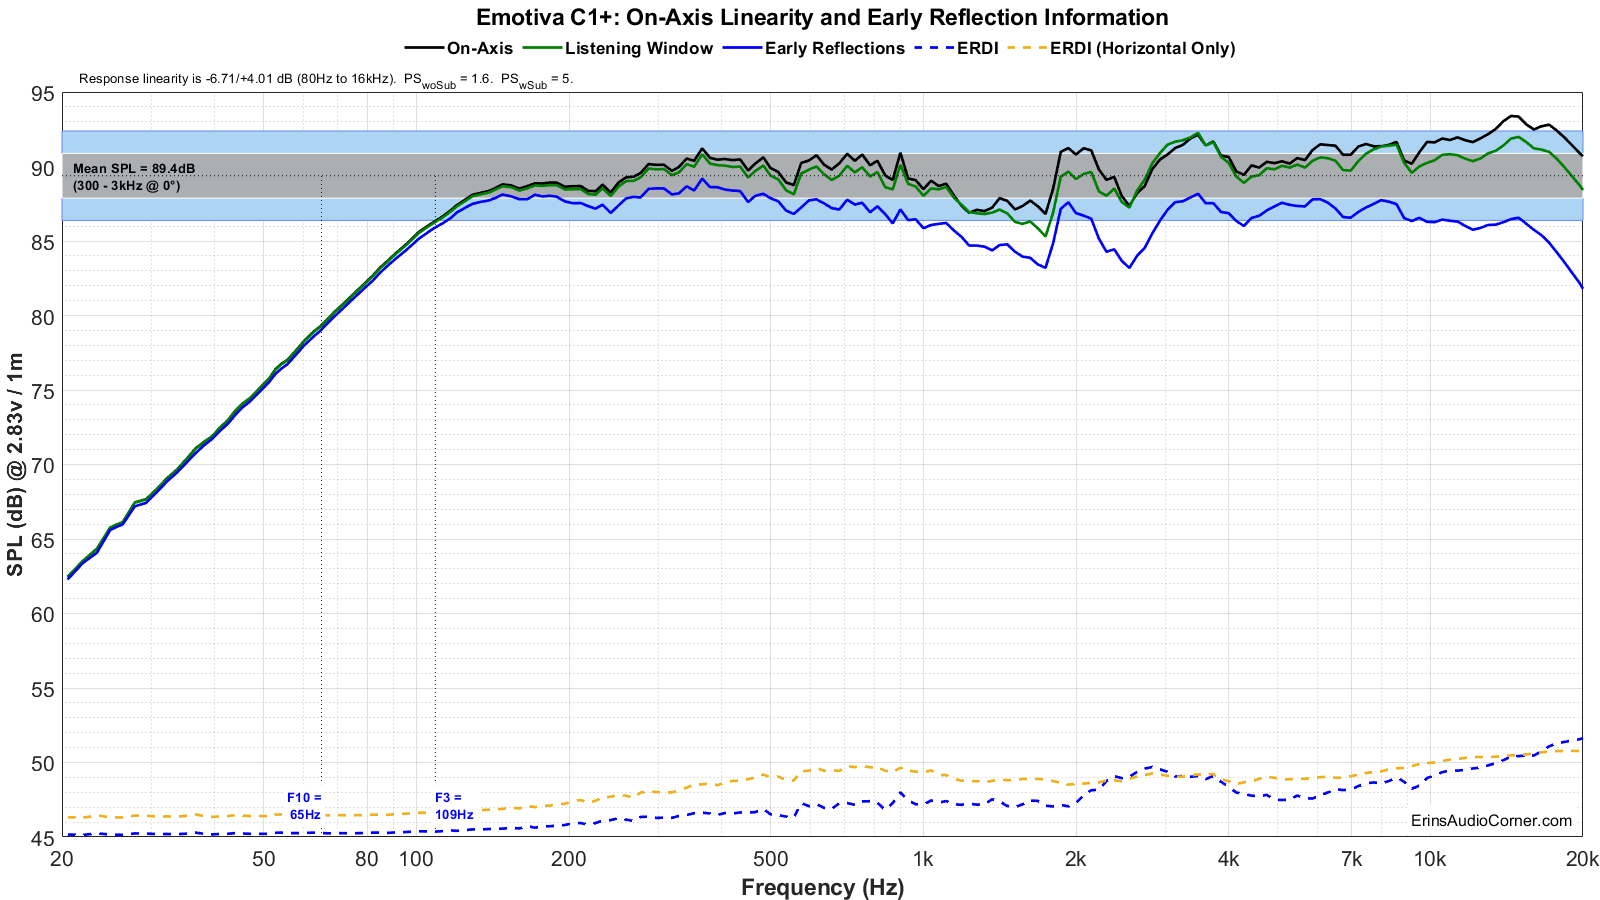
On-Axis Response Linearity
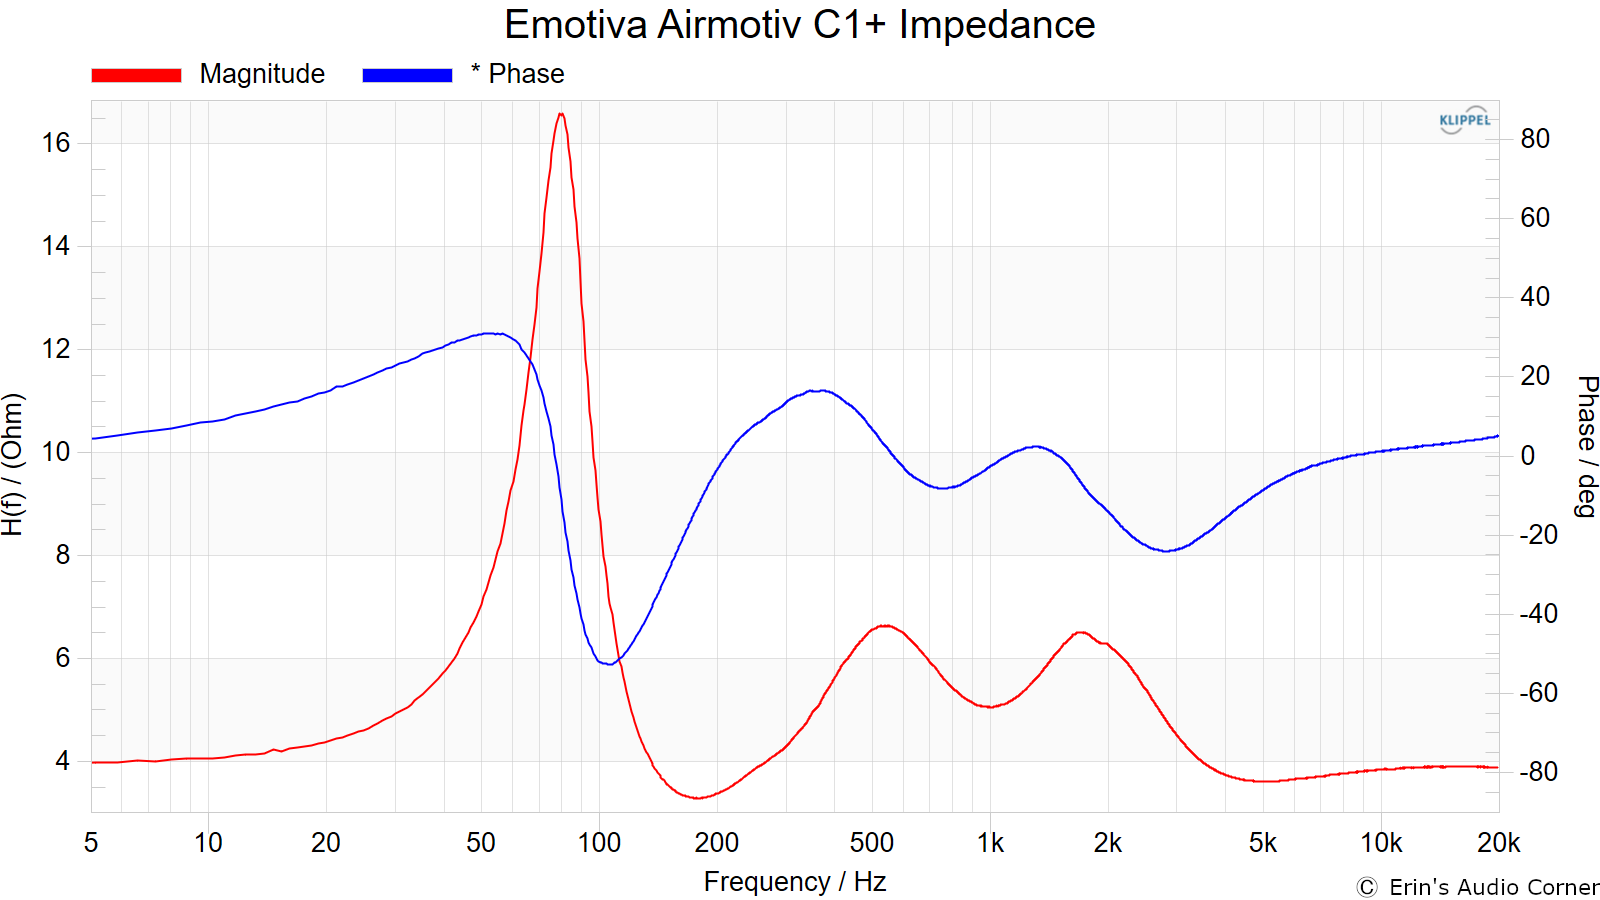
Impedance Magnitude and Phase
Harmonic Distortion
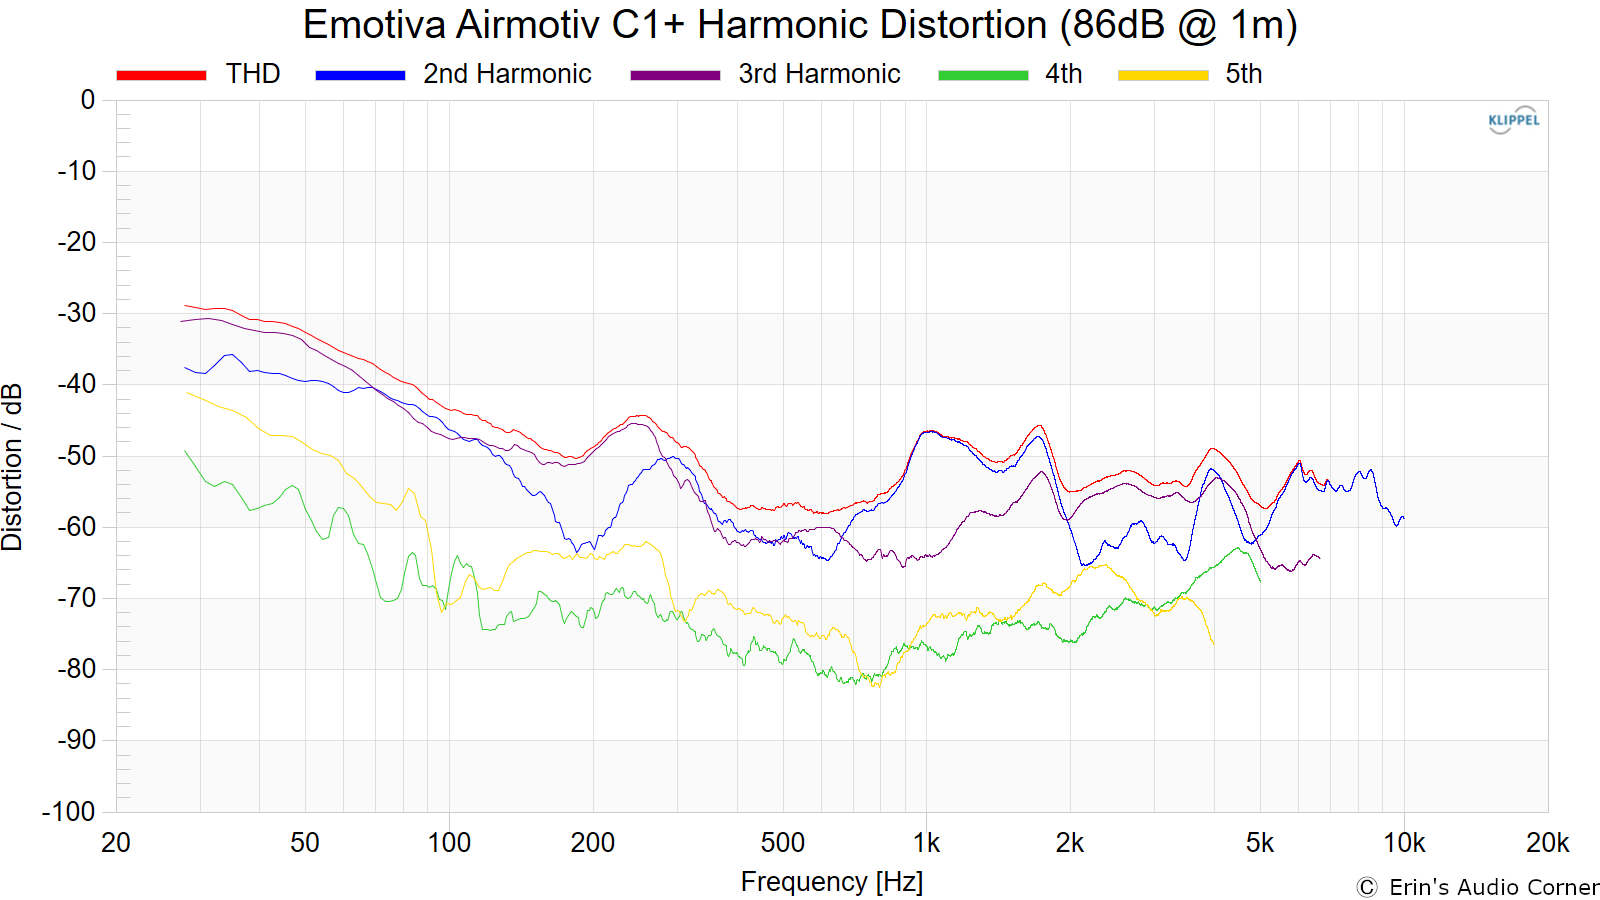
Harmonic Distortion at 86dB @ 1m:
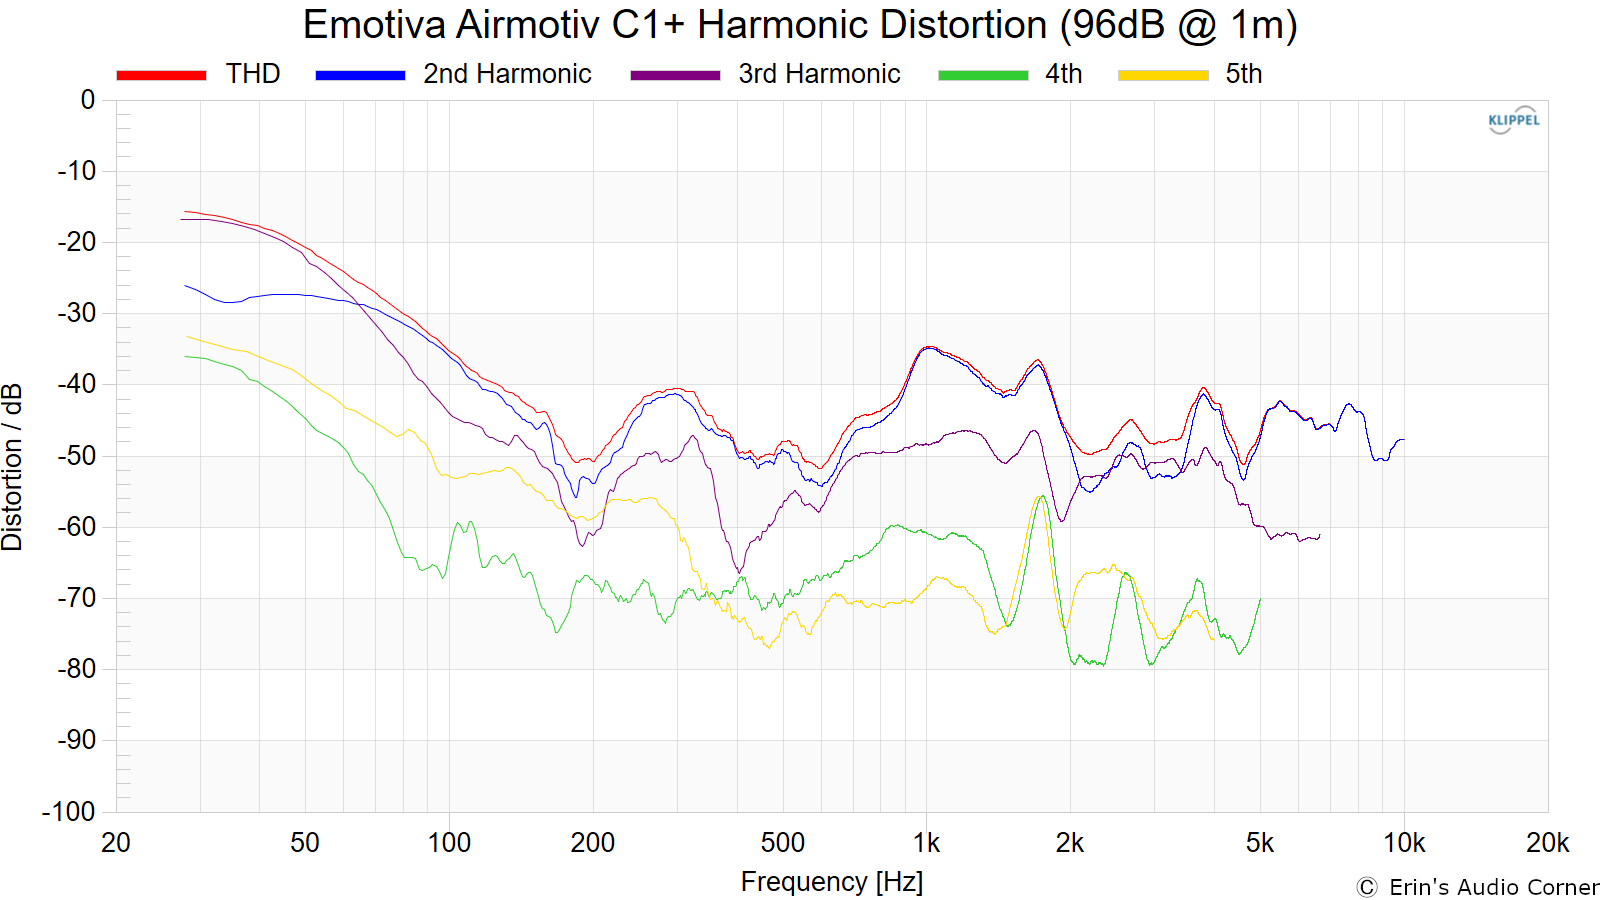
Harmonic Distortion at 96dB @ 1m:
Dynamic Range (Instantaneous Compression Test)
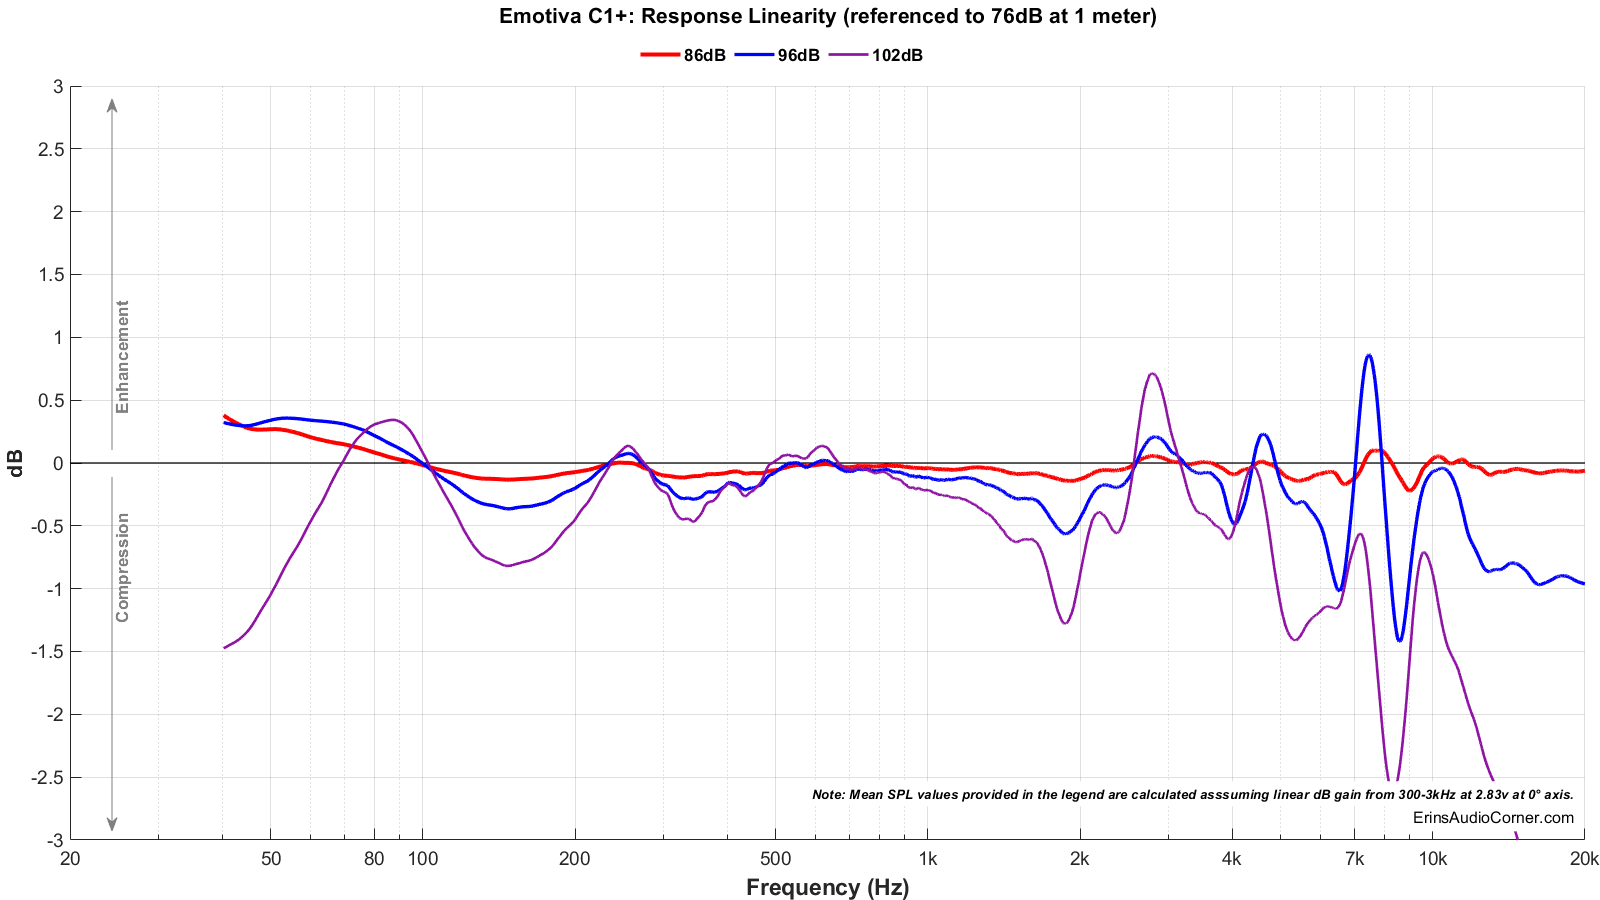
The below graphic indicates just how much SPL is lost (compression) or gained (enhancement; usually due to distortion) when the speaker is played at higher output volumes instantly via a 2.7 second logarithmic sine sweep referenced to 76dB at 1 meter. The signals are played consecutively without any additional stimulus applied. Then normalized against the 76dB result.
The tests are conducted in this fashion:
- 76dB at 1 meter (baseline; black)
- 86dB at 1 meter (red)
- 96dB at 1 meter (blue)
- 102dB at 1 meter (purple)
The purpose of this test is to illustrate how much (if at all) the output changes as a speaker’s components temperature increases (i.e., voice coils, crossover components) instantaneously.
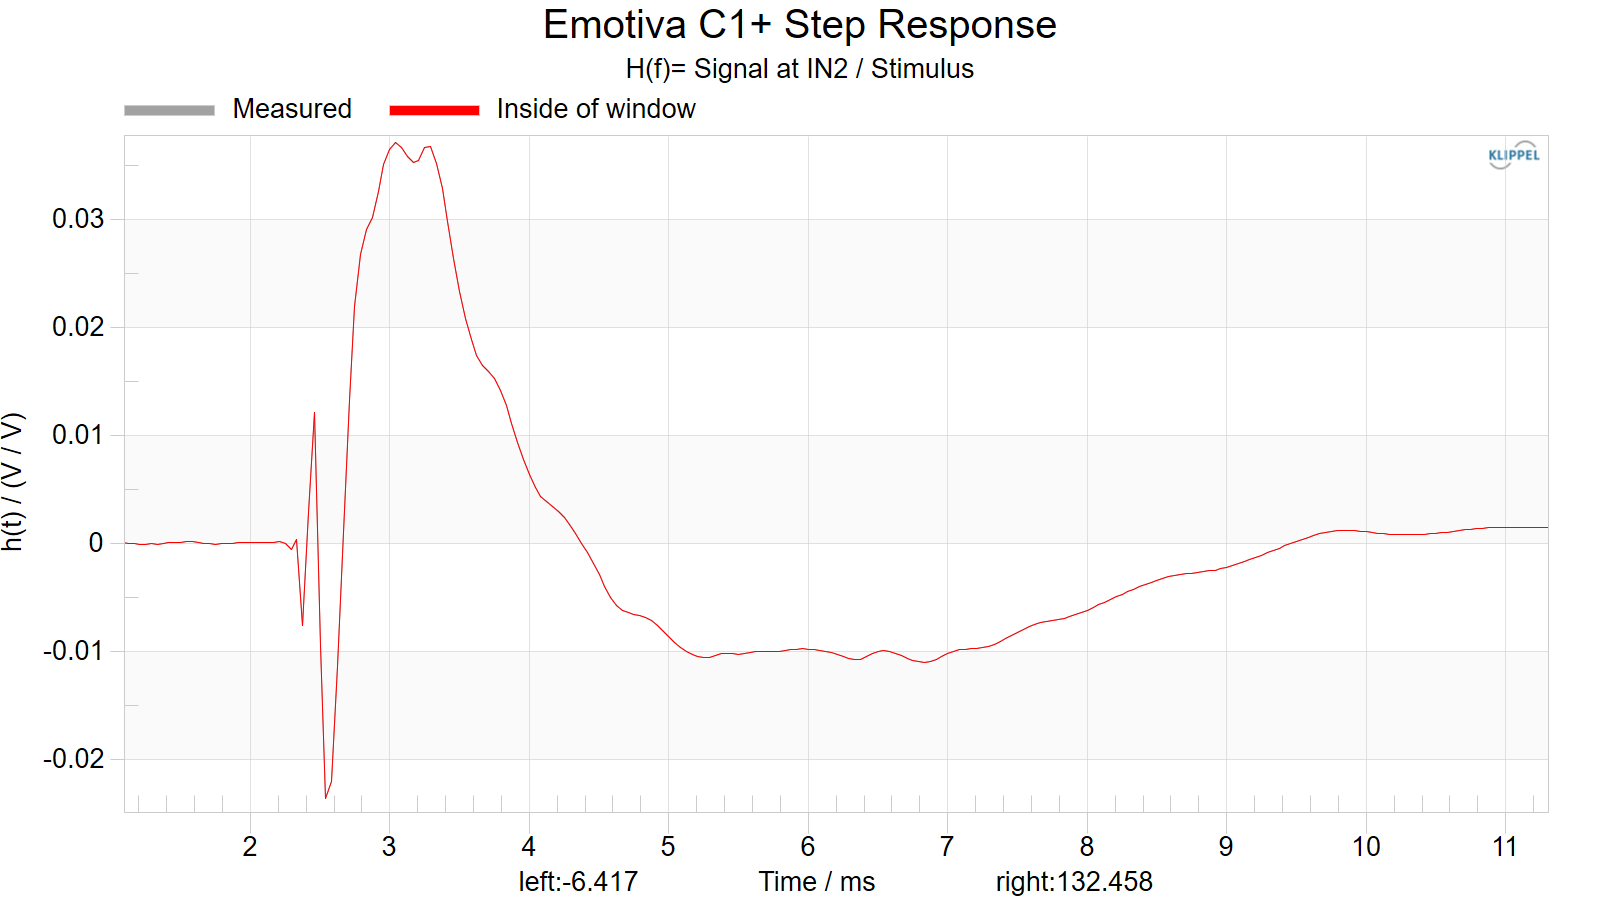
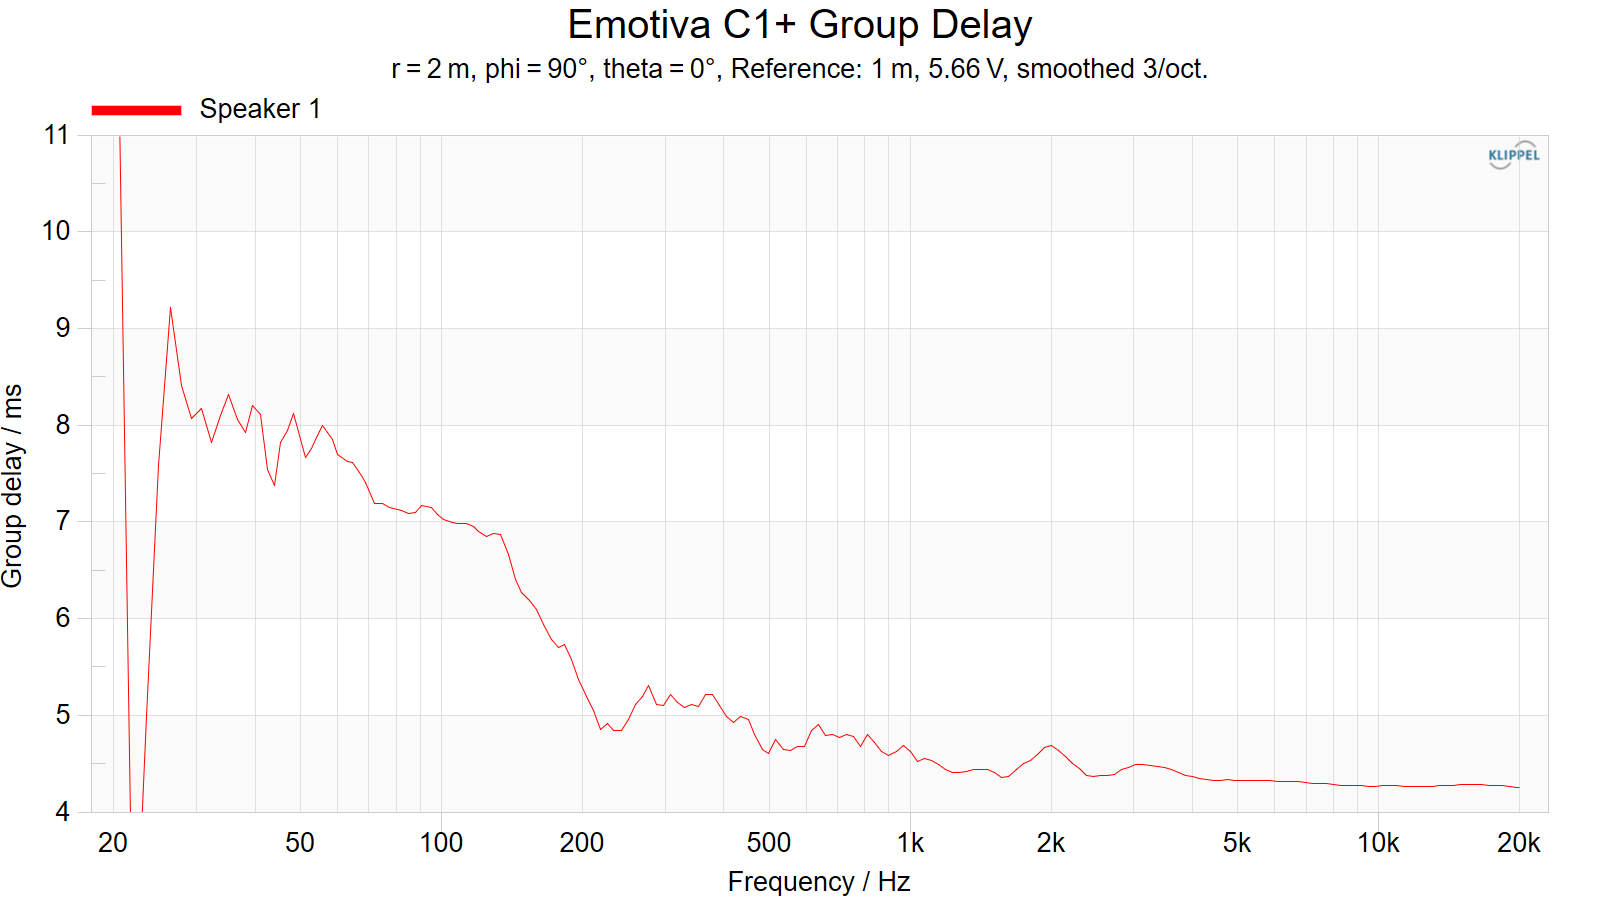
Step Response and Group Delay
Parting / Random Thoughts
If you want to see the music I use for evaluating speakers subjectively, see my Spotify playlist.
I always listen to speakers before I measure them. This ensures I am not swayed by the measurements before I listen. Listening done on-axis but I also turned the speakers to face out into the room as well. I found on-axis to provide the best overall response. Listening volume between 80-95dB at 4m.
- Good sensitivity at 89.4dB @ 2.83v/1m. Which, interestingly, is the exact same average sensitivity I measured with the C2+. Go figure!
- Linearity shows some issues. Namely, it suffers due to some odd behavior from 1-3kHz. Partly due to the CTC spacing between the midwoofers and partly due to diffraction. There is also a HF boost which is found in all the other Emotiva speakers using this tweeter. It resulted in the speaker sounding treble heavy which needed to be remedied via EQ for me to enjoy the speaker.
- F3 is higher than I’d have expected for its size so make sure you have a subwoofer that you can use to take the pressure off this speaker.
- Beamwidth is about ±40-50° through the midrange so not much of an issue with off-axis seating except for the 1.5-2kHz region where the beamwidth narrows very quickly.
- Output wrt distortion is good through the midrange but does show quickly increasing distortion below 100Hz. This is understood, though, as the response of the speaker is already falling off at 12dB/octave below this frequency. Again, use a subwoofer.
- Compression is all over the map here. The HF compression is really wonky; similar to what we saw in the C2+ speaker though maybe a bit worse, depending on what frequency/SPL you are evaluating.
I was really curious to see how this speaker sounded and measured compared to the Emotiva C2+ which I tested previously (link). There were some pretty clear issues with the C2+ in regard to its horizontal radiation pattern which result in a narrow pattern through the midrange. I attributed that to the distance of the side woofers and partly to the dual mids. I expected the C1+ would fare better. That does seem to be the case. Although, the response linearity itself does have irreparable issues which EQ cannot remedy. I think a few modifications would help this speaker a good deal. For example, a steeper crossover slope on the woofers would clean up the directivity mismatch in the midrange and imrpove the overall response.
As stated in the Foreword, this written review is purposely a cliff’s notes version. For more details about the performance (objectively and subjectively) please watch the YouTube video.
Support the Cause
If you like what you see here and want to help support the cause there are a few ways you can do so: Become a Patron!
Or using my affiliate link which helps me gain a small commission at no additional cost to you.
Your support helps me pay for new items to test, hardware, miscellaneous items and costs of the site’s server space and bandwidth and is very much appreciated.
You can also join my Facebook and YouTube pages if you’d like to follow along with updates.