Foreword / YouTube Video Review
The review on this website is a brief overview and summary of the objective performance of this speaker. It is not intended to be a deep dive. Moreso, this is information for those who prefer “just the facts” and prefer to have the data without the filler. Discussion about the data and my subjective thoughts can be found in my video below.
For a primer on what the data means, please watch my series of videos where I provide in-depth discussion and examples of how to read the graphics presented hereon.
Information and Photos
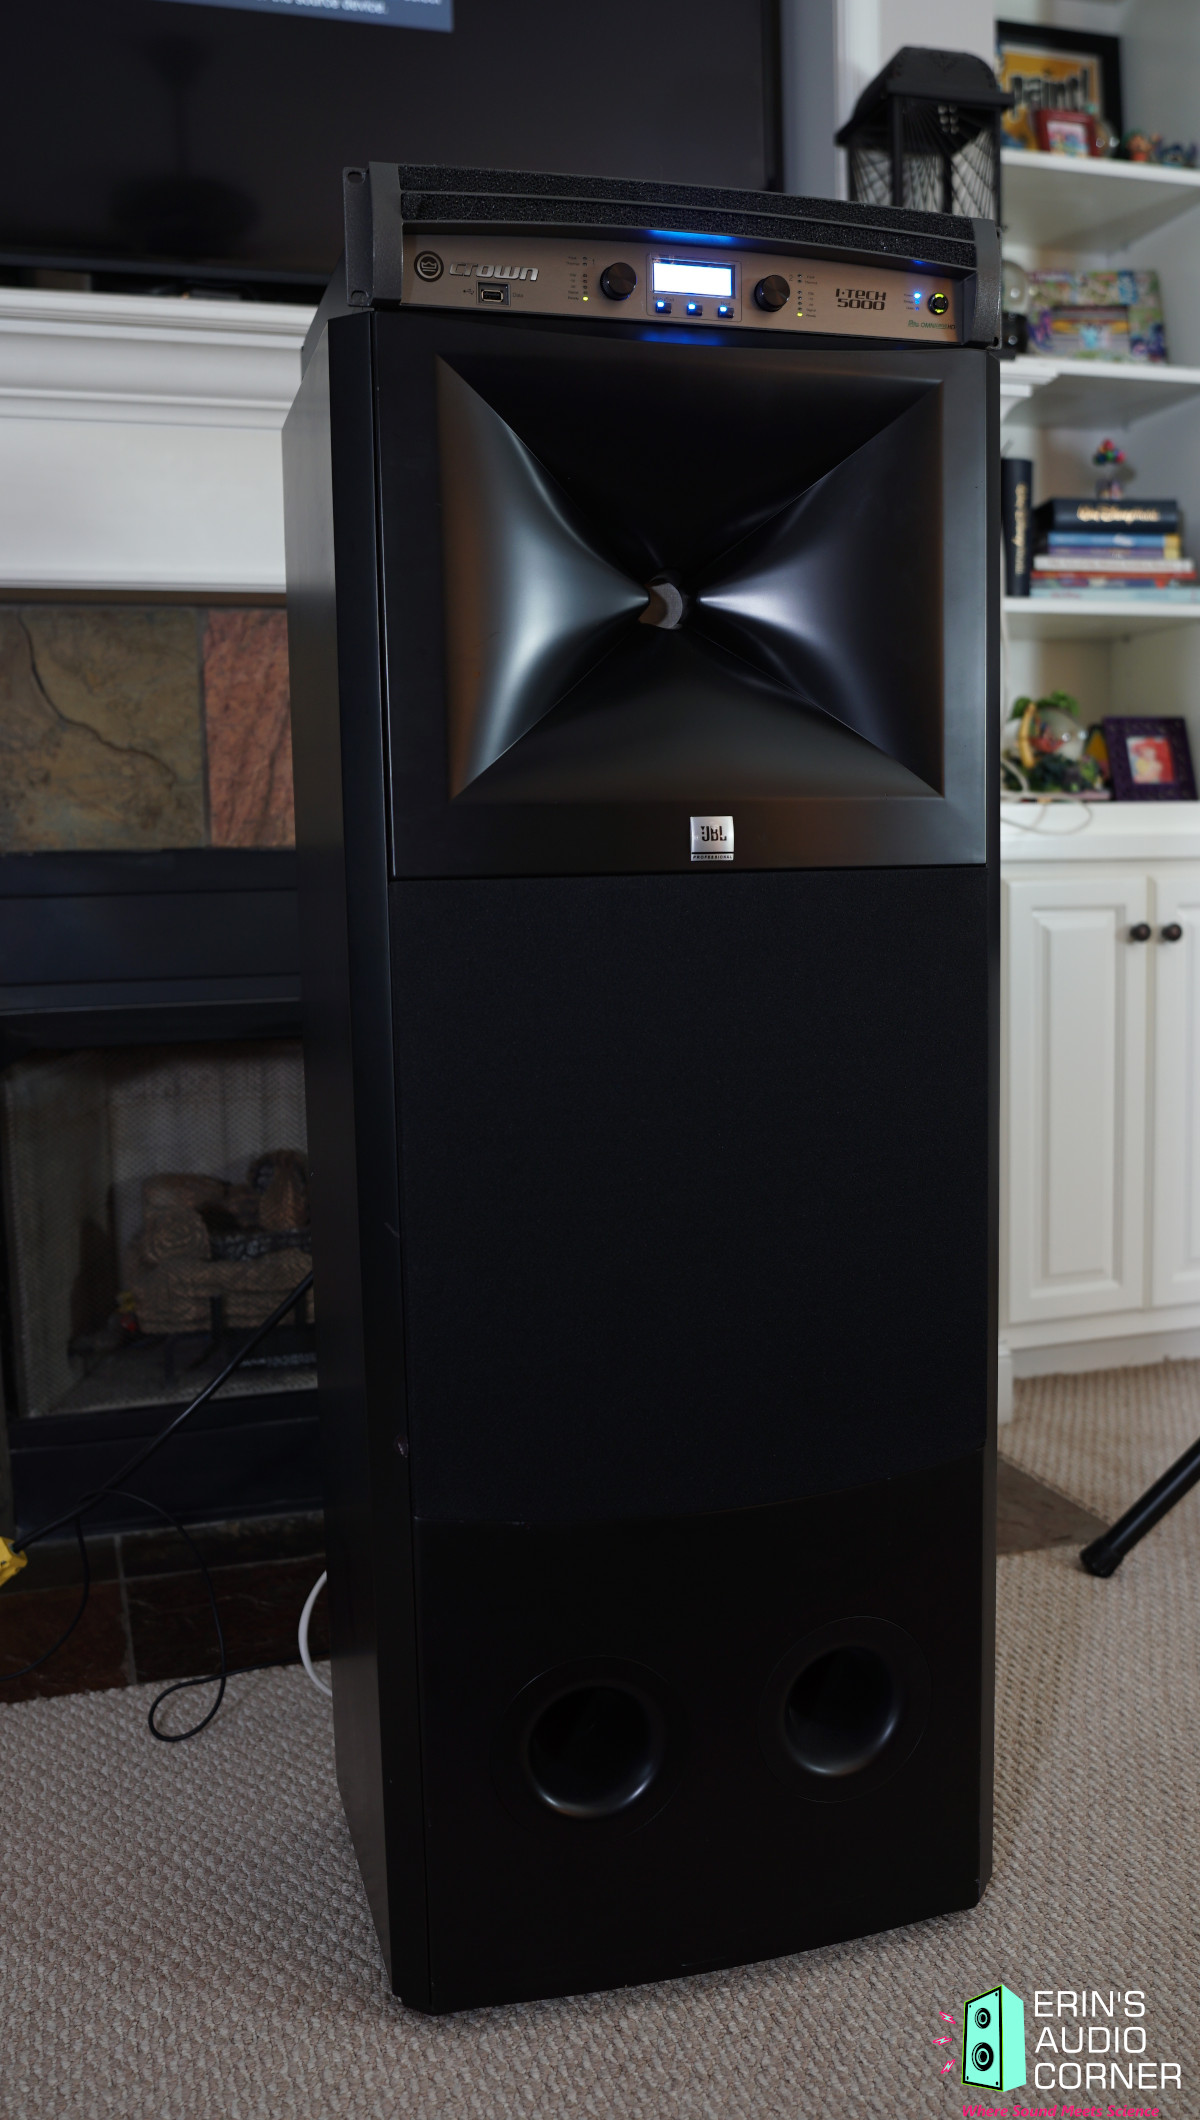
Note: This speaker was loaned to me by a fellow enthusiast who drove about 2.5 hours one-way and helped me set the speaker on the Klippel stand. In my testing I used the matching Crown I-Tech 5000HD amplifier with the “JBL M2 Base Config” loaded into the DSP section. Unfortunately, the owner was only able to load one speaker in his vehicle and therefore my listening was limited to mono. But, hey, at least we have independent data on this beast of a speaker and that’s what really matters.
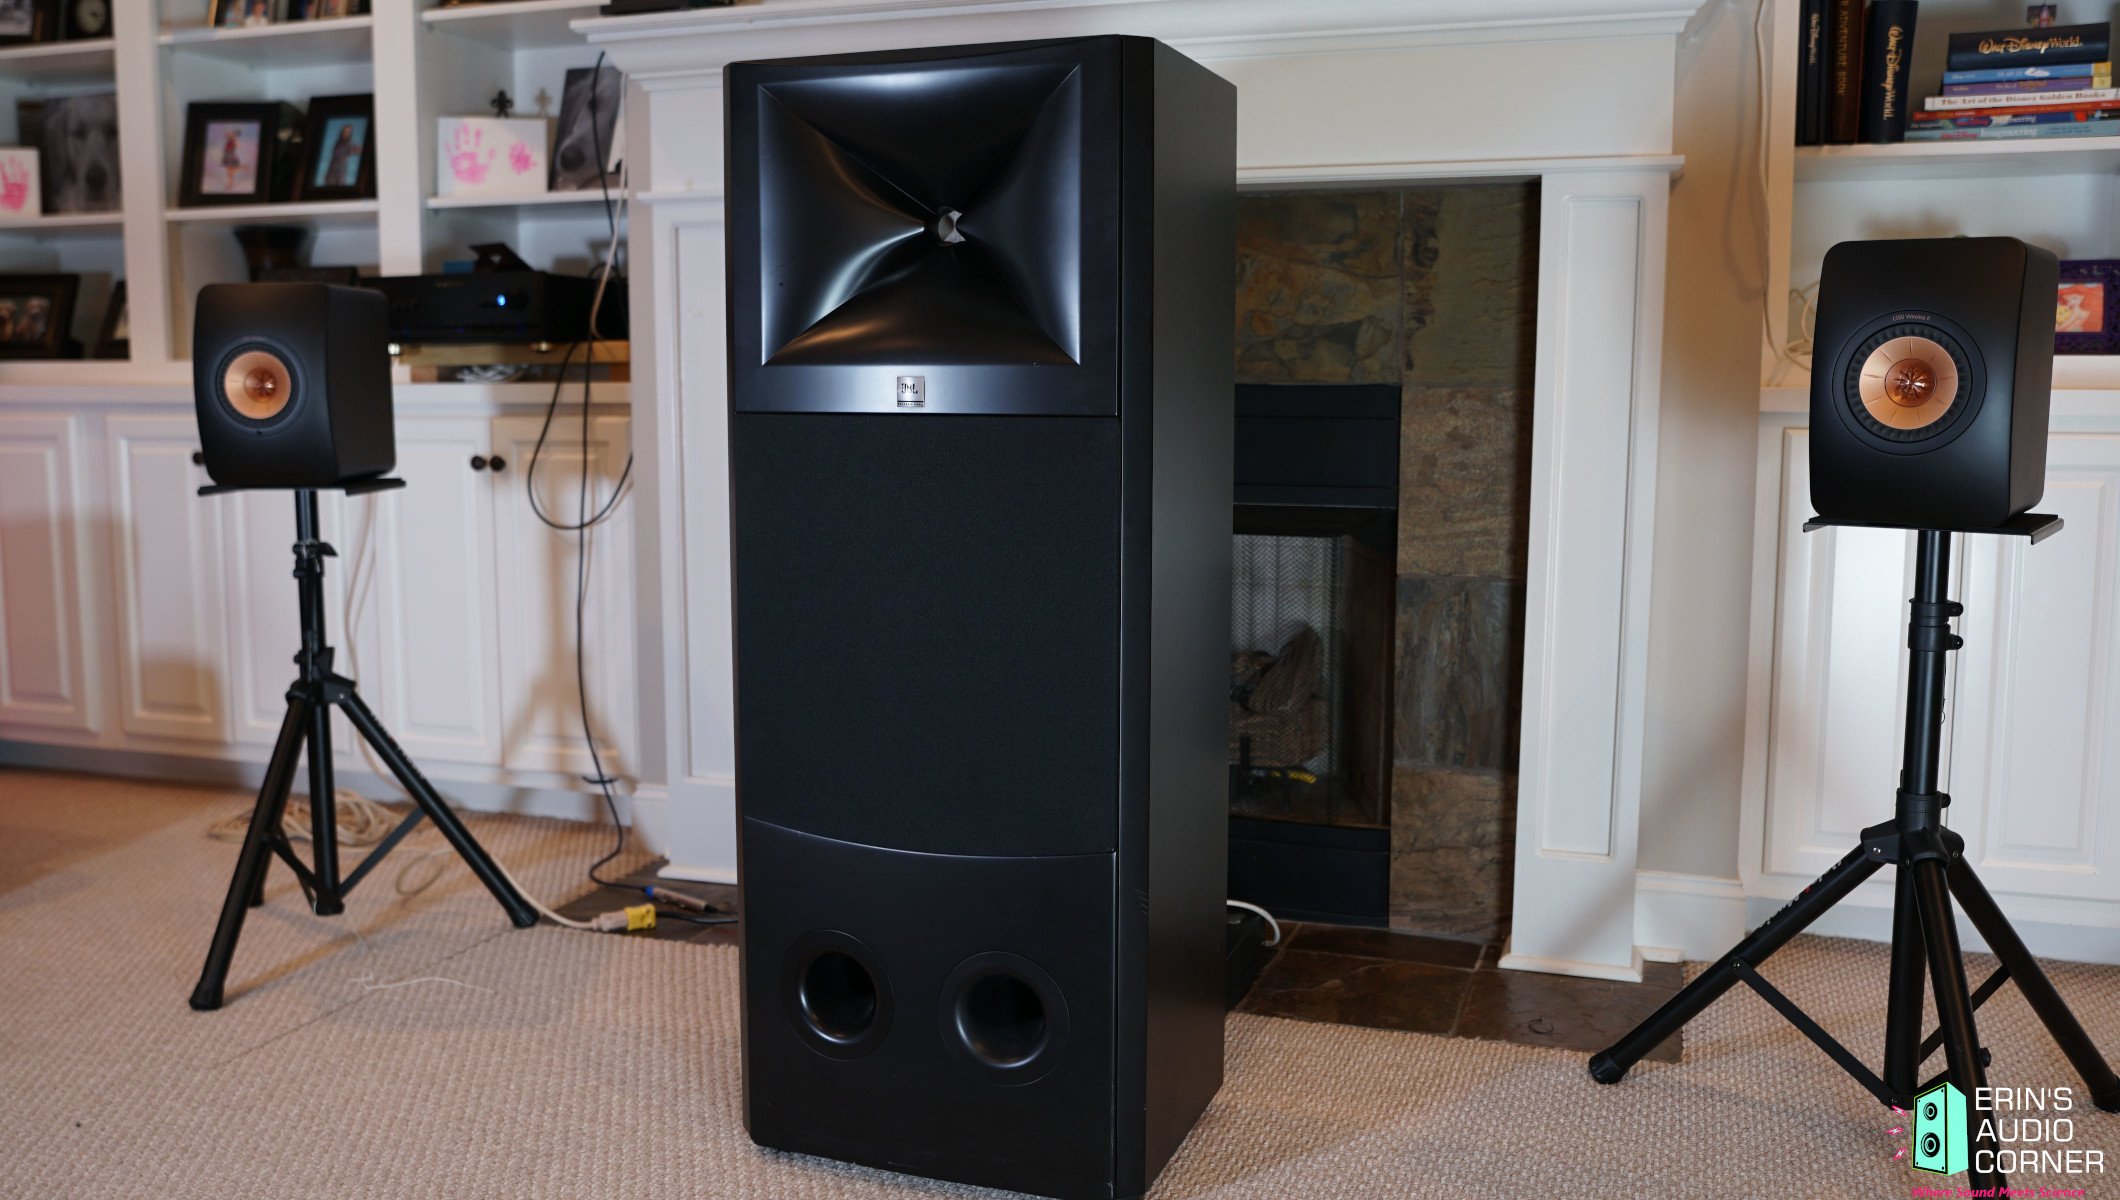
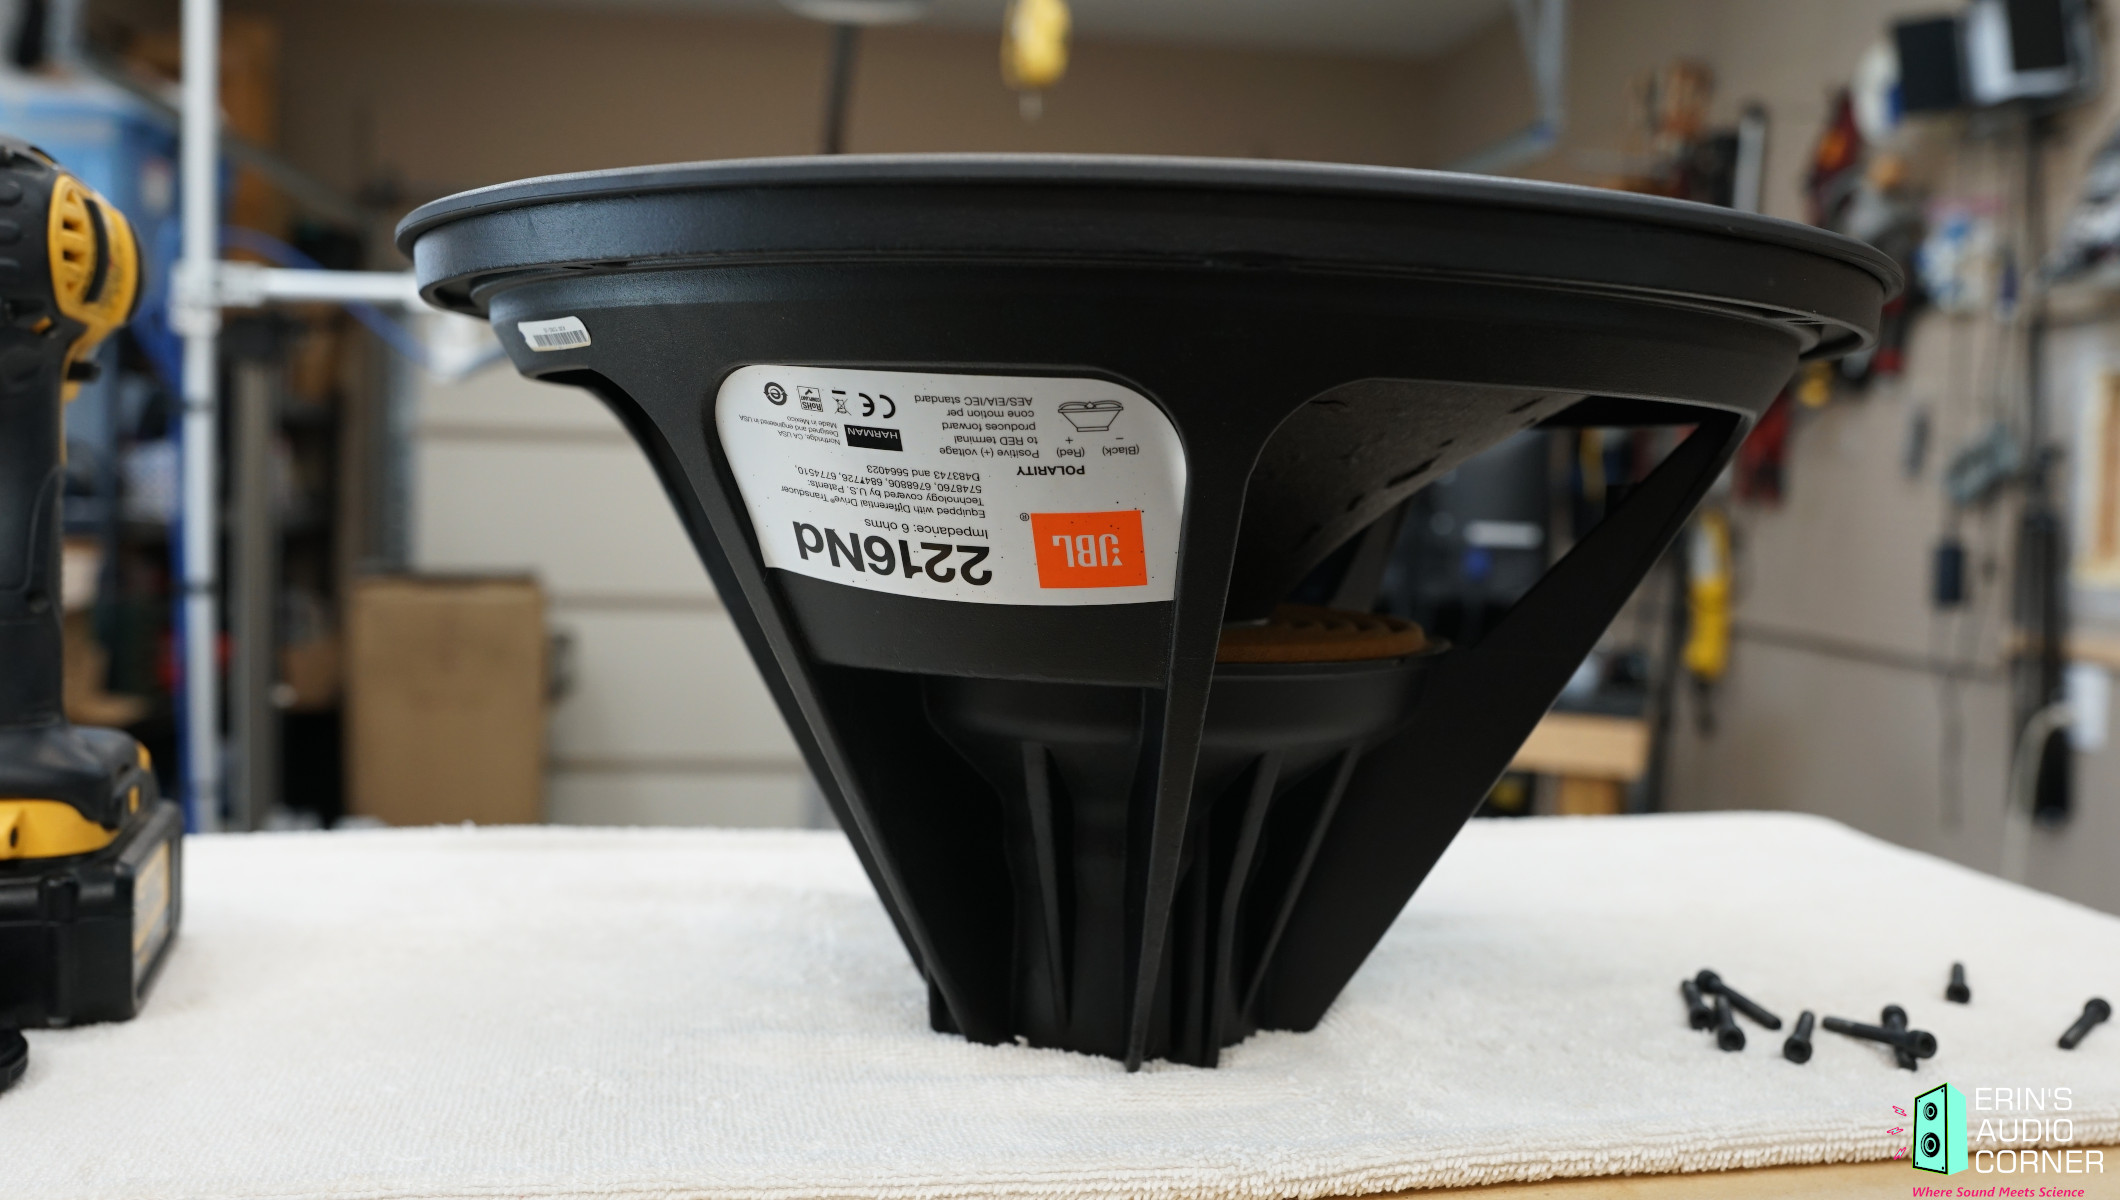
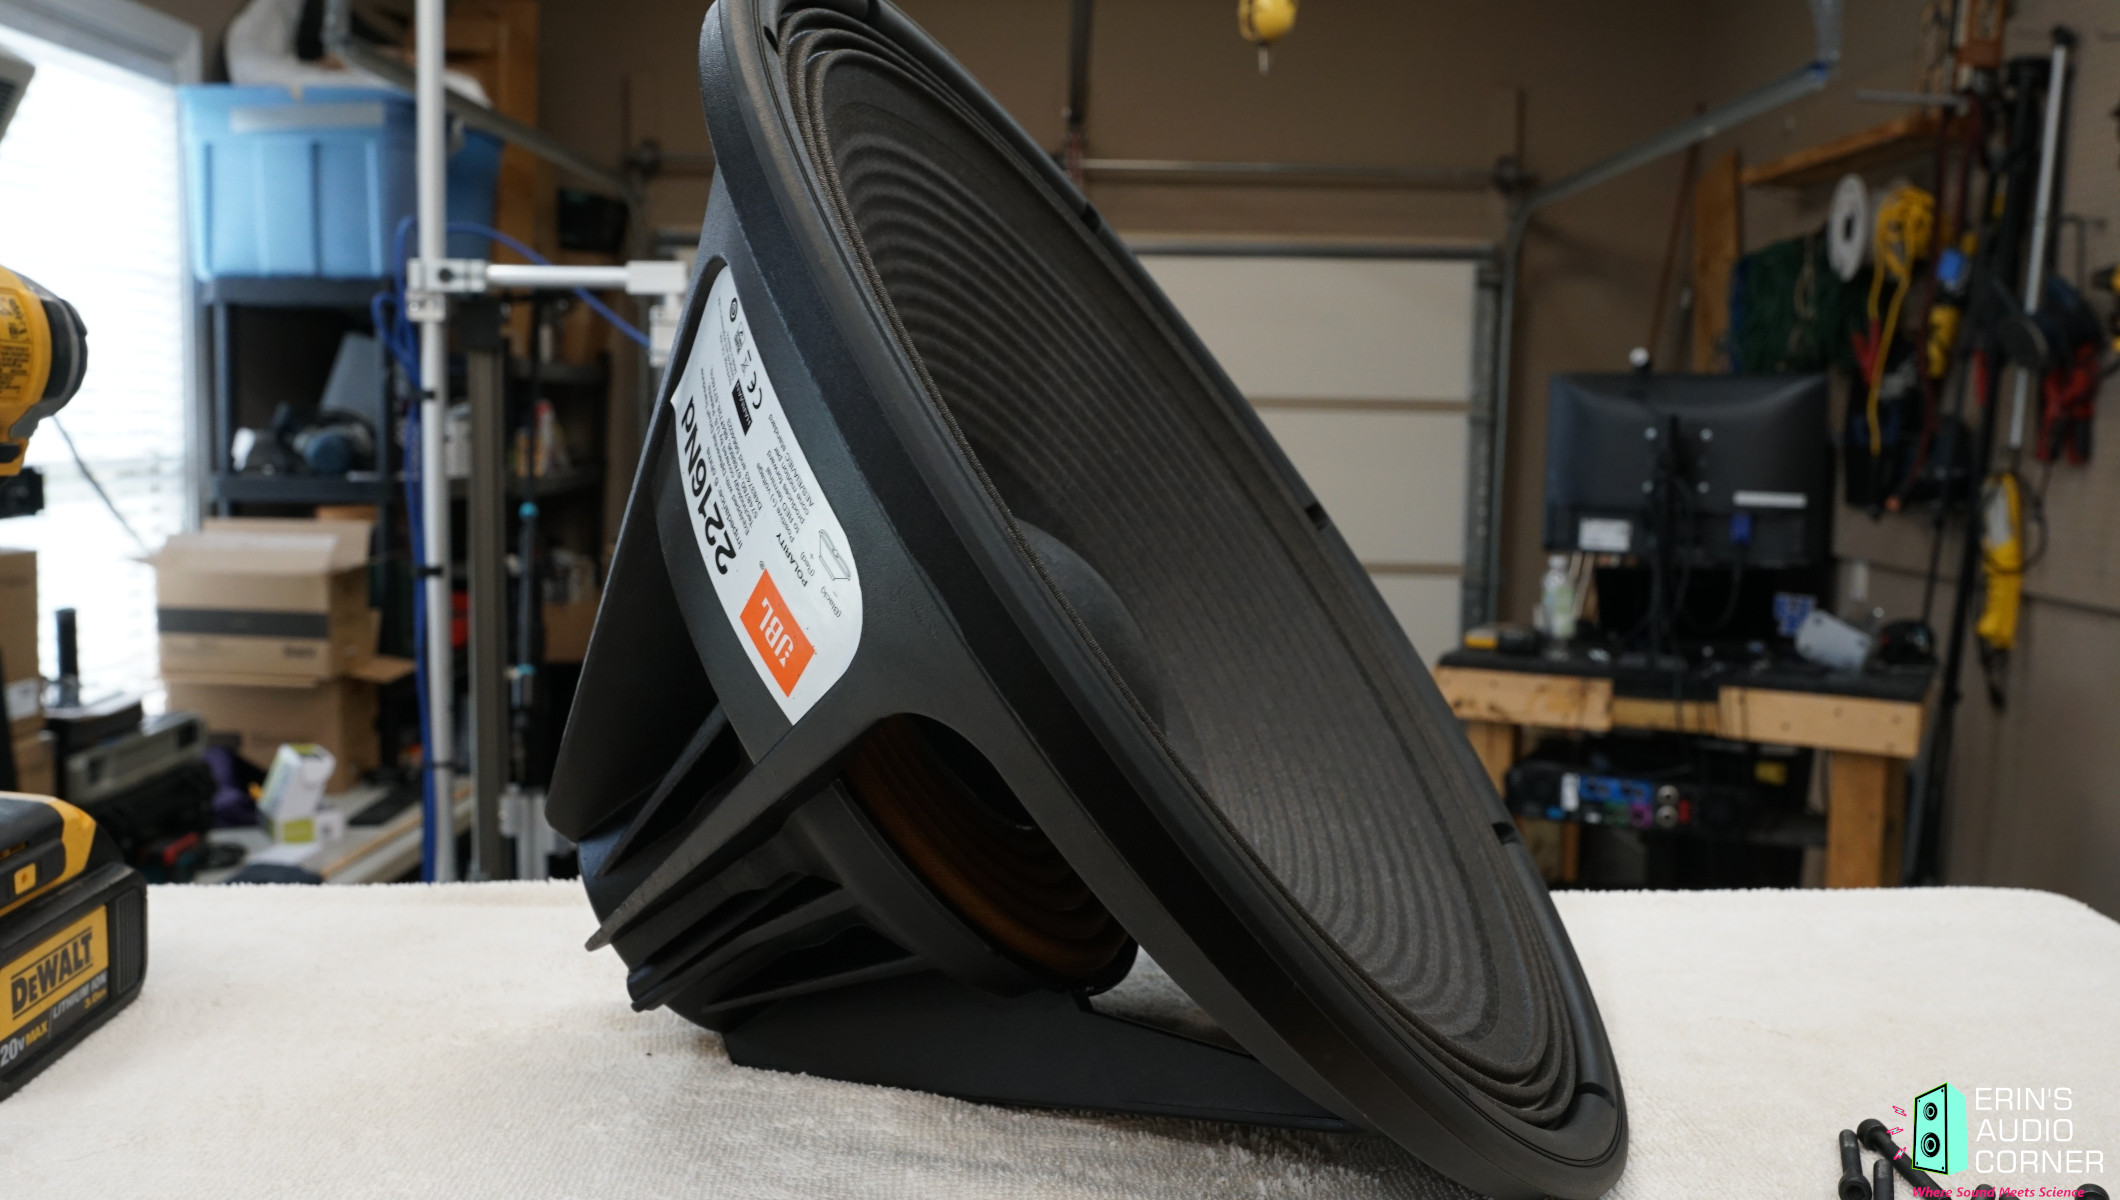
The JBL M2 is the flagship speaker from JBL’s professional line. It is a quasi-active* 2-way system that consists of JBL’s D2 compression driver in their “IMAGE CONTROL WAVEGUIDE” and 15-inch 2216Nd midwoofer with an acoustical crossover point of 800Hz between the two. This is a large and heavy speaker (130 lbs.).
*The tweeter and woofer are powered independently, however, the tweeter does incorporate a passive network to both pad the level down to match the woofer and provide some protection against turn-on pops and the like.
The cost of this speaker varies. If you want a stereo pair with the crown amplifier it runs about $25,000 USD. I know that JBL dealers have some wiggle room so it could be less expensive. I have also been told that if you wanted to configure the system on your own then a single M2 speaker runs about $6000 USD. From there you have different Harman amps you can choose from (I am well aware of other options; I won’t get into those in this review).
Here is a quote from the manufacturer:
Addressing the growing need for high dynamic range and reference-monitor accuracy in a broad range of studios, JBL has developed the M2 Master Reference Monitor: A Free-Standing, 2-Way System that can be placed in any environment to provide an exceptionally accurate monitoring experience. Leveraging a new generation of JBL high-output, ultra-low distortion transducers, the M2 provides in-room frequency response of 20 Hz to 40 kHz, and an extraordinary 123 dB maximum SPL to meet the demanding music, cinema and broadcast production requirements for impactful dynamic range.
CTA-2034 (SPINORAMA) and Accompanying Data
All data collected using Klippel’s Near-Field Scanner. The Near-Field-Scanner 3D (NFS) offers a fully automated acoustic measurement of direct sound radiated from the source under test. The radiated sound is determined in any desired distance and angle in the 3D space outside the scanning surface. Directivity, sound power, SPL response and many more key figures are obtained for any kind of loudspeaker and audio system in near field applications (e.g. studio monitors, mobile devices) as well as far field applications (e.g. professional audio systems). Utilizing a minimum of measurement points, a comprehensive data set is generated containing the loudspeaker’s high resolution, free field sound radiation in the near and far field. For a detailed explanation of how the NFS works and the science behind it, please watch the below discussion with designer Christian Bellmann:
Here is a photo of the speaker on the Klippel NFS. It is laid on its side because it is simply too large to perform measurements on in the vertical position. Note: The woofer grille is removed in this photo but was on when measurements were taken.
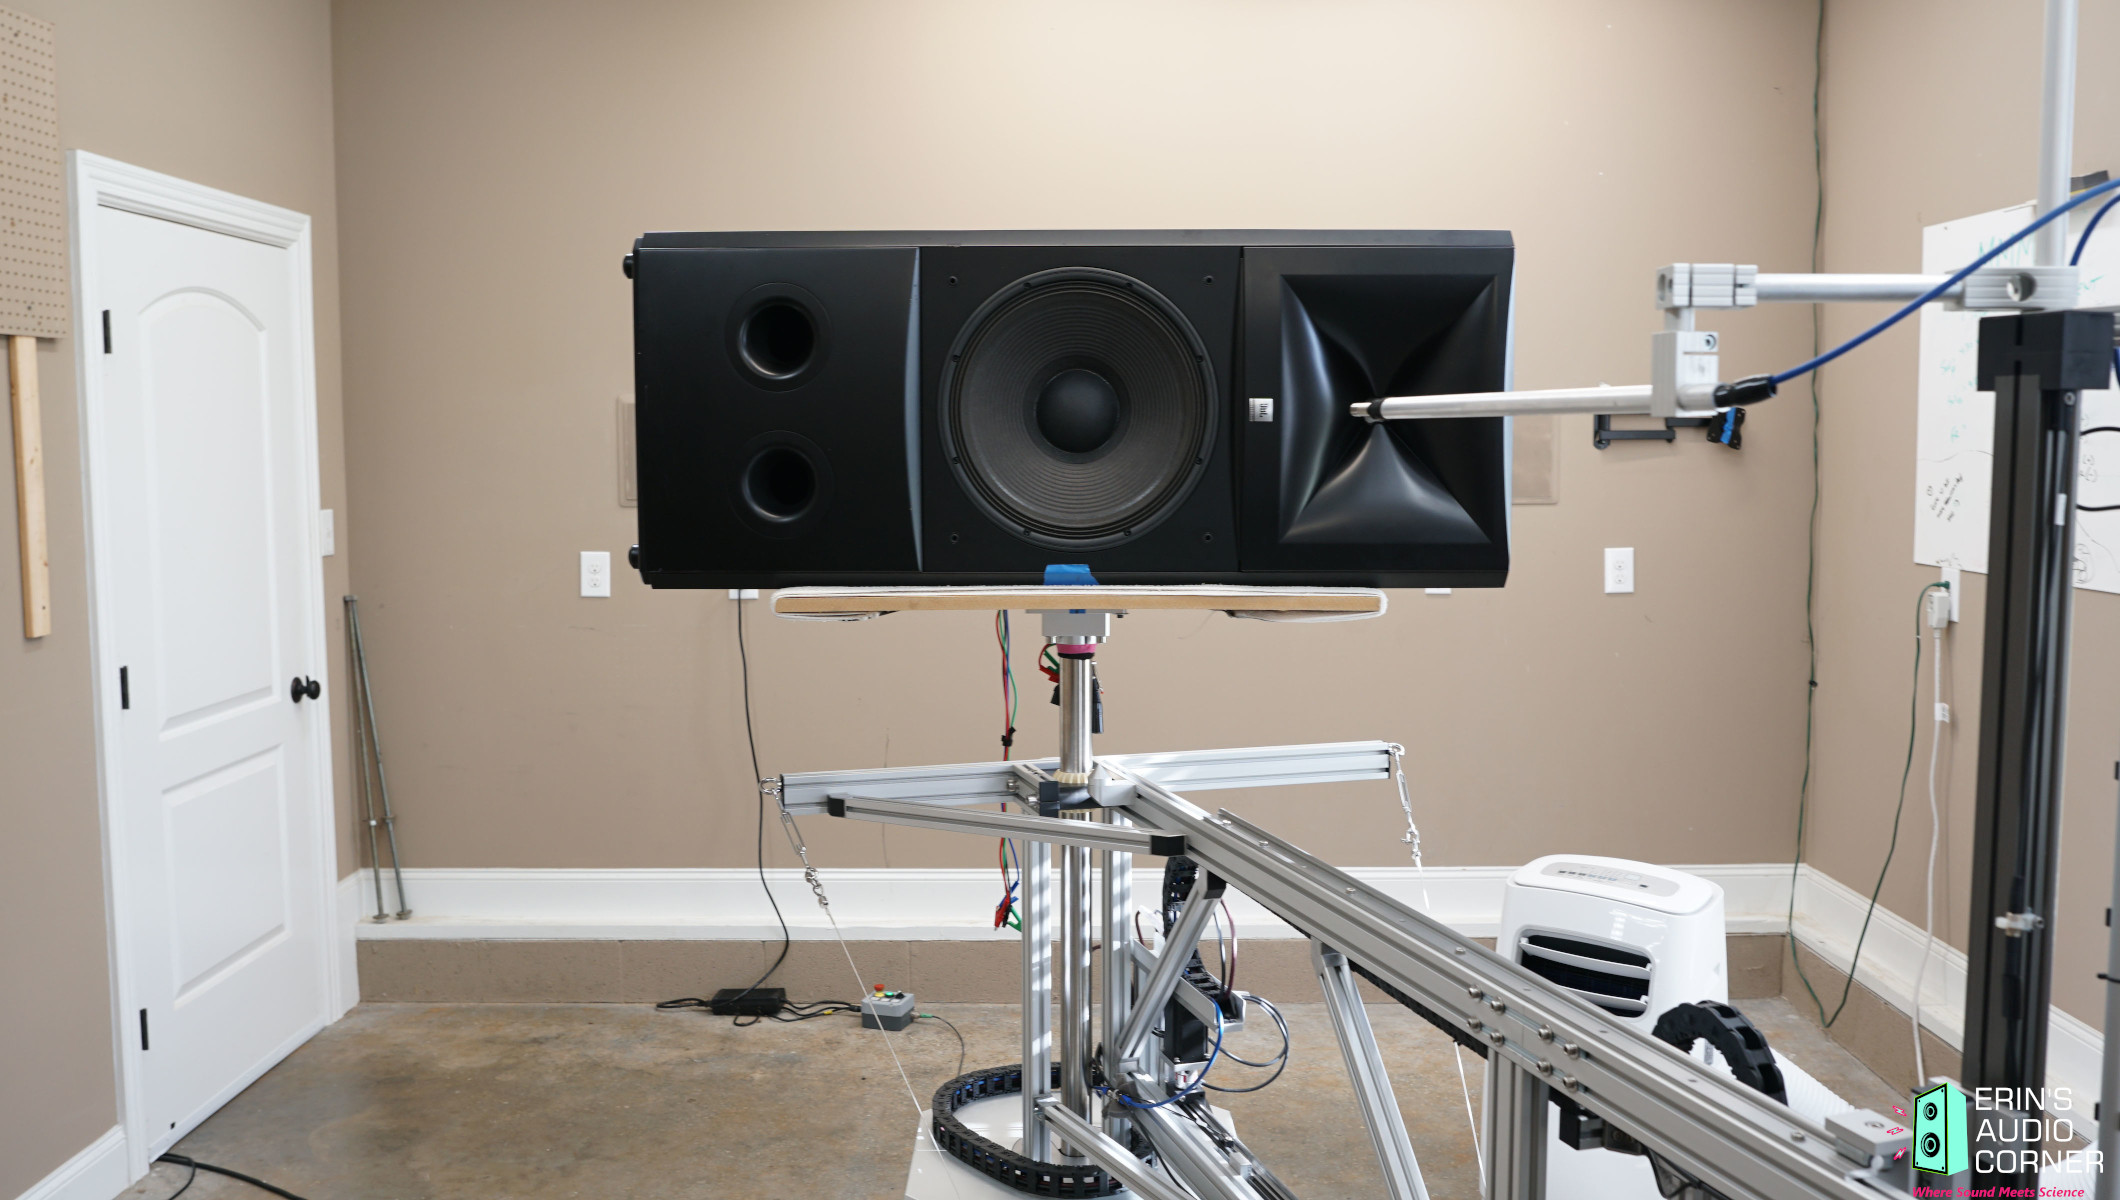
The reference point in this test is directly in front of the tweeter.
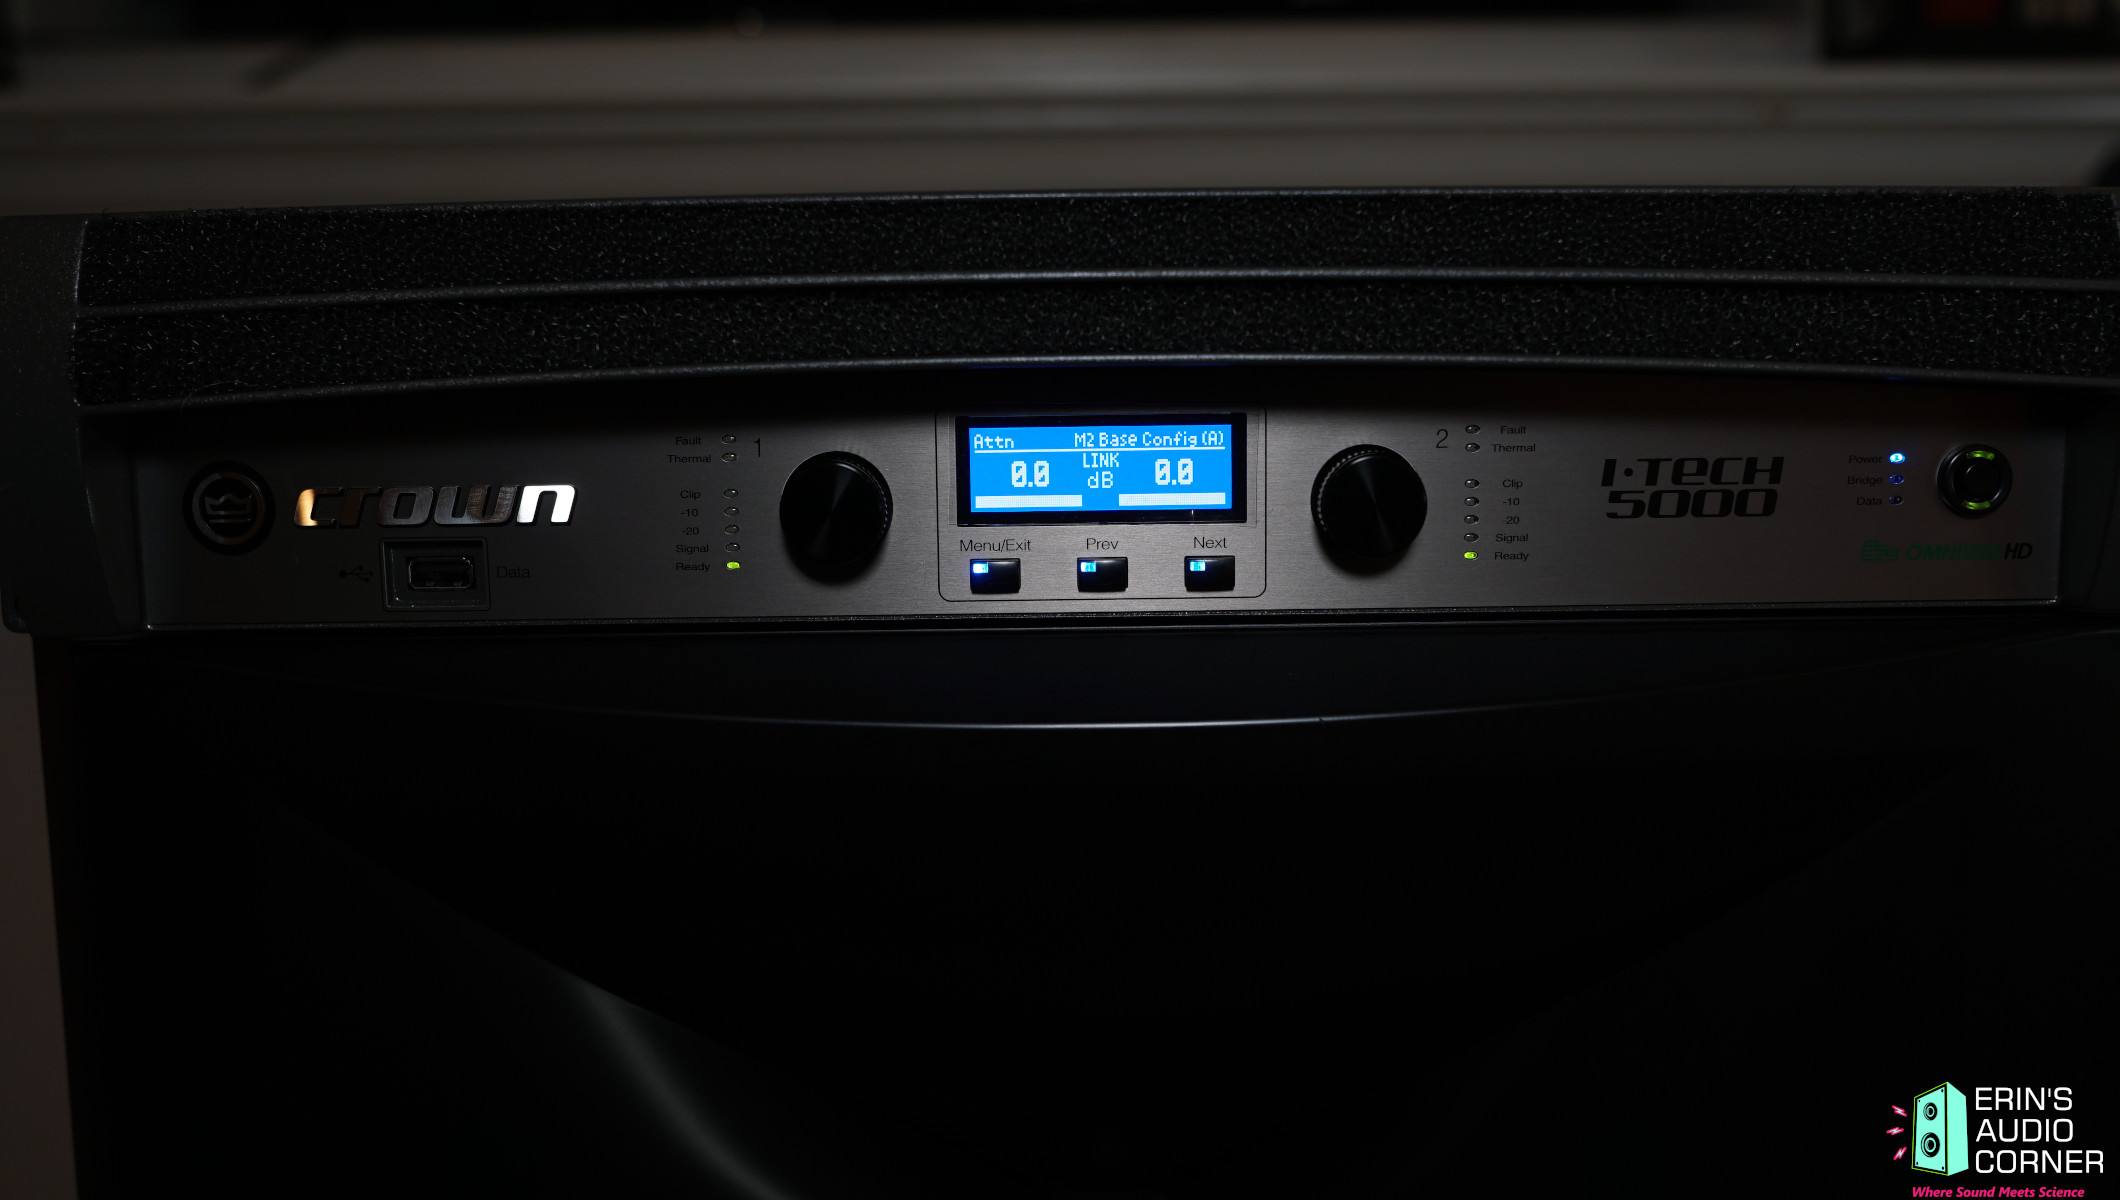
As I mentioned in the intro, I used the matching Crown I-Tech 5000HD amplifier with the “JBL M2 Base Config” loaded into the DSP section. You can see this in the photo of the amplifier above. I changed no settings (even though I wanted to, just to see if I could improve the performance).
Measurements are provided in a format in accordance with the Standard Method of Measurement for In-Home Loudspeakers (ANSI/CTA-2034-A R-2020). For more information, please see this link.
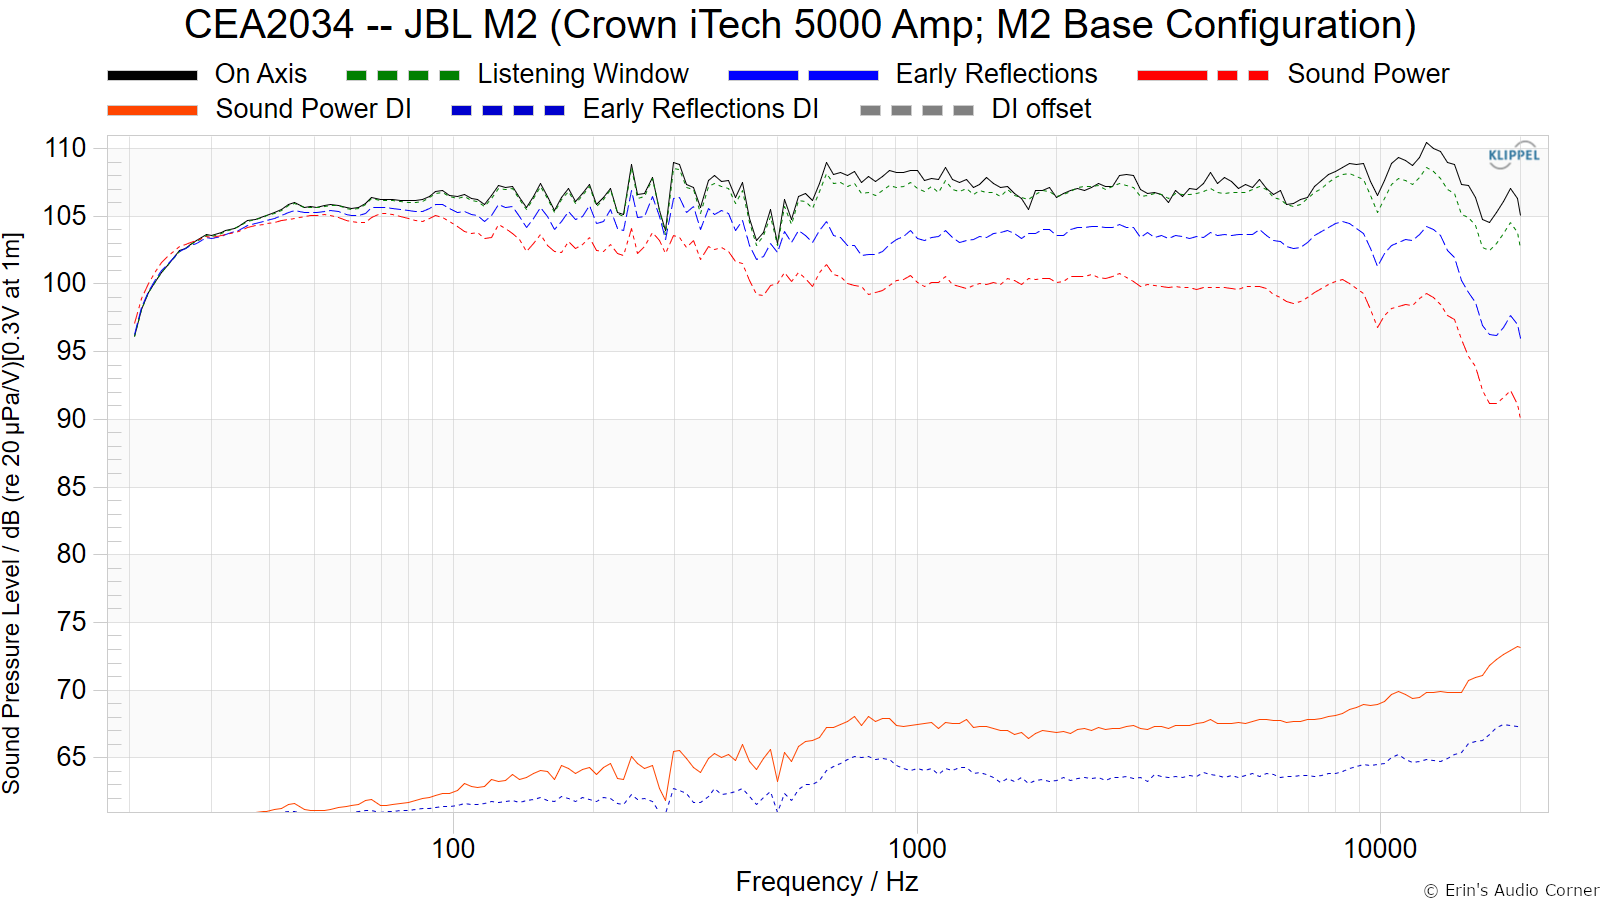
CTA-2034 / SPINORAMA:
The On-axis Frequency Response (0°) is the universal starting point and in many situations, it is a fair representation of the first sound to arrive at a listener’s ears.
The Listening Window is a spatial average of the nine amplitude responses in the ±10º vertical and ±30º horizontal angular range. This encompasses those listeners who sit within a typical home theater audience, as well as those who disregard the normal rules when listening alone.
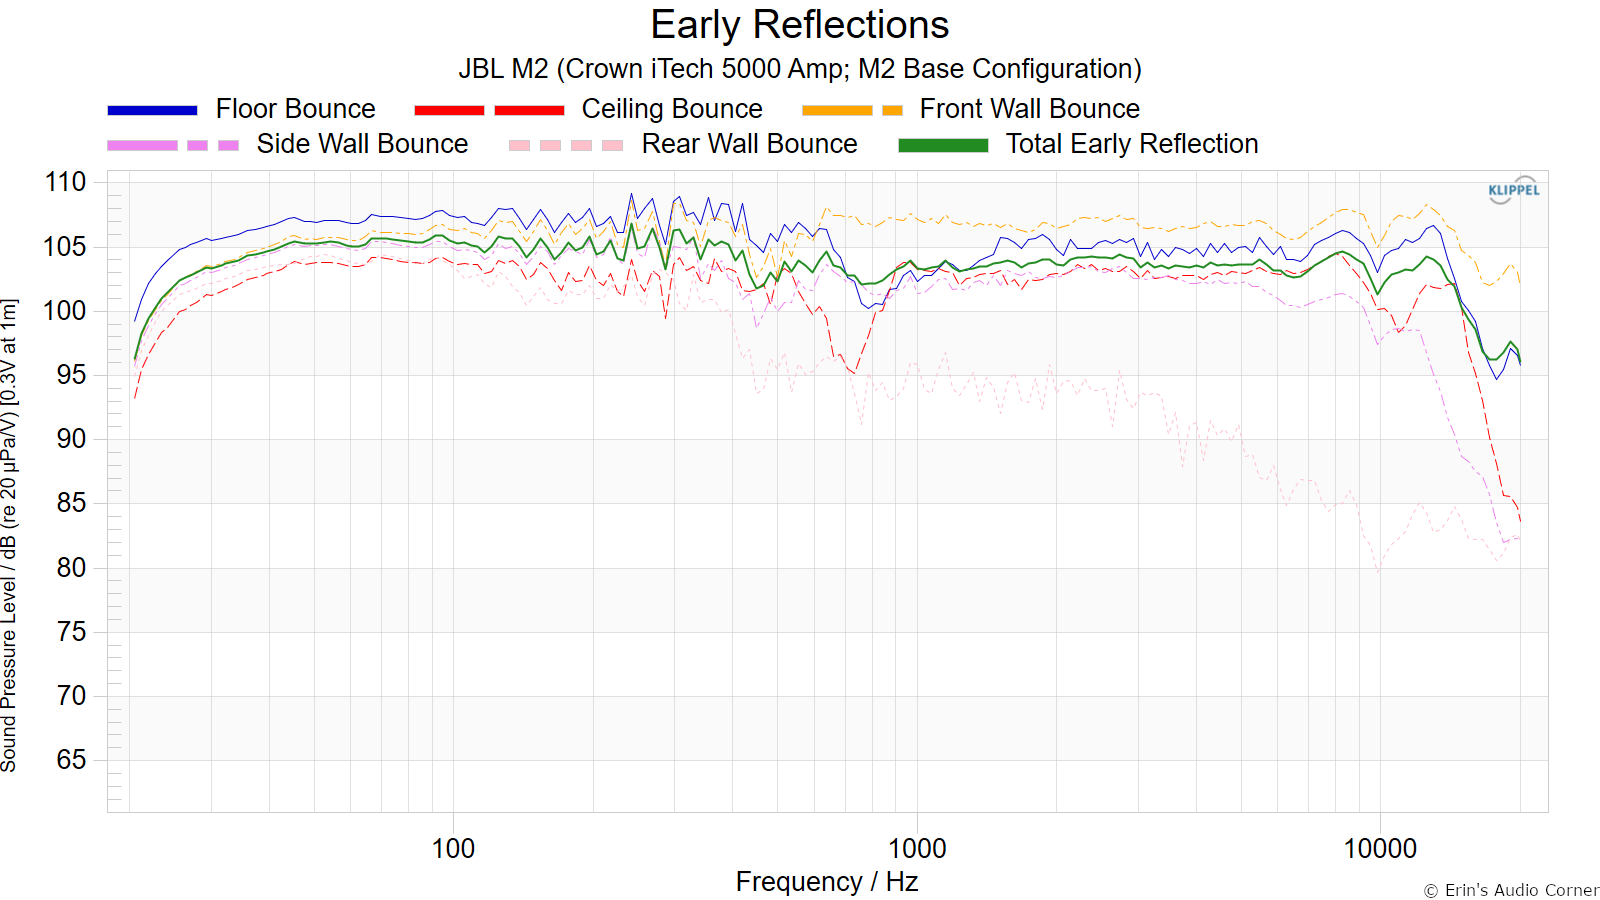
The Early Reflections curve is an estimate of all single-bounce, first-reflections, in a typical listening room.
Sound Power represents all the sounds arriving at the listening position after any number of reflections from any direction. It is the weighted rms average of all 70 measurements, with individual measurements weighted according to the portion of the spherical surface that they represent.
Sound Power Directivity Index (SPDI): In this standard the SPDI is defined as the difference between the listening window curve and the sound power curve.
Early Reflections Directivity Index (EPDI): is defined as the difference between the listening window curve and the early reflections curve. In small rooms, early reflections figure prominently in what is measured and heard in the room so this curve may provide insights into potential sound quality.
Early Reflections Breakout:
Floor bounce: average of 20º, 30º, 40º down
Ceiling bounce: average of 40º, 50º, 60º up
Front wall bounce: average of 0º, ± 10º, ± 20º, ± 30º horizontal
Side wall bounces: average of ± 40º, ± 50º, ± 60º, ± 70º, ± 80º horizontal
Rear wall bounces: average of 180º, ± 90º horizontal
Estimated In-Room Response:
In theory, with complete 360-degree anechoic data on a loudspeaker and sufficient acoustical and geometrical data on the listening room and its layout it would be possible to estimate with good precision what would be measured by an omnidirectional microphone located in the listening area of that room. By making some simplifying assumptions about the listening space, the data set described above permits a usefully accurate preview of how a given loudspeaker might perform in a typical domestic listening room. Obviously, there are no guarantees because individual rooms can be acoustically aberrant. Sometimes rooms are excessively reflective (“live”) as happens in certain hot, humid climates, with certain styles of interior décor and in under-furnished rooms. Sometimes rooms are excessively “dead” as in other styles of décor and in some custom home theaters where acoustical treatment has been used excessively. This form of post processing is offered only as an estimate of what might happen in a domestic living space with carpet on the floor and a “normal” amount of seating, drapes, and cabinetry.
For these limited circumstances it has been found that a usefully accurate Predicted In-Room (PIR) amplitude response, also known as a “room curve” is obtained by a weighted average consisting of 12 % listening window, 44 % early reflections and 44 % sound power. At very high frequencies errors can creep in because of excessive absorption, microphone directivity, and room geometry. These discrepancies are not considered to be of great importance.

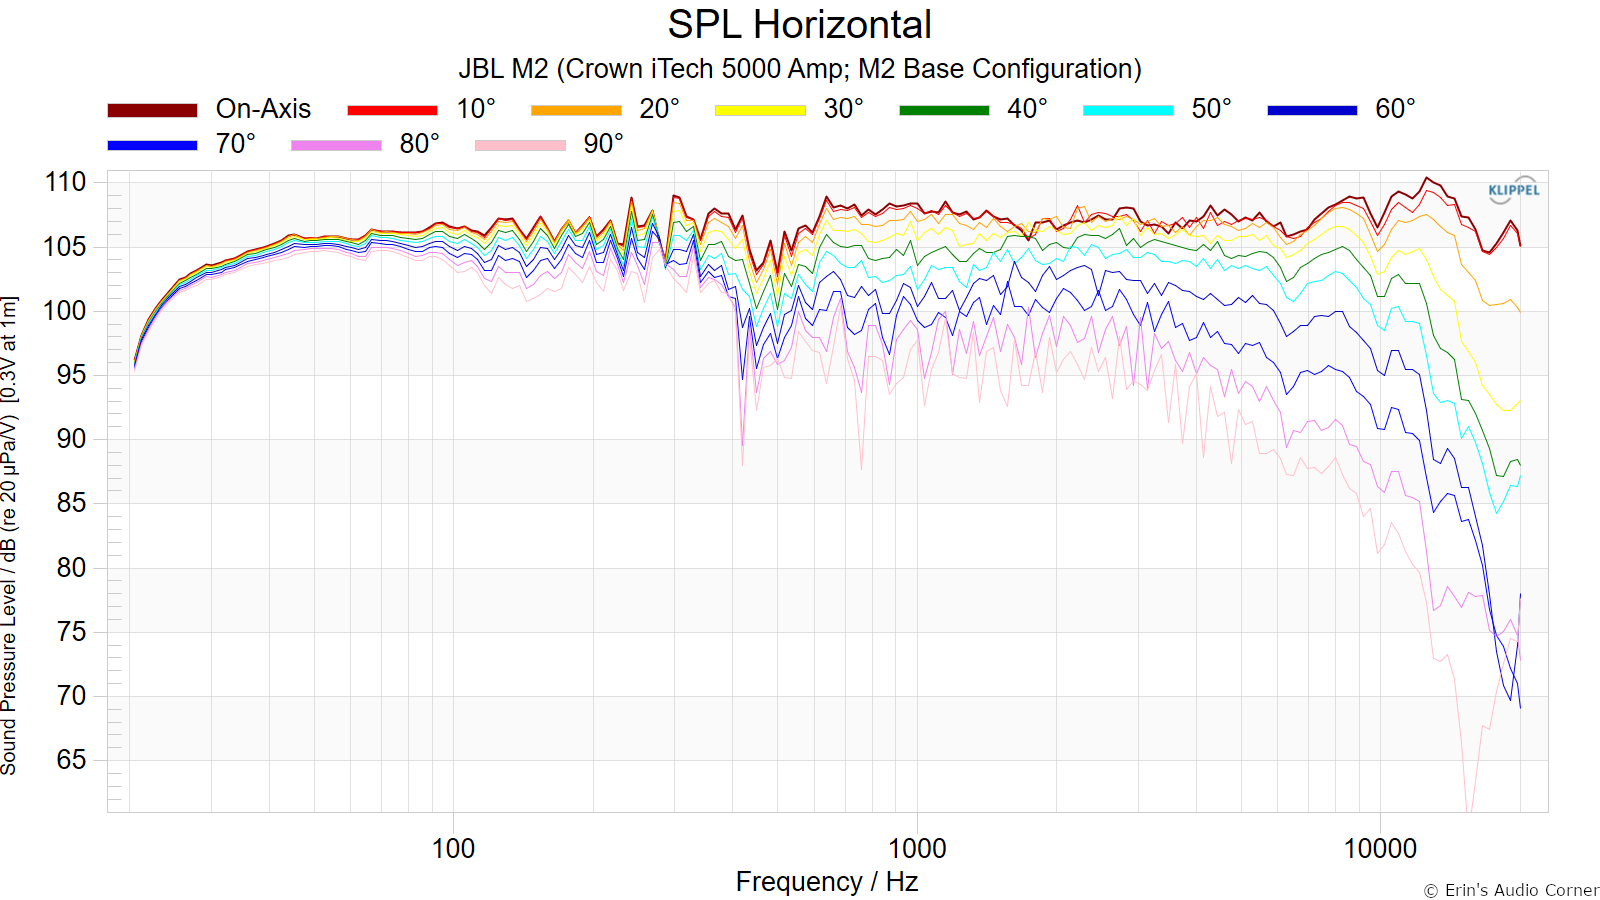
Horizontal Frequency Response (0° to ±90°):
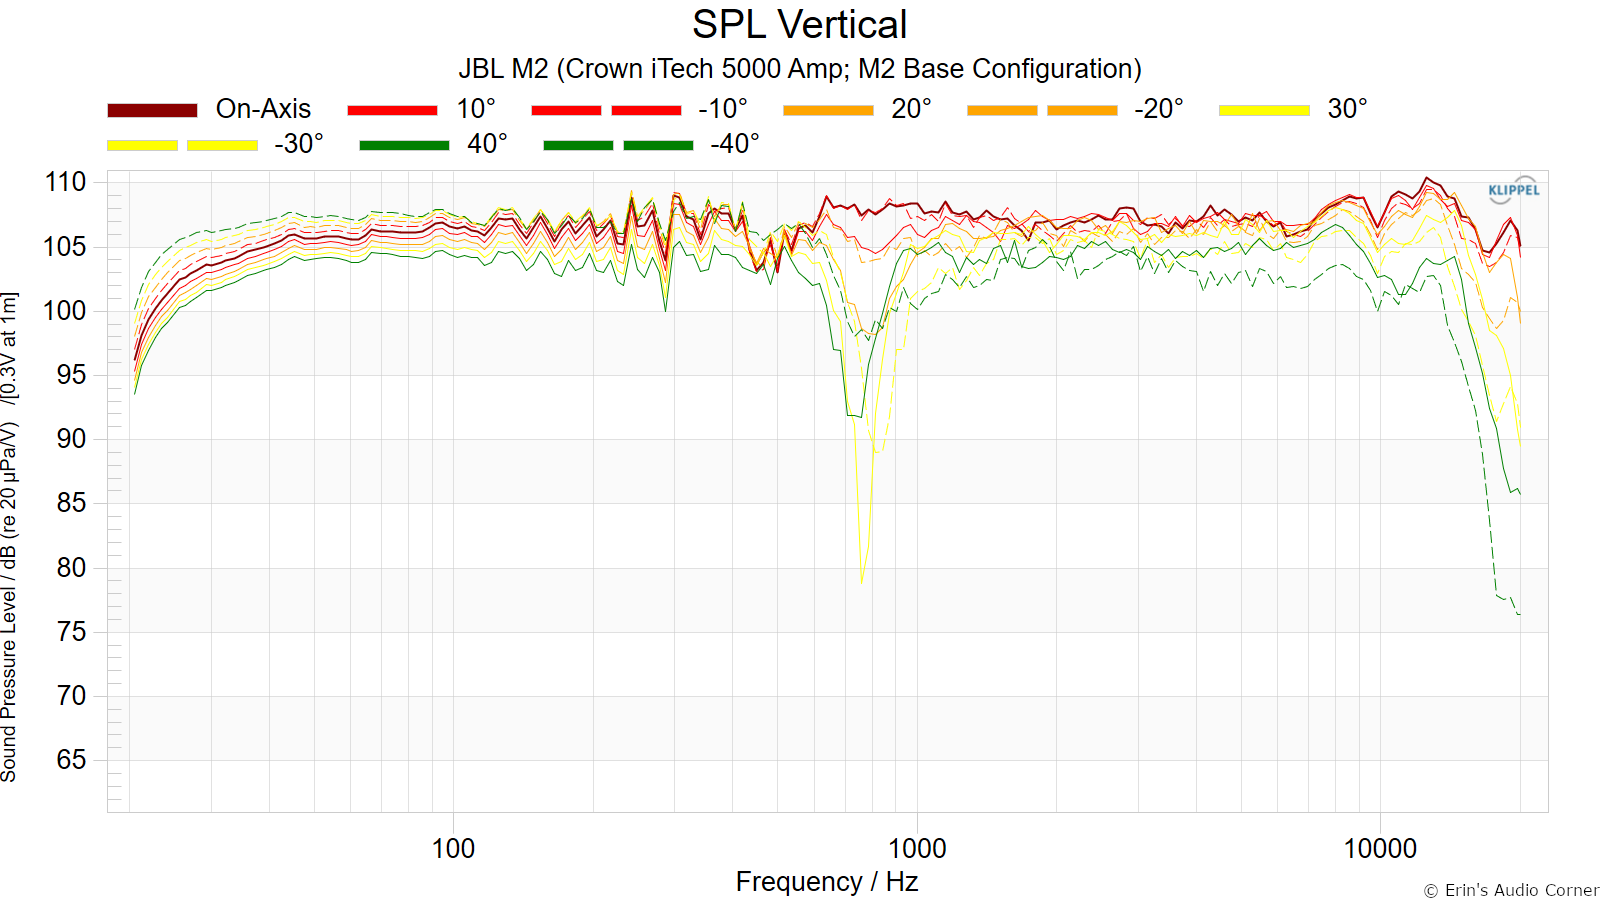
Vertical Frequency Response (0° to ±40°):
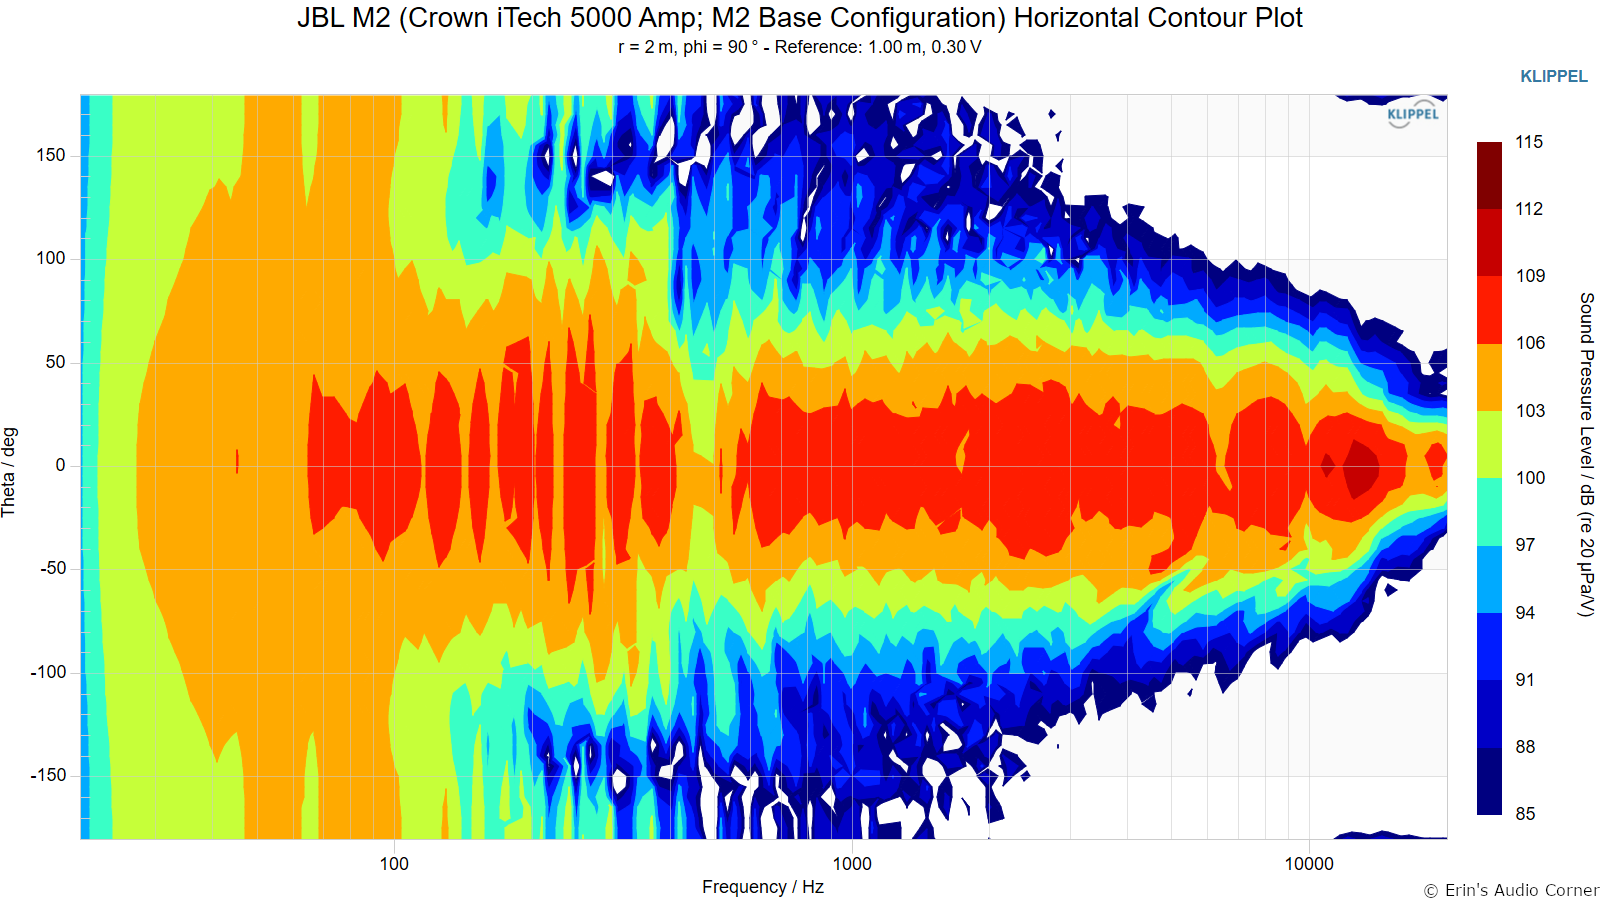
Horizontal Contour Plot (not normalized):
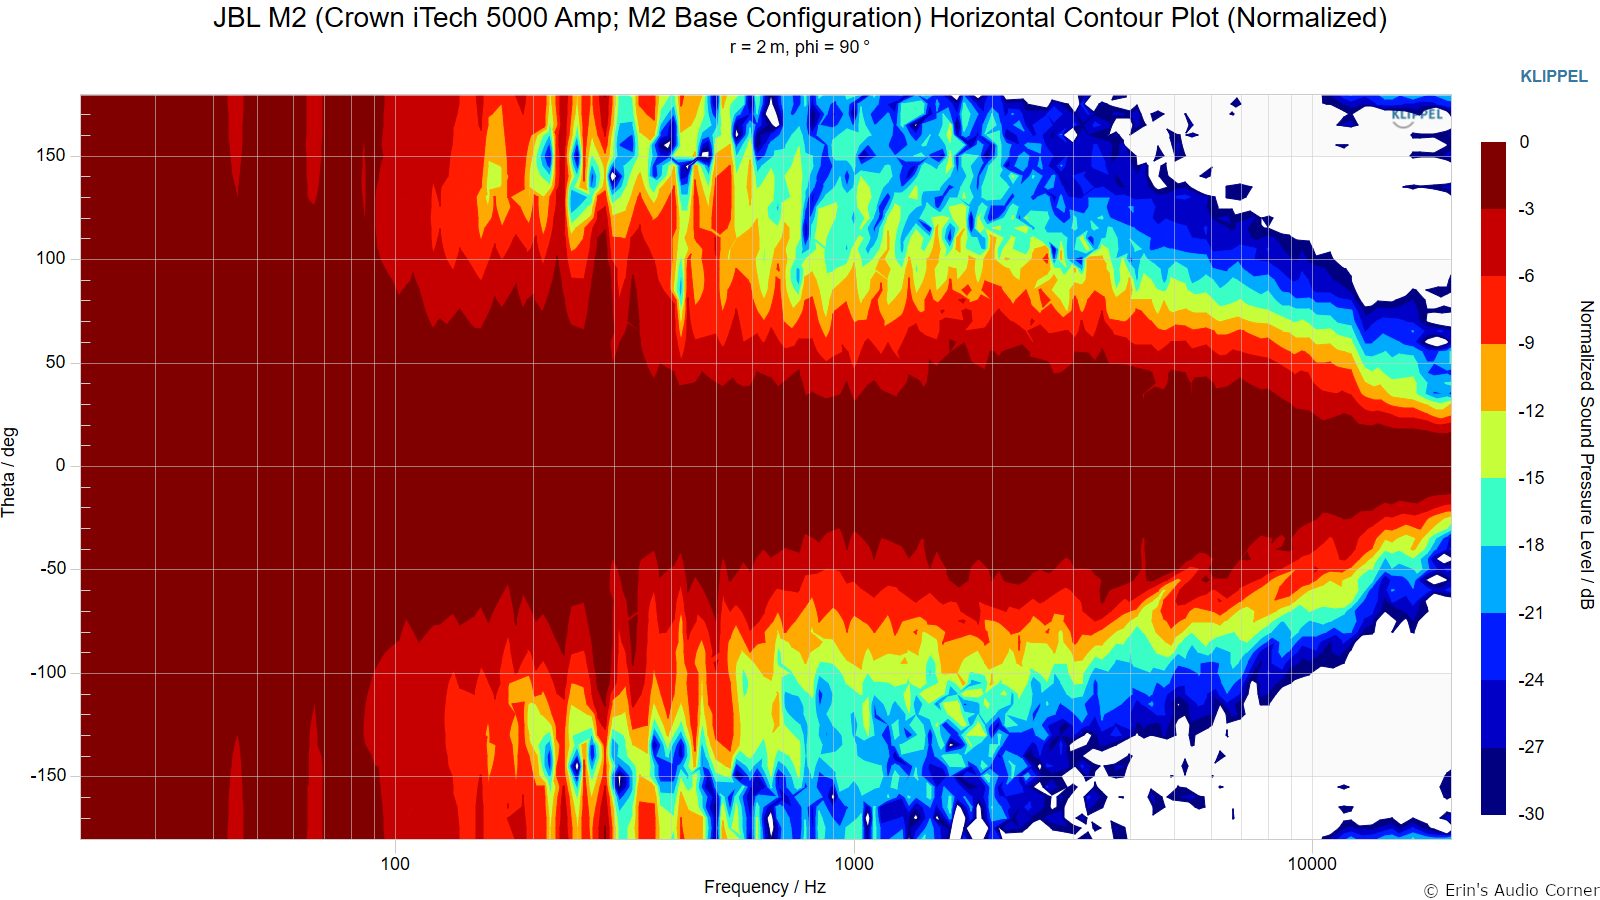
Horizontal Contour Plot (normalized):
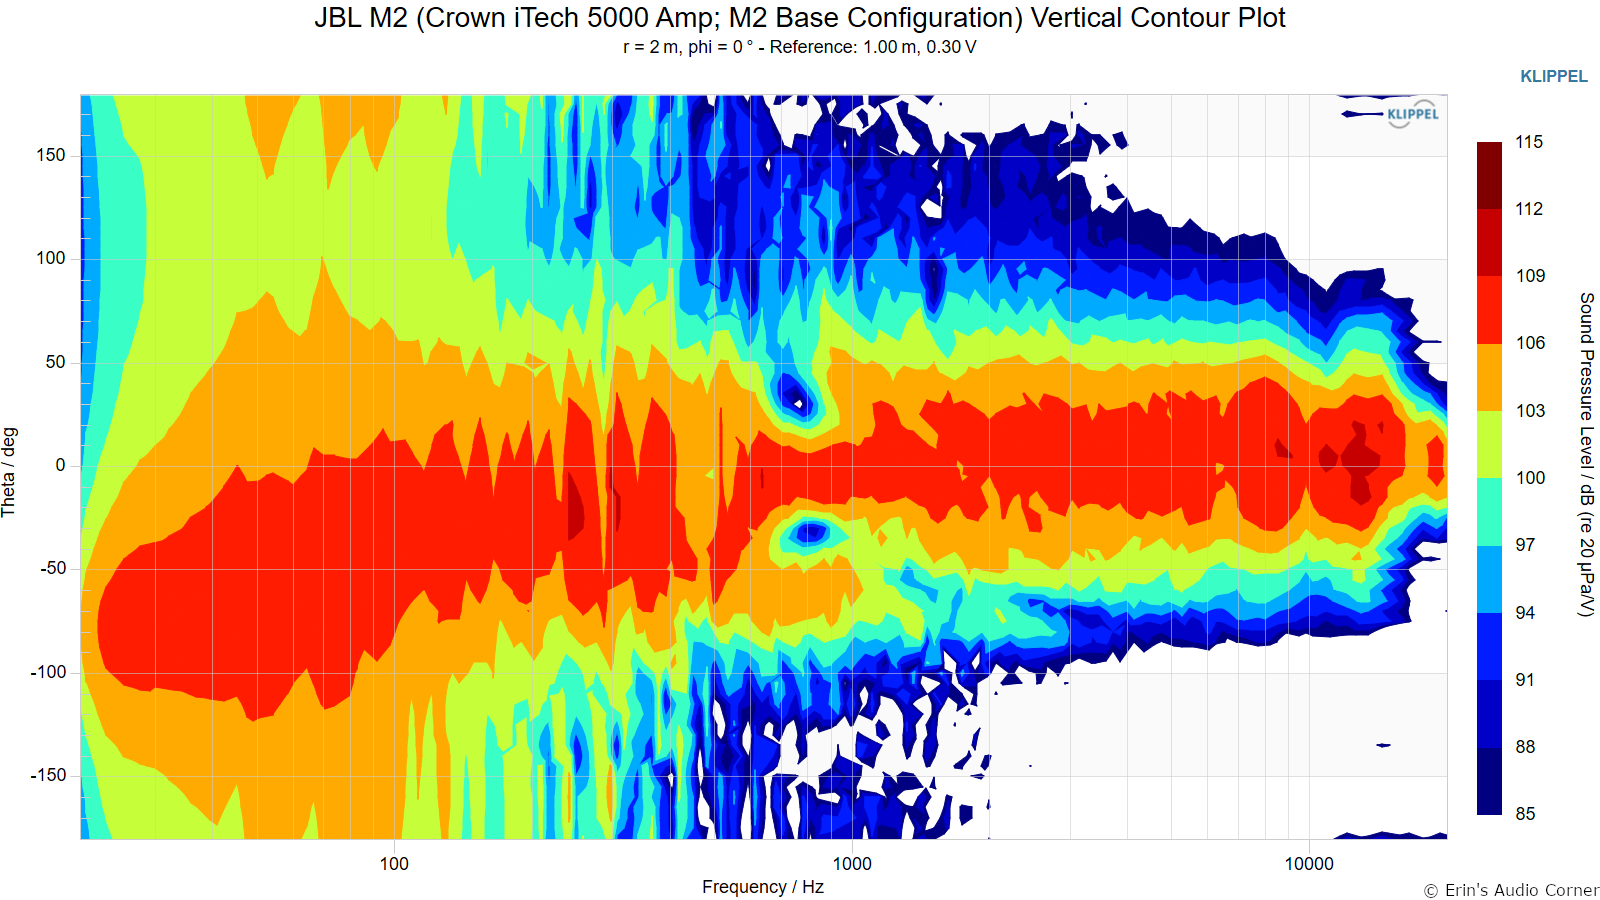
Vertical Contour Plot (not normalized):
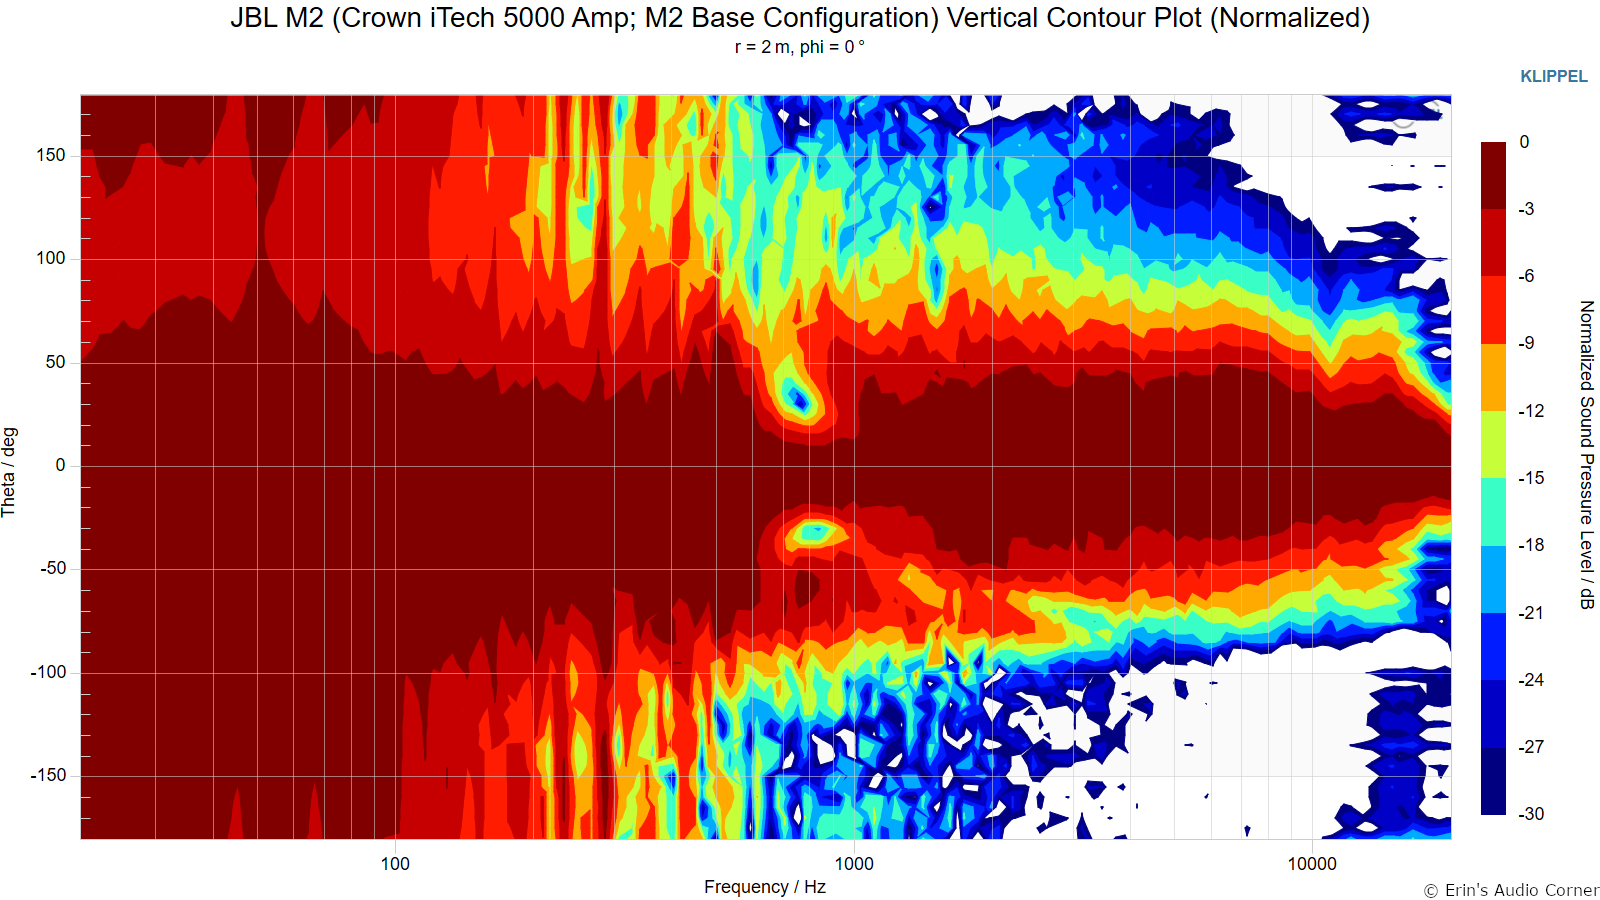
Vertical Contour Plot (normalized):
Additional Measurements
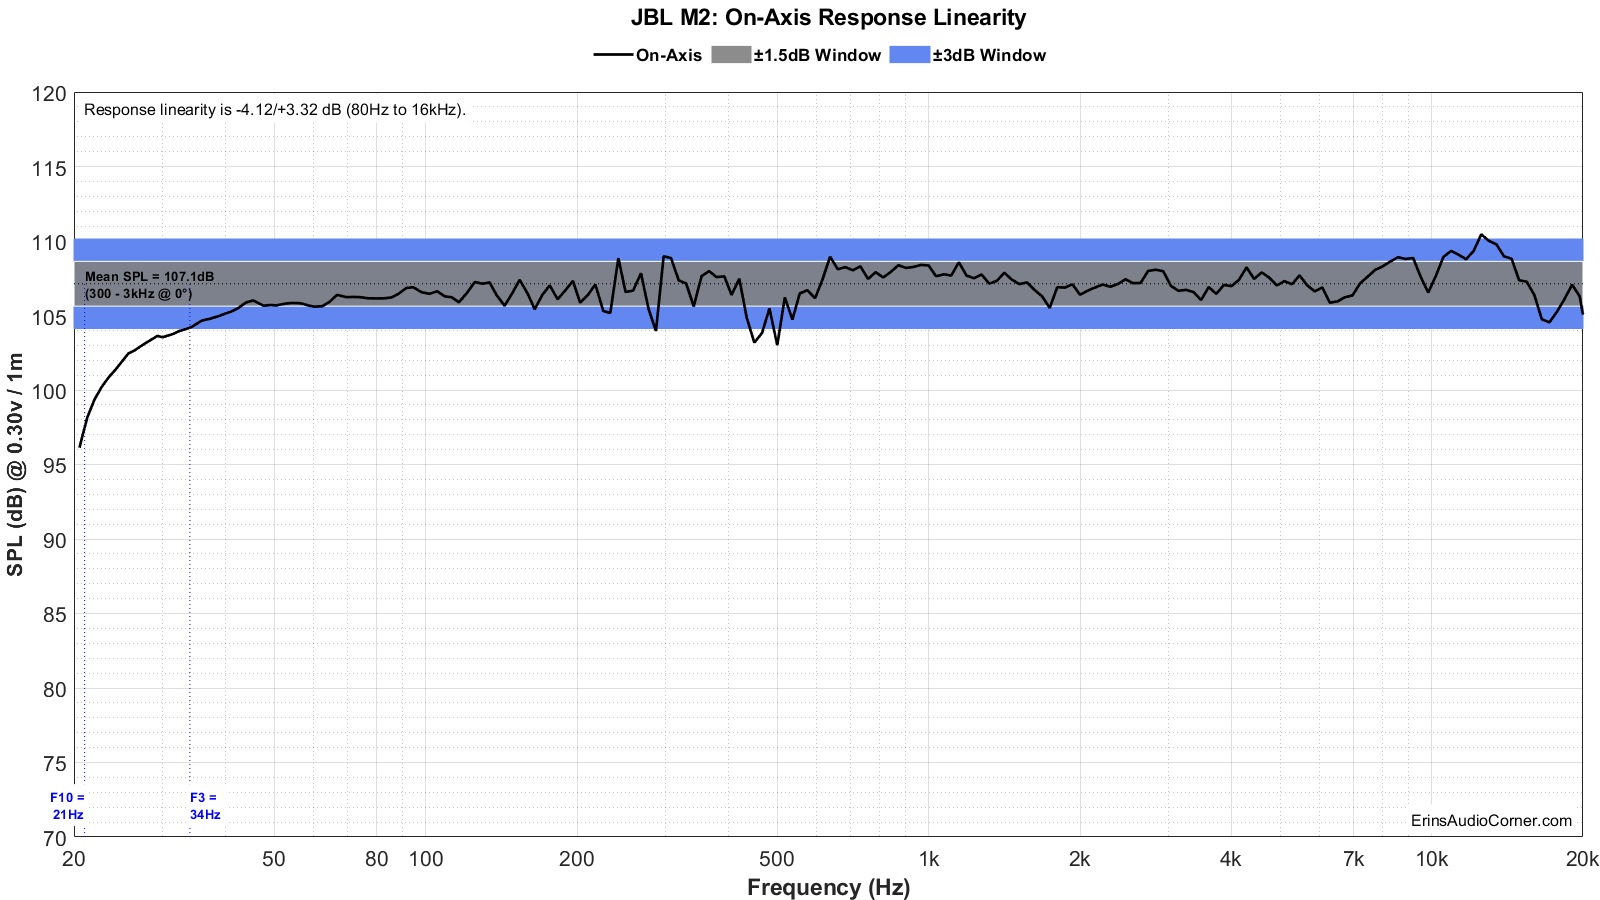
On-Axis Response Linearity
“Globe” Plots
These plots are generated from exporting the Klippel data to text files. I then process that data with my own MATLAB script to provide what you see. These are not part of any software packages and are unique to my tests.
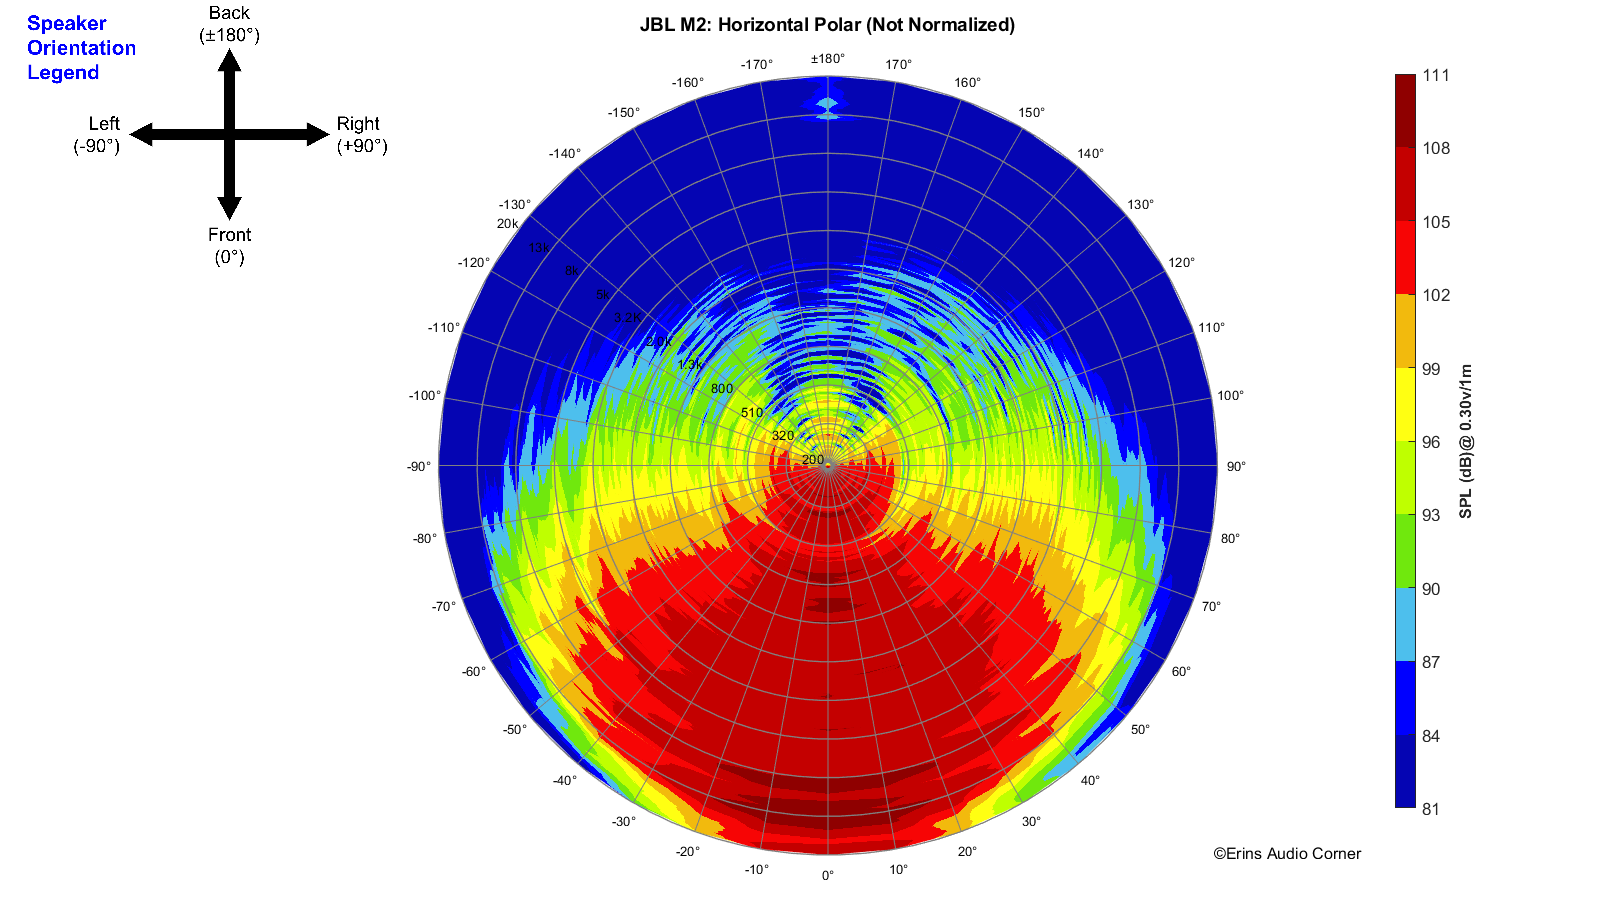
Horizontal Polar (Globe) Plot:
This represents the sound field at 2 meters - above 200Hz - per the legend in the upper left.
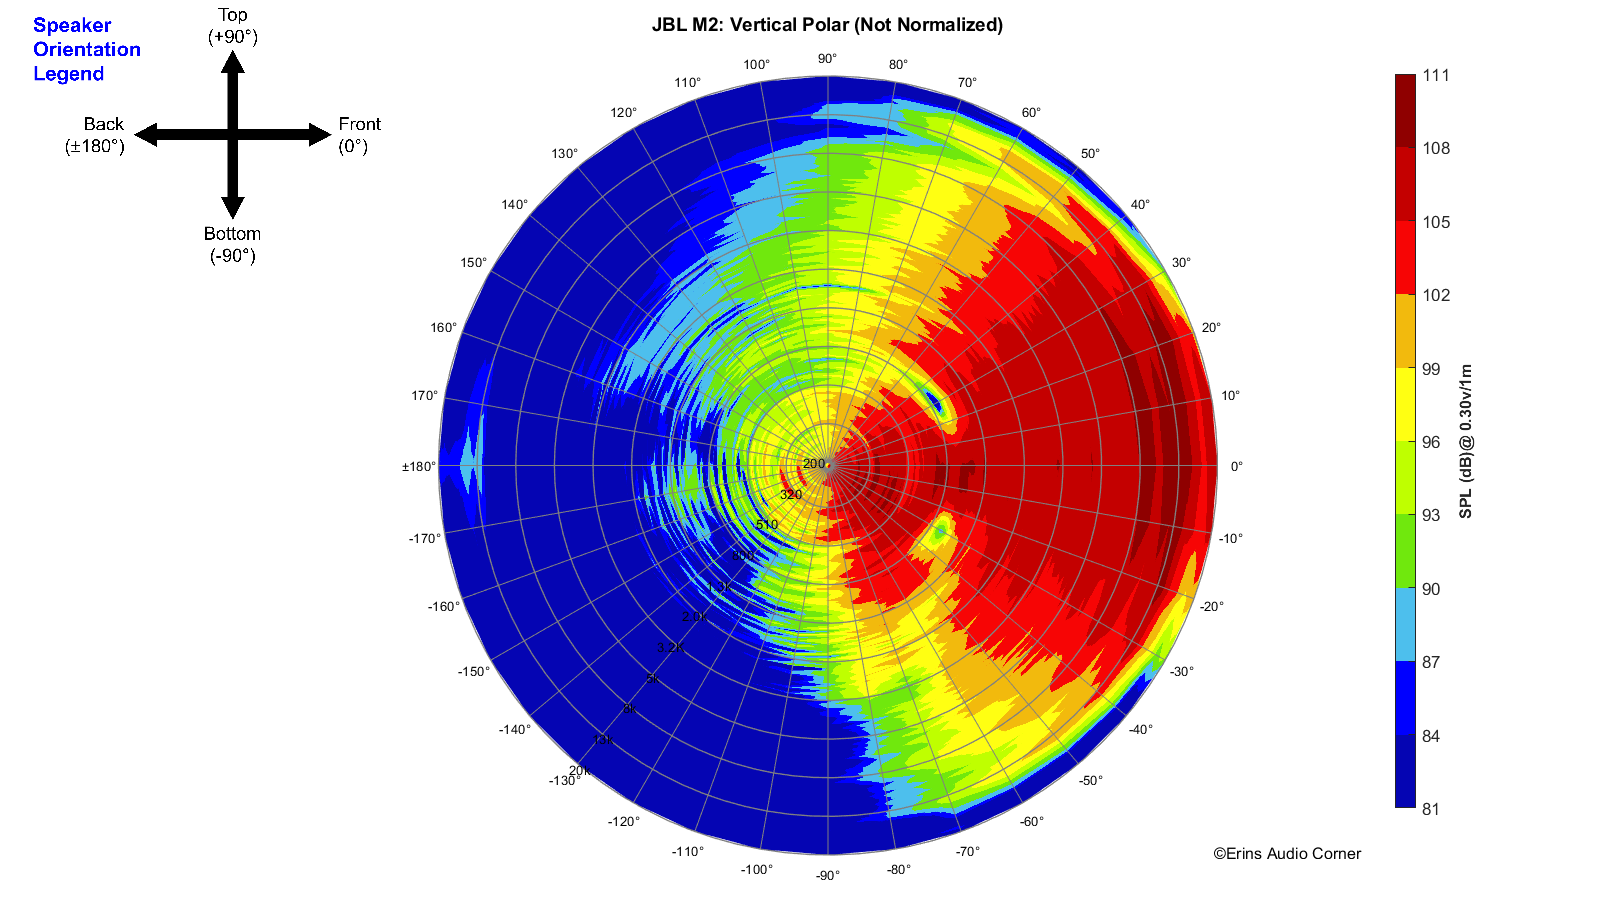
Vertical Polar (Globe) Plot:
This represents the sound field at 2 meters - above 200Hz - per the legend in the upper left.
Harmonic Distortion
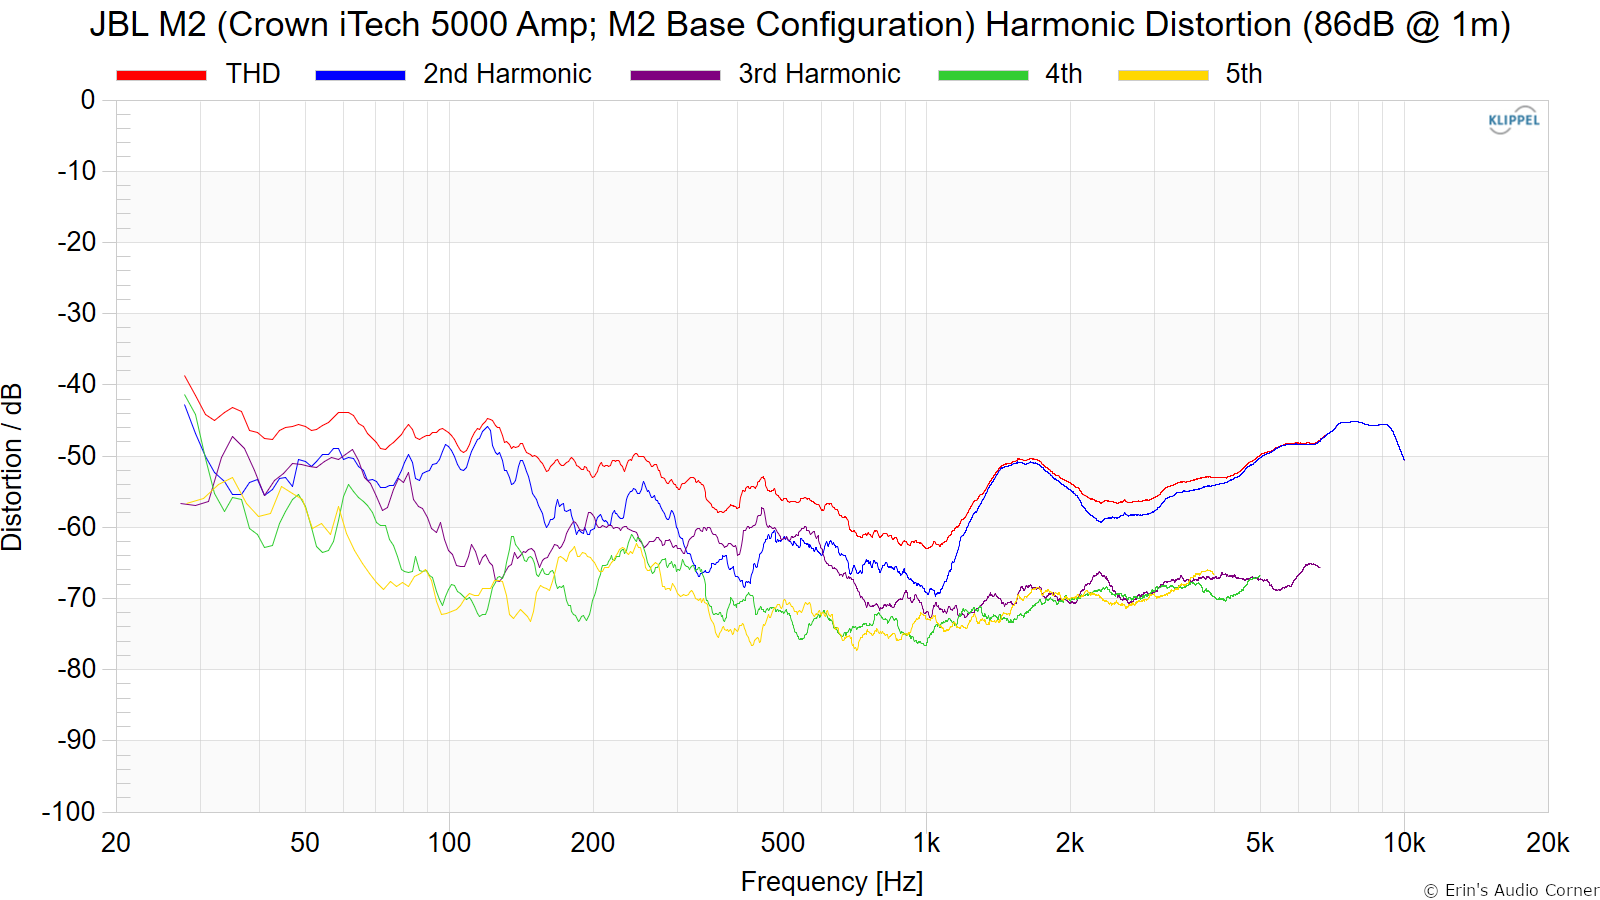
Harmonic Distortion at 86dB @ 1m:
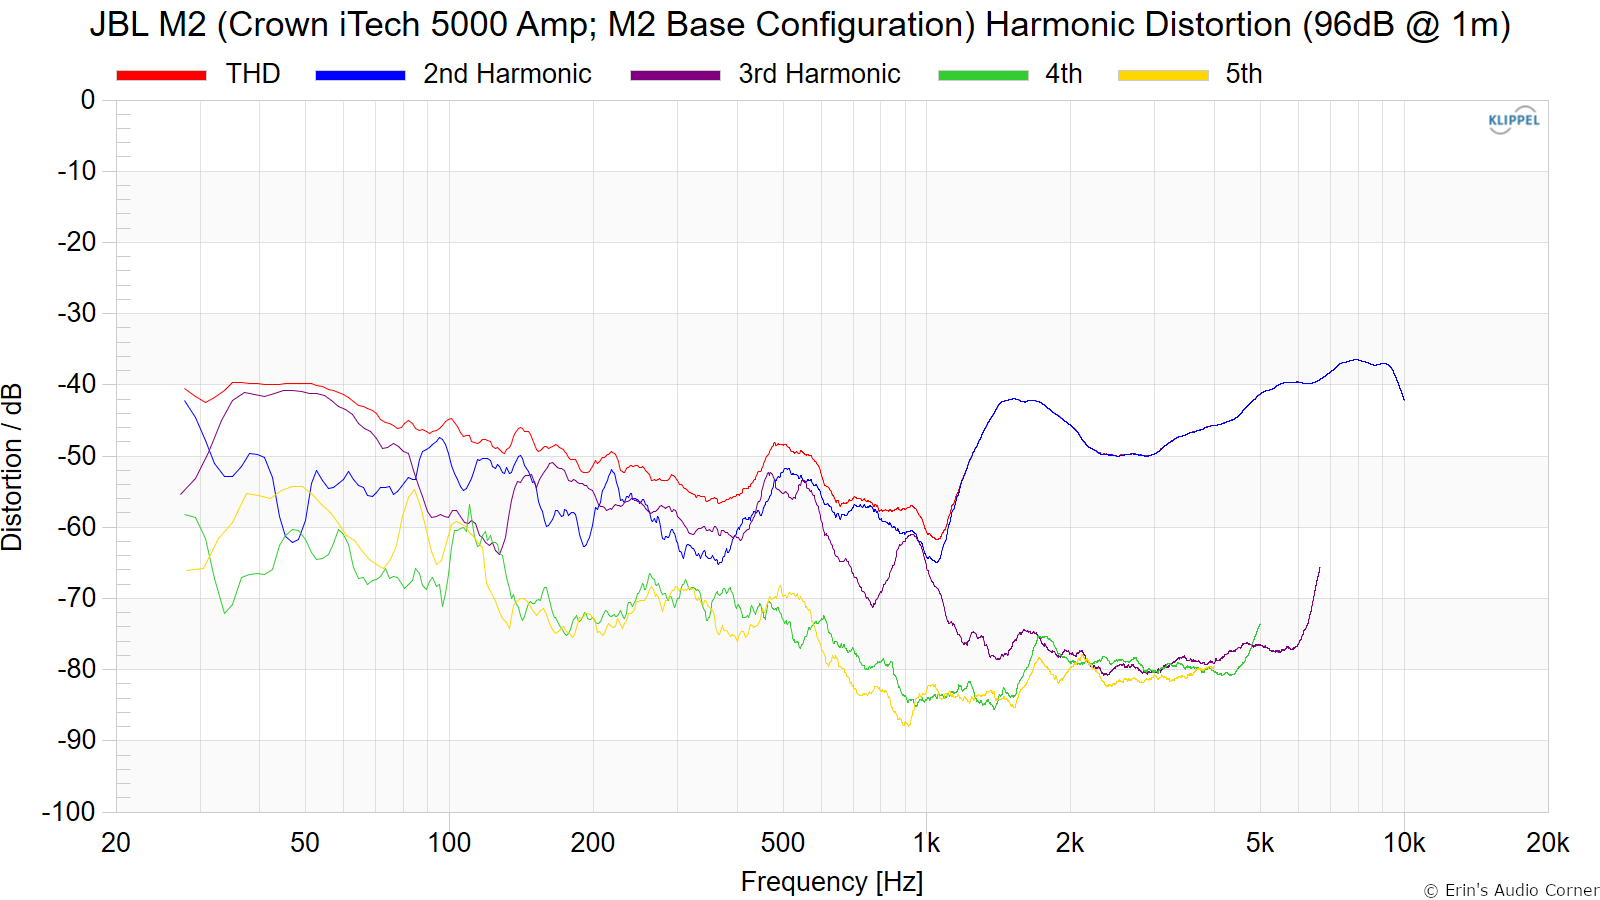
Harmonic Distortion at 96dB @ 1m:
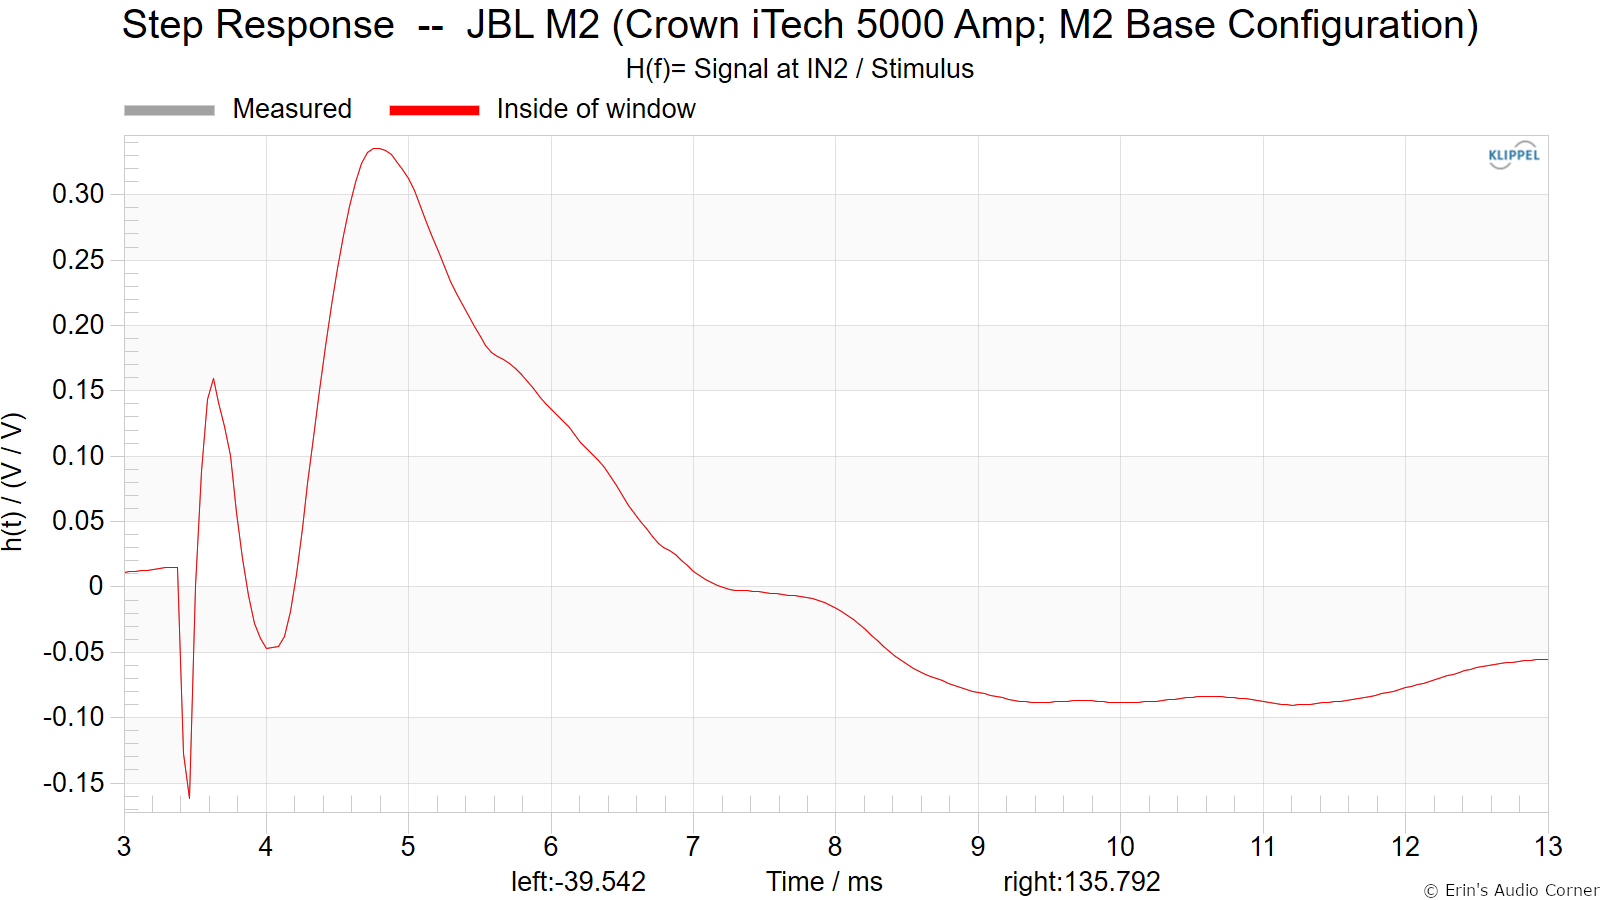
Step Response
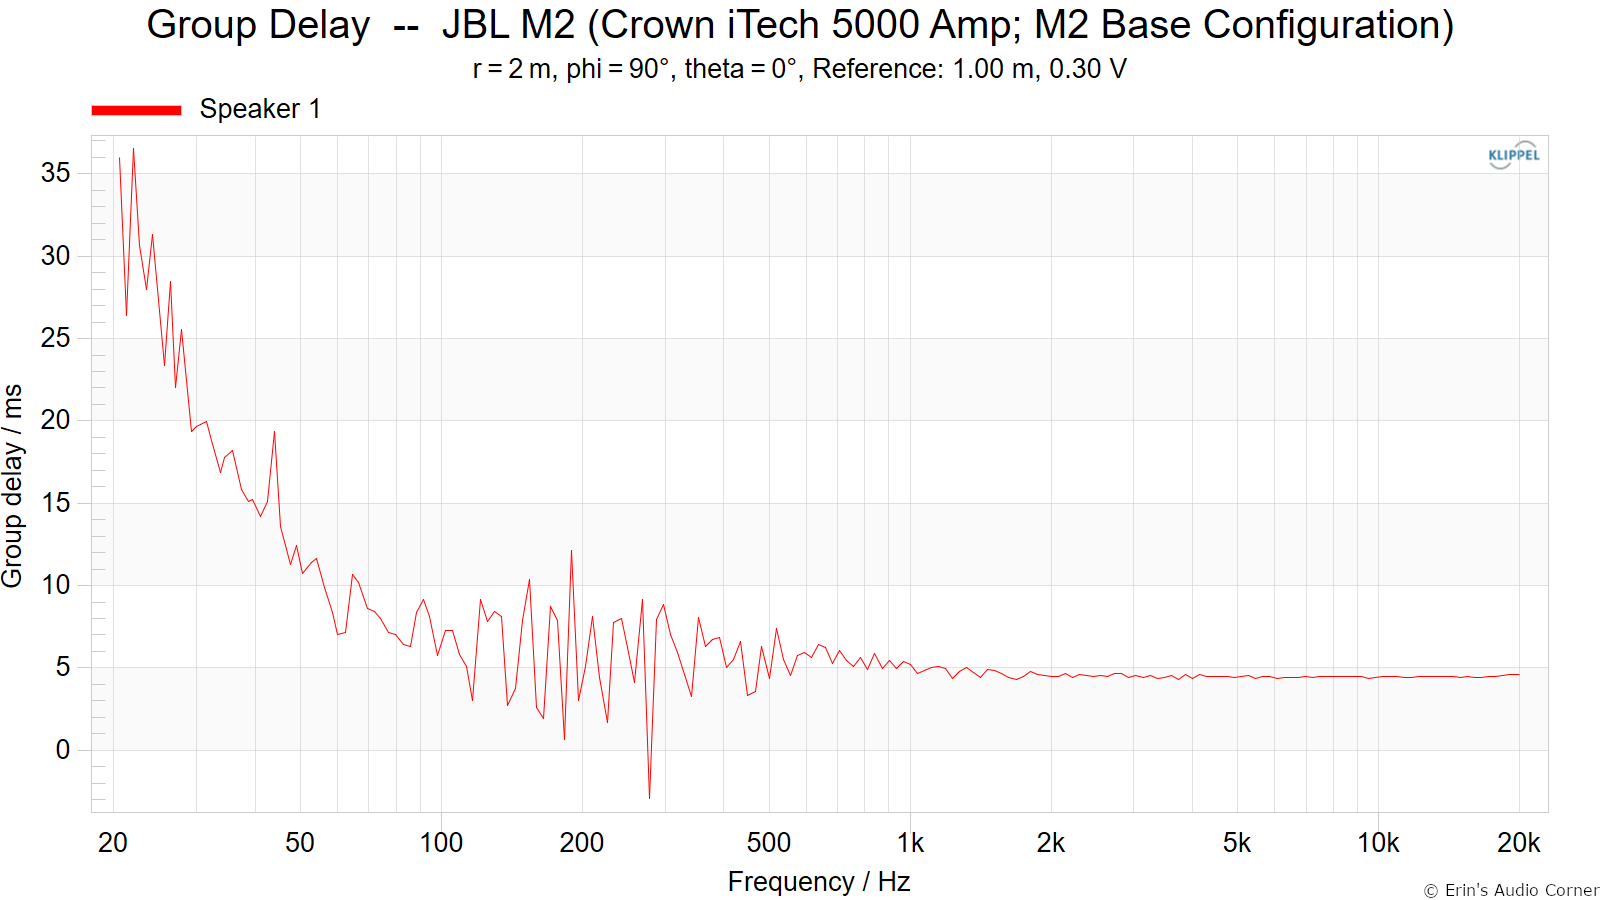
Group Delay
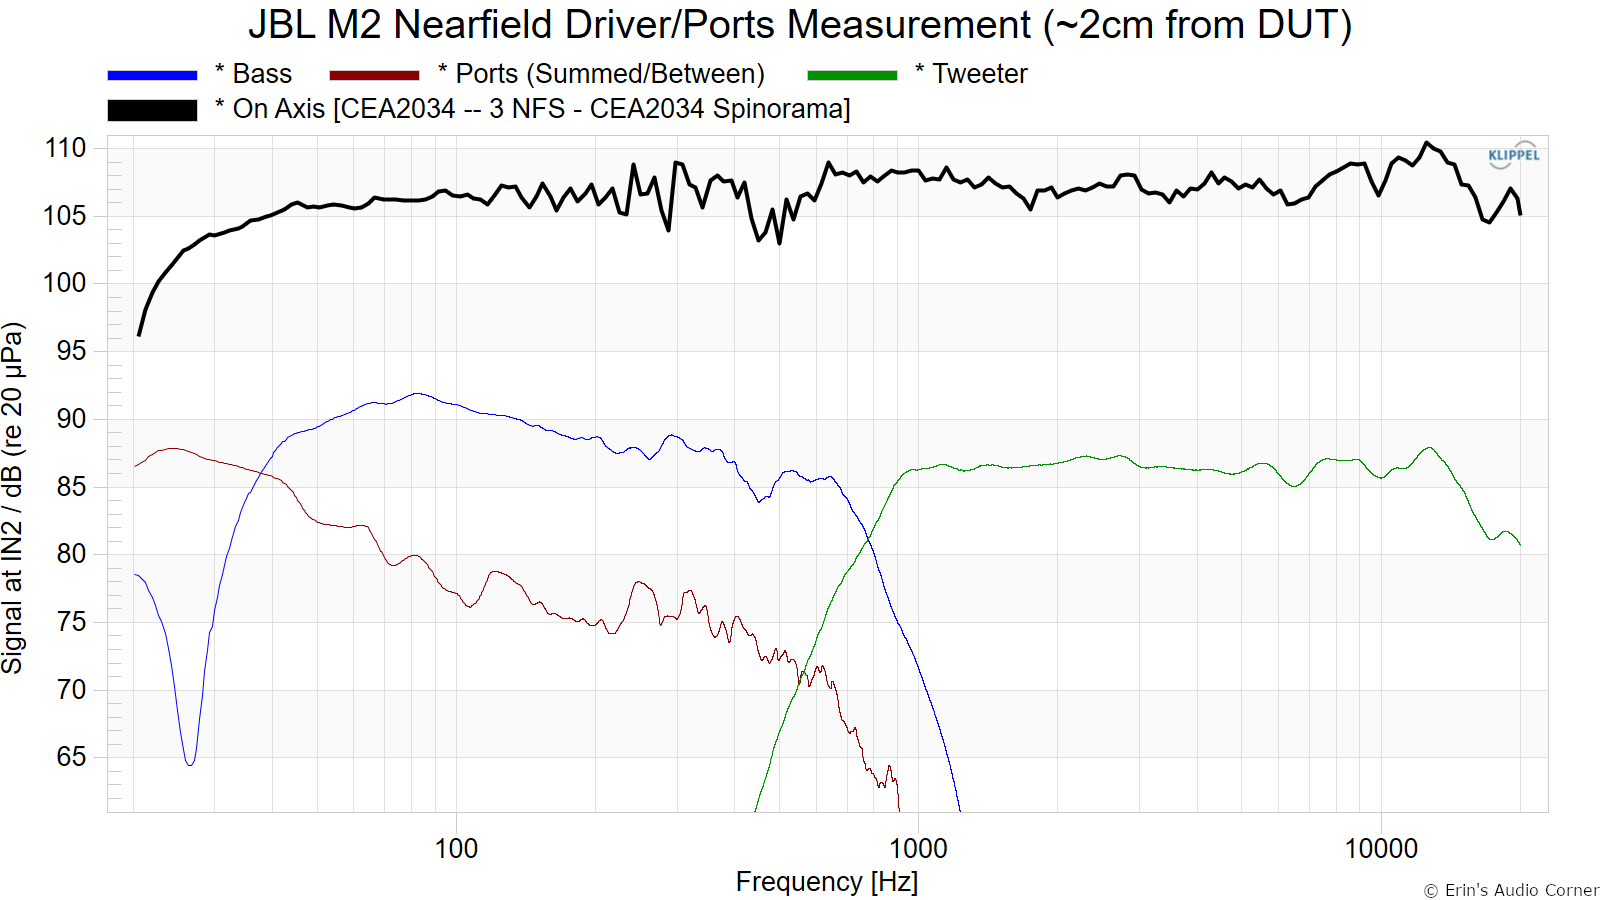
Near Field Measurements
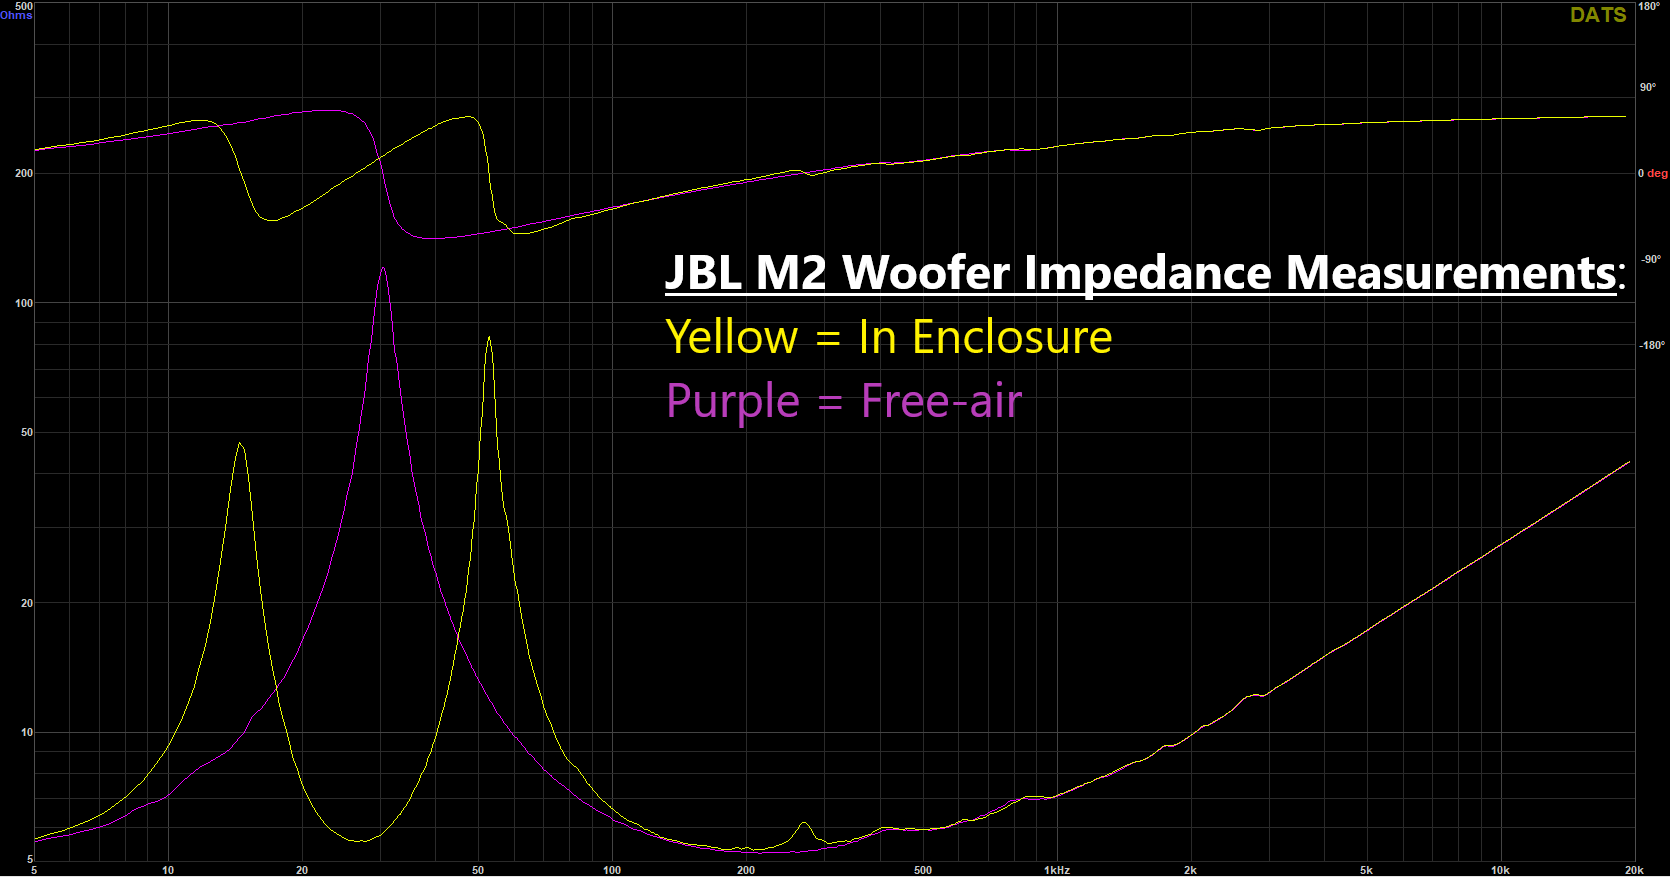
Woofer Impedance Testing
I noticed the resonance in the SPIN data and this made me curious what was going on. I first performed a near field measurement of the woofer with and without the grille. The results showed no difference in this region (meaning, the grille wasn’t the cause). So I measured the impedance of the woofer in the enclosure and then removed the woofer from the enclosure and measured the raw woofer impedance. As you can see, the enclosure is responsible for a resonance around 270Hz (I presume this is a standing wave as the frequency is roughly equivalent to the height of the enclosure). There is another resonance that is in the woofer itself centered around 400-500Hz; I presume this to be cone edge/surround resonance. This is responsible for the dip you see in the frequency response at this frequency.
Dynamic Range (Instantaneous Compression Test)
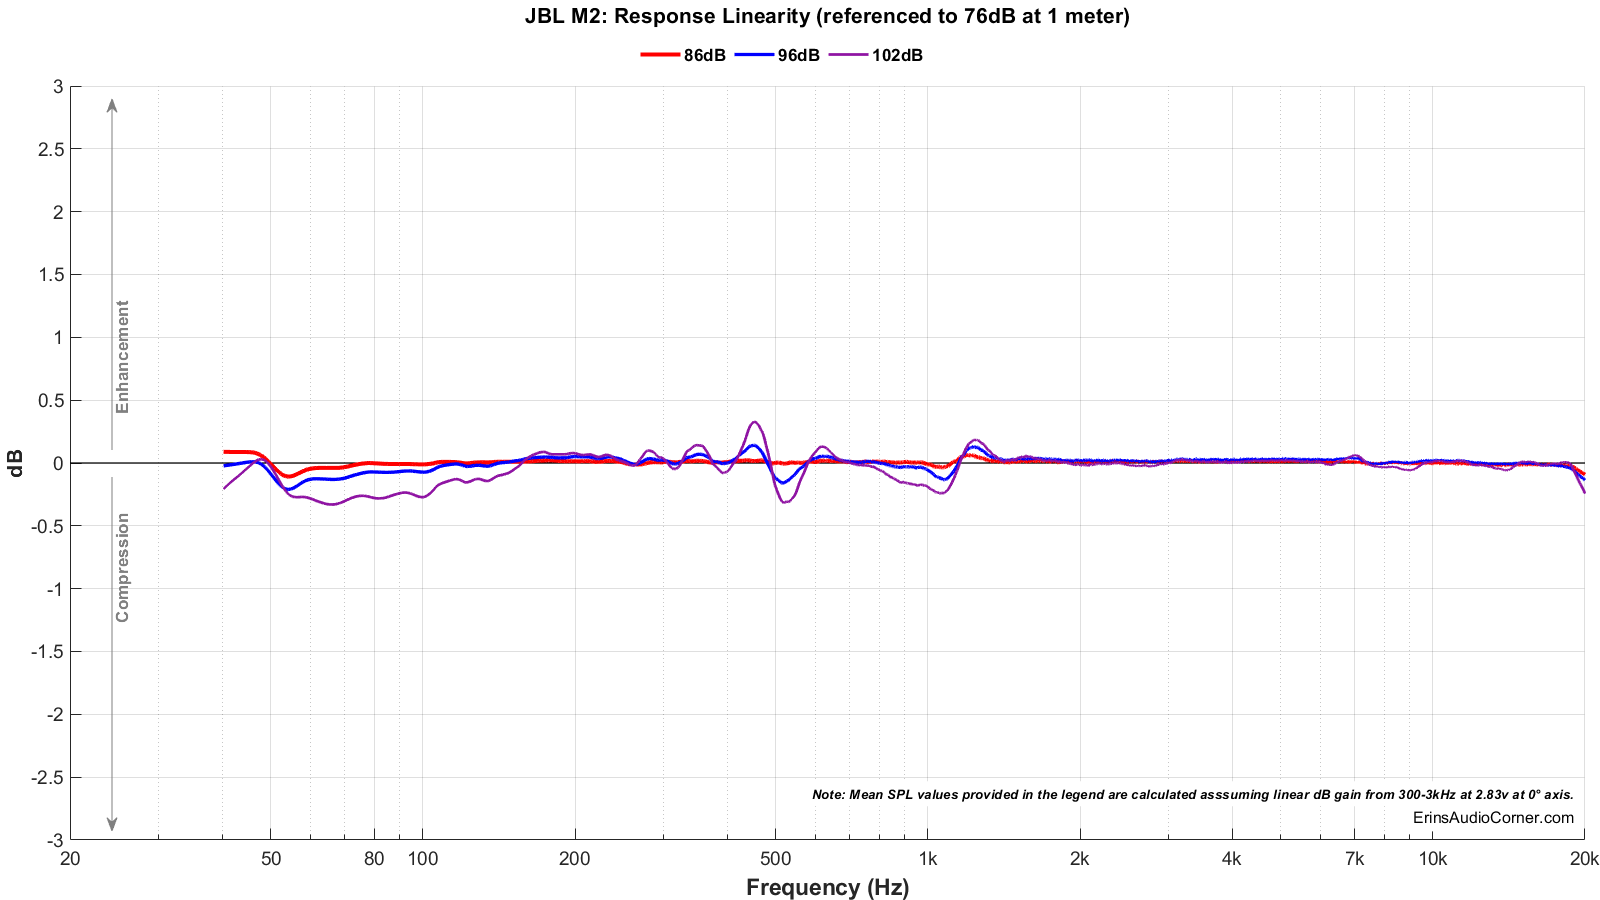
The below graphic indicates just how much SPL is lost (compression) or gained (enhancement; usually due to distortion) when the speaker is played at higher output volumes instantly via a 2.7 second logarithmic sine sweep referenced to 76dB at 1 meter. The signals are played consecutively without any additional stimulus applied. Then normalized against the 76dB result.
The tests are conducted in this fashion:
- 76dB at 1 meter (baseline; black)
- 86dB at 1 meter (red)
- 96dB at 1 meter (blue)
- 102dB at 1 meter (purple)
The purpose of this test is to illustrate how much (if at all) the output changes as a speaker’s components temperature increases (i.e., voice coils, crossover components) instantaneously.
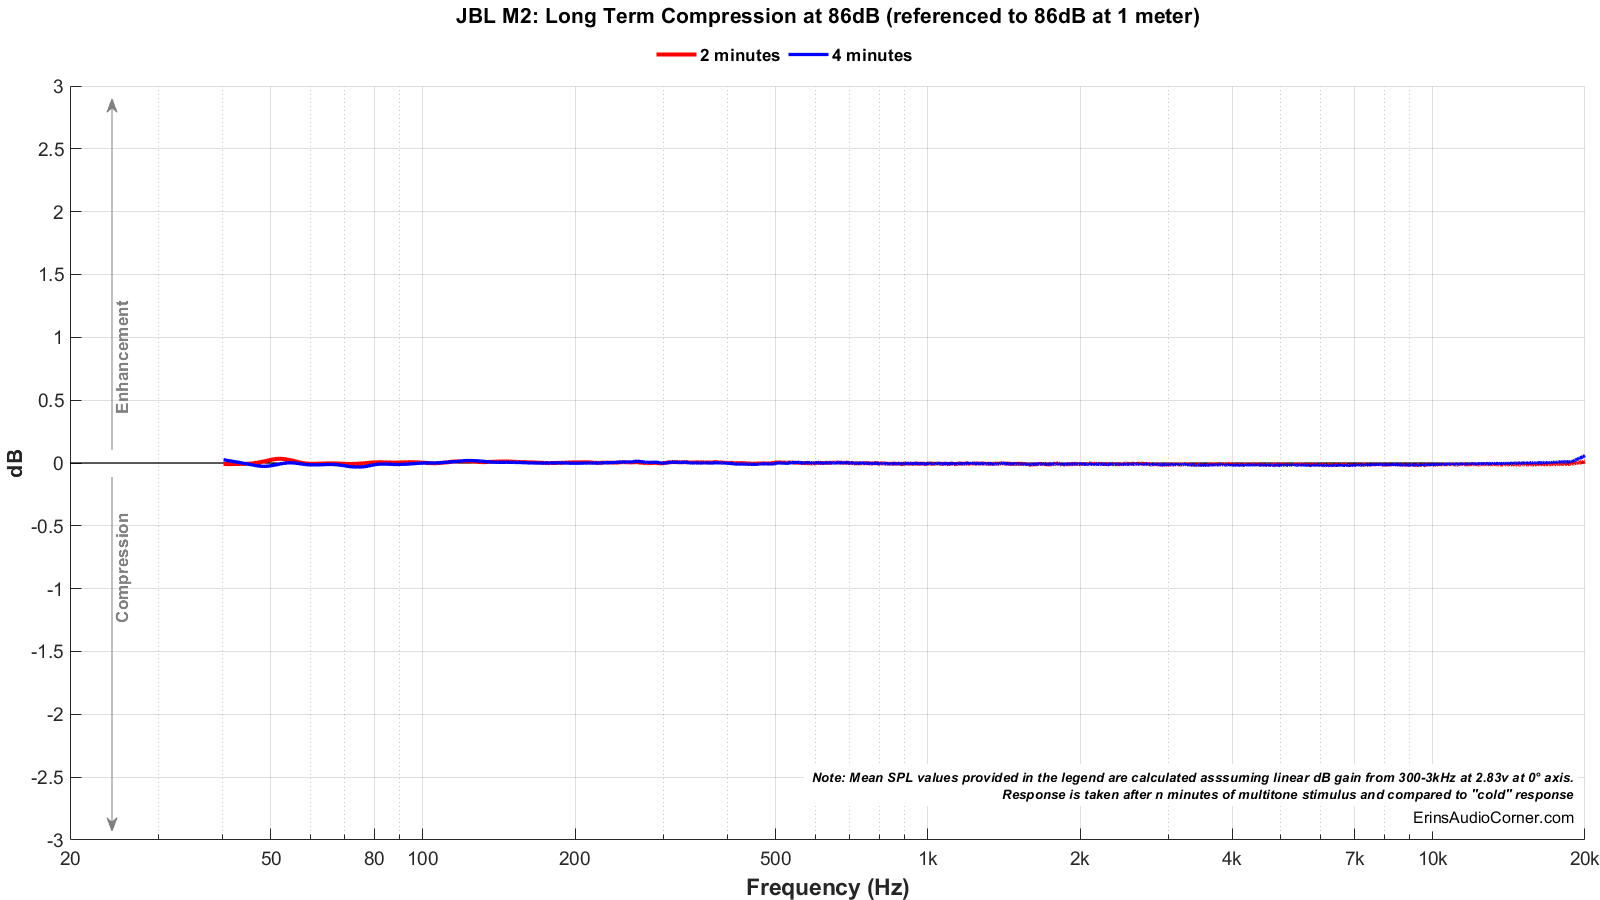
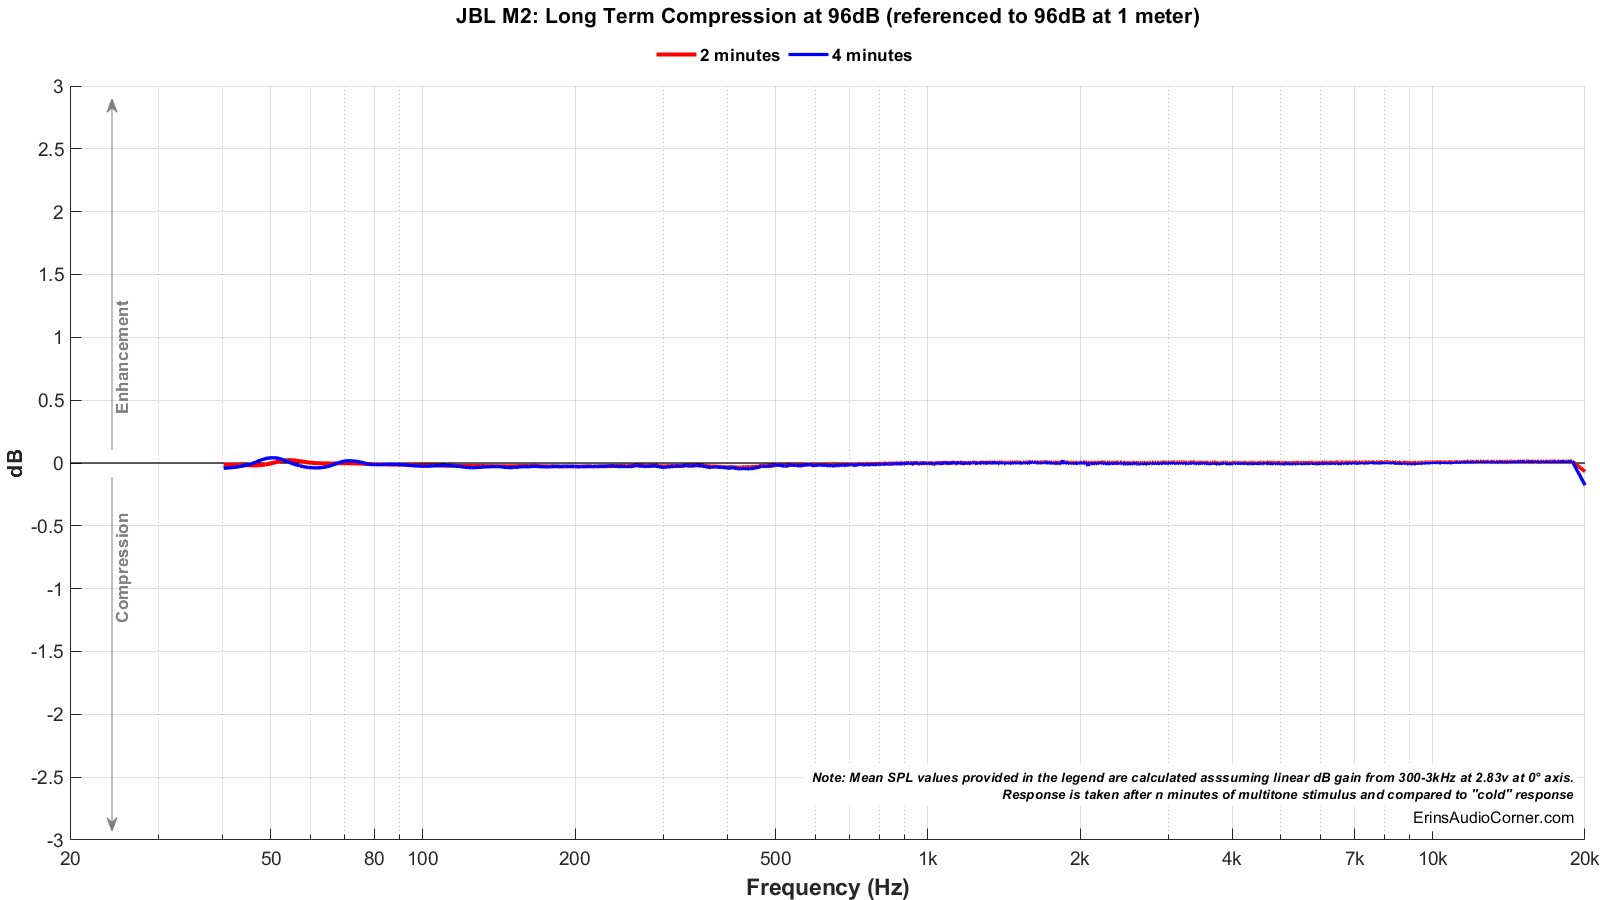
Long Term Compression Tests
The below graphics indicate how much SPL is lost or gained in the long-term as a speaker plays at the same output level for 2 minutes, in intervals. Each graphic represents a different SPL: 86dB and 96dB both at 1 meter.
The purpose of this test is to illustrate how much (if at all) the output changes as a speaker’s components temperature increases (i.e., voice coils, crossover components).
The tests are conducted in this fashion:
- “Cold” logarithmic sine sweep (no stimulus applied beforehand)
- Multitone stimulus played at desired SPL/distance for 2 minutes; intended to represent music signal
- Interim logarithmic sine sweep (no stimulus applied beforehand) (Red in graphic)
- Multitone stimulus played at desired SPL/distance for 2 minutes; intended to represent music signal
- Final logarithmic sine sweep (no stimulus applied beforehand) (Blue in graphic)
The red and blue lines represent changes in the output compared to the initial “cold” test.
Parting / Random Thoughts
If you don’t care about my subjective evaluation because it is sighted, you might be interested in this thread over on AVSforum where John Schuermann (owner of The Screening Room A/V in Colorado Springs, CO) hosted a double-blind comparison listening test between the JBL M2 and the Revel Salon2 speakers. It’s a lengthy thread but there are some real gems in there with discussion from the panelists as well as from Dr. Floyd Toole. The results discussion starts here.
If you want to see the music I use for evaluating speakers subjectively, see my Spotify playlist.
- Subjective listening was mainly in the farfield at 3-4 meters in an open floorplan living room. Subjective listening was conducted at 80-95dB at these distances and occasionally higher. Higher volumes were done simply to test the output capability in case one wants to try to sit further away. I only had a single unit to test (the one barely fit in my car; two was out of the question).
- In my listening sessions, I didn’t have any complaints other than when listening at high volume. I found, in those cases, that the treble was a bit too bright and would likely be better served by being dropped about 1 or 2dB. The flipside to this, though, is I believe this little bit of treble bump gives some detail to music at lower volume levels. So, that’s a preference thing.
- There is a series of resonances in the midrange that looks concerning in the data. In fact, that is why I went through the trouble of removing the woofer from the enclosure and testing; so I could try to find where the fault was. As I mentioned earlier, I found a resonance in the enclosure at around 270Hz and another resonance in the woofer which was responsible for a 3dB dip from about 400-600Hz. Objectively, the dip doesn’t concern me as much the series of resonances in the 200-300Hz region. However, even though I knew these resonances were there, they were not audible to me in my listening tests. That could simply be too low in amplitude as they are only about +1.5dB above the mean in this region. It could be that the room is so dominant of the sound in this frequency. It could be a combination. While I am it, I’ll also note that JBL’s own specification sheet for the 2216Nd (link) shows the same woofer resonance. Additionally, the JBL 4367 (which uses a modified woofer 2216Nd-1) exhibits a more clean response in this area. It seems JBL fixed this resonance - likely a surround/cone edge resonance - in 2216Nd-1 version.
- The bandwidth this speaker covers makes it immensely enjoyable. Synth drums and snares sound incredible because not only are they neutral but they have weight that most other speakers do not provide because they lack the low frequency extension of the M2.
- The horizontal radiation pattern is surprisingly wide through the midrange. I typically find the more horn-like waveguided designed speakers have a rather narrow horizontal dispersion. When I say “narrow”, I am generalizing here at about ±30°. In the case of the M2, however, that coverage pattern is about ±60° up through about 8-9kHz where the dispersion begins to narrow and ultimately beams above about 12kHz.
- The vertical radiation pattern essentially the same as the horizontal except for at the crossover where you can see the suckout at about 800Hz. This suckout drops the vertical radiation from ±50° to about ±20°. Luckily, the crossover network incorporates relatively steep slopes so this dip is managed relatively well and recovers by 900Hz.
- Not just is the radiation pattern relatively wide, it is also very consistent. I would consider this a “constant” directivity as opposed to simply “controlled” directivity. And it stays in constant directivity from about 700Hz to about 8kHz (as mentioned above). This is really quite interesting and should translate to a wide and (most importantly) consistent soundstage where instruments’ fundamental and harmonic tones originate from the same point in space.
- I had this speaker paired up to two different configurations (the OEM Crown amp as well as another option) and I did not notice any hiss from the speaker at my listening position. In fact, the only issue I had in the realm of noise was from the fans of I-TECH 5000 amplifier. I was warned by the owner and others that the fans on this amplifier were quite loud. I’ve owned a number of pro-audio amplifiers over the years (from QSC to Crown to Behringer). The I-TECH amp is so loud that I had to cover it in a pile of blankets just to get it subdued enough in level to not annoy me while conducting my listening tests. For my Klippel testing, I had to actually run a long set of cables to place the amp in another room entirely and close the door; otherwise, the amplifier was so loud it literally would corrupt the measurements. I’m really surprised JBL would sell this speaker with such a noisy (fan) amplifier. Or, at least, without a temperature regulated fan. But maybe one of the other amplifier options would not be so bad.
This speaker pretty much checks all the boxes I can imagine most would want:
- Wide radiation pattern that is not just controlled but constant through a very wide bandwidth
- Very neutral on-axis response (with some exception to the midrange resonances discussed above)
- Extremely high output capability and flat down to about 30Hz (with in-room response likely extending lower)
- Practically no compression (and I imagine nearly anyone’s ears would give out before compression was even remotely an issue)
I now understand the “hype” over this speaker and believe it is warranted. Preferences vary so I also understand some may like a particular speaker over this one. But I get why so many love the JBL M2. I would like to be able to use these measurements to adjust some of the midrange resonances and try to see if I can flatten out the response a bit. And this speaker should have no problem taking to EQ to tailor the sound to anyone’s liking.
Support the Cause
If you like what you see here and want to help support the cause there are a few ways you can do so:
- Join my Patreon here.
- Contribute via PayPal here.
- Using my Amazon affiliate link below as it helps me gain a small commission at no additional cost to you.
Your support helps me pay for new items to test, hardware, miscellaneous items and costs of the site’s server space and bandwidth. All of which I otherwise pay out of pocket. So, if you can help chip in a few bucks, know that it is very much appreciated.
You can also join my Facebook and YouTube pages if you’d like to follow along with updates.