Foreword / YouTube Video Review
The review on this website is a brief overview and summary of the objective performance of this speaker. It is not intended to be a deep dive. Moreso, this is information for those who prefer “just the facts” and prefer to have the data without the filler. The video below has more discussion.
Information and Photos
The speaker was sent to me buy the owner; shipped directly from the retailer where he purchased it from.
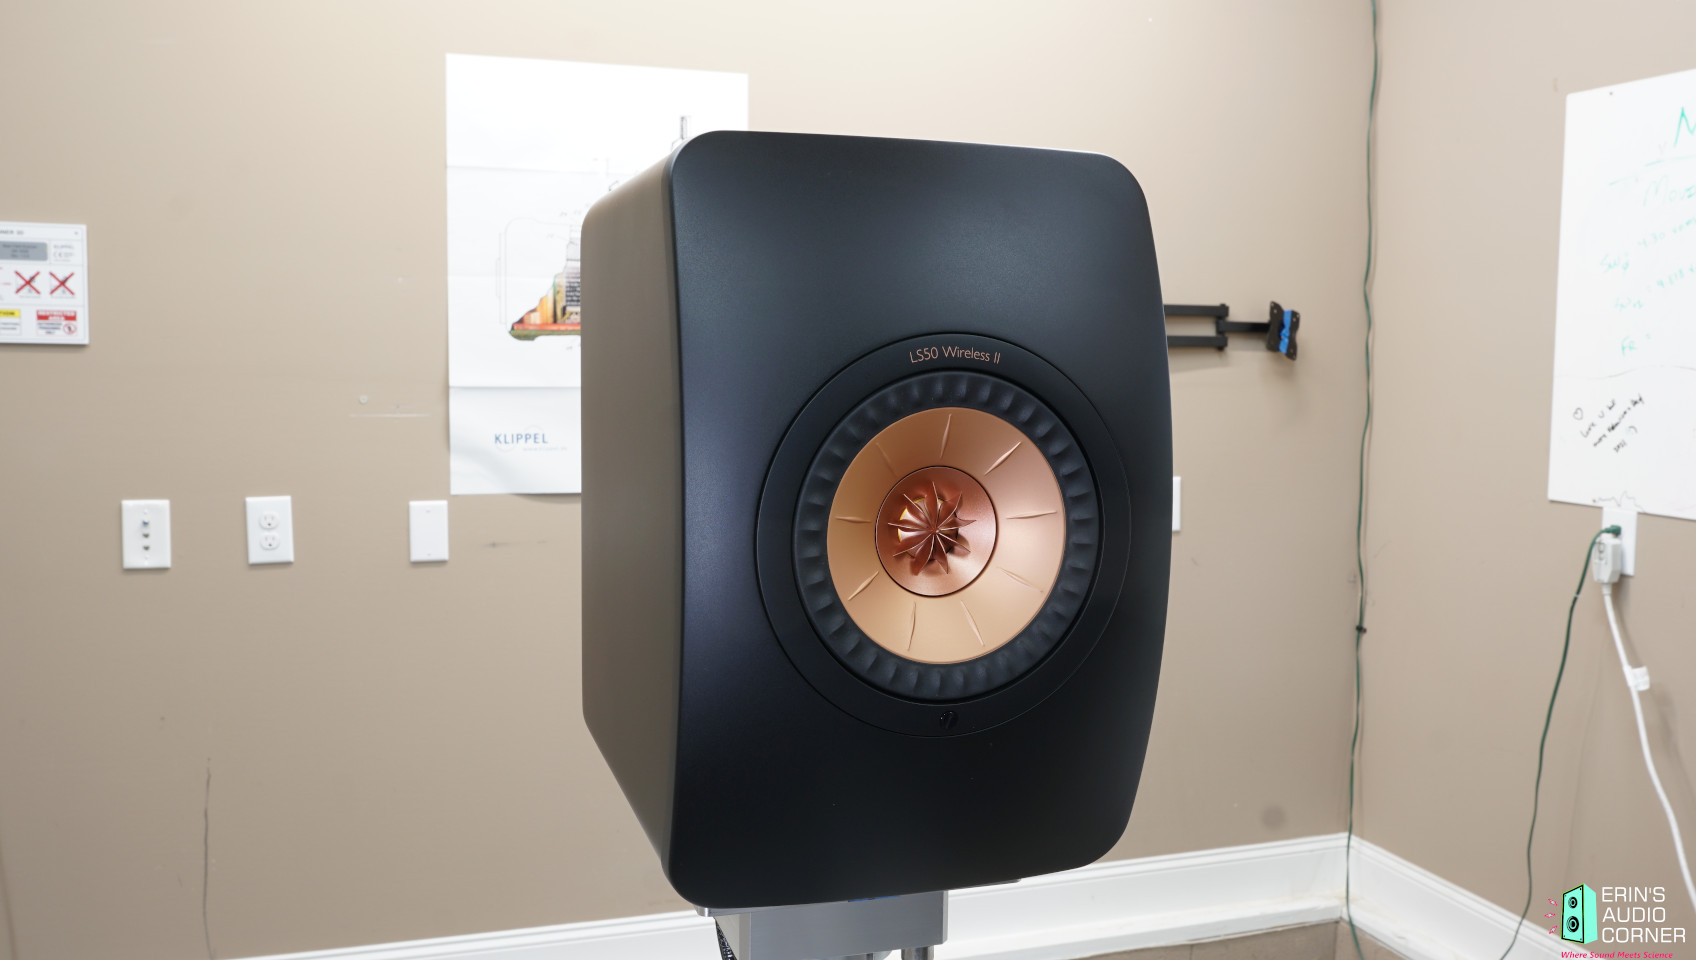
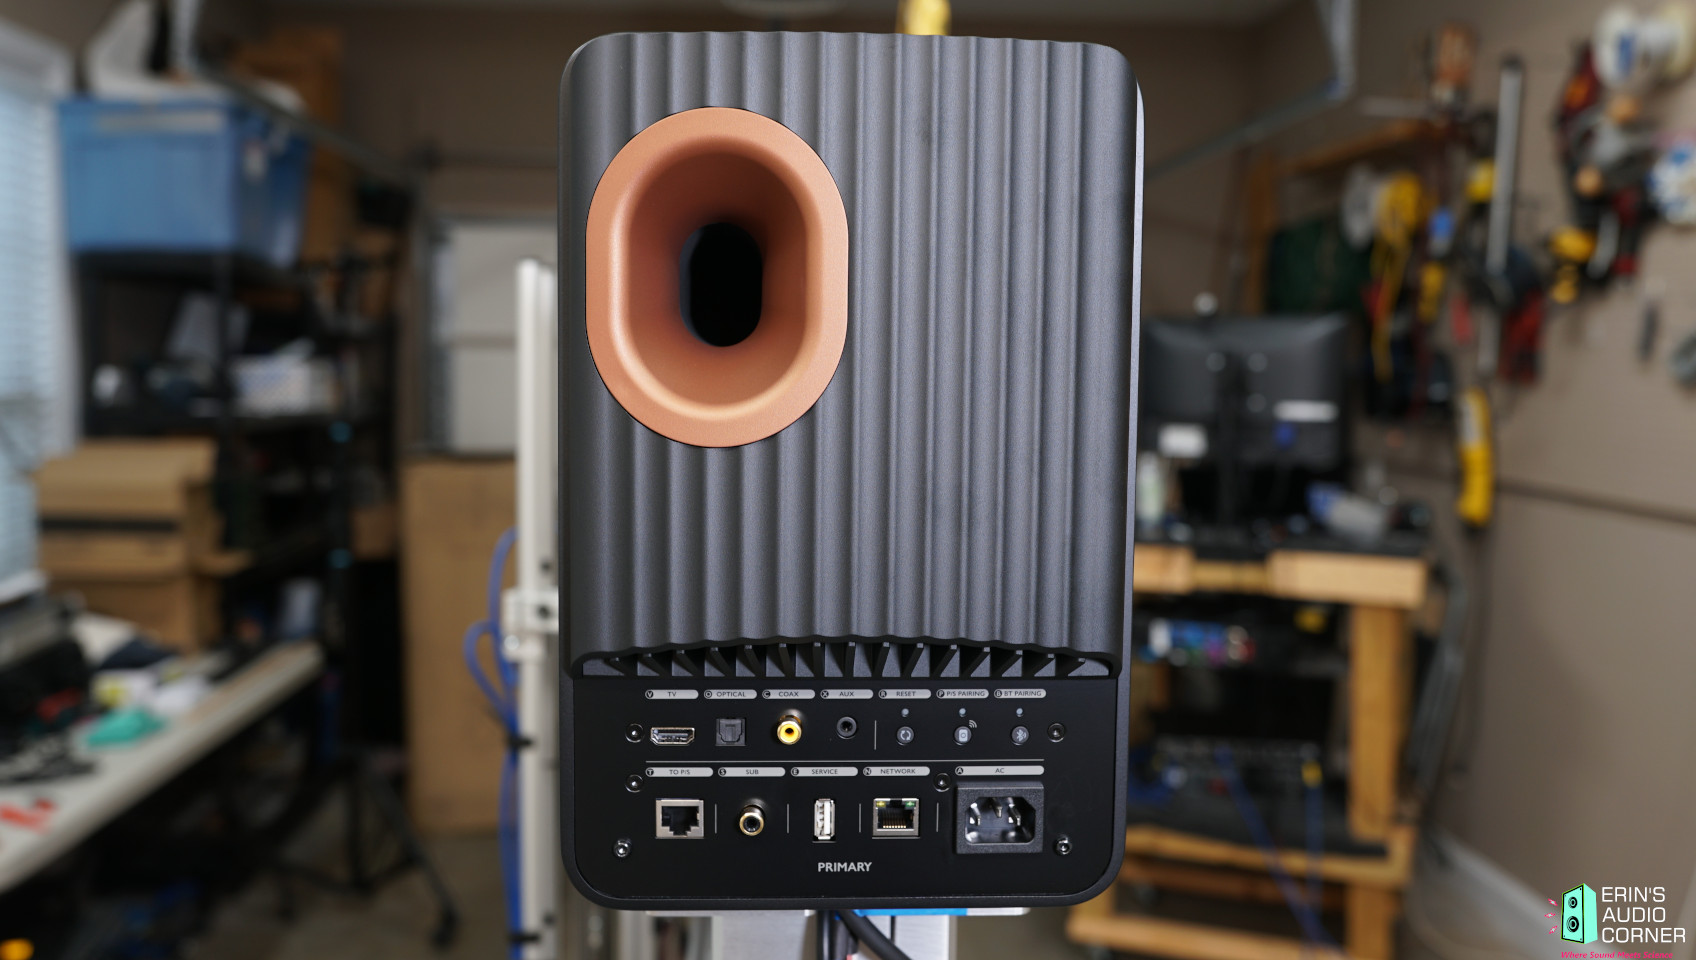
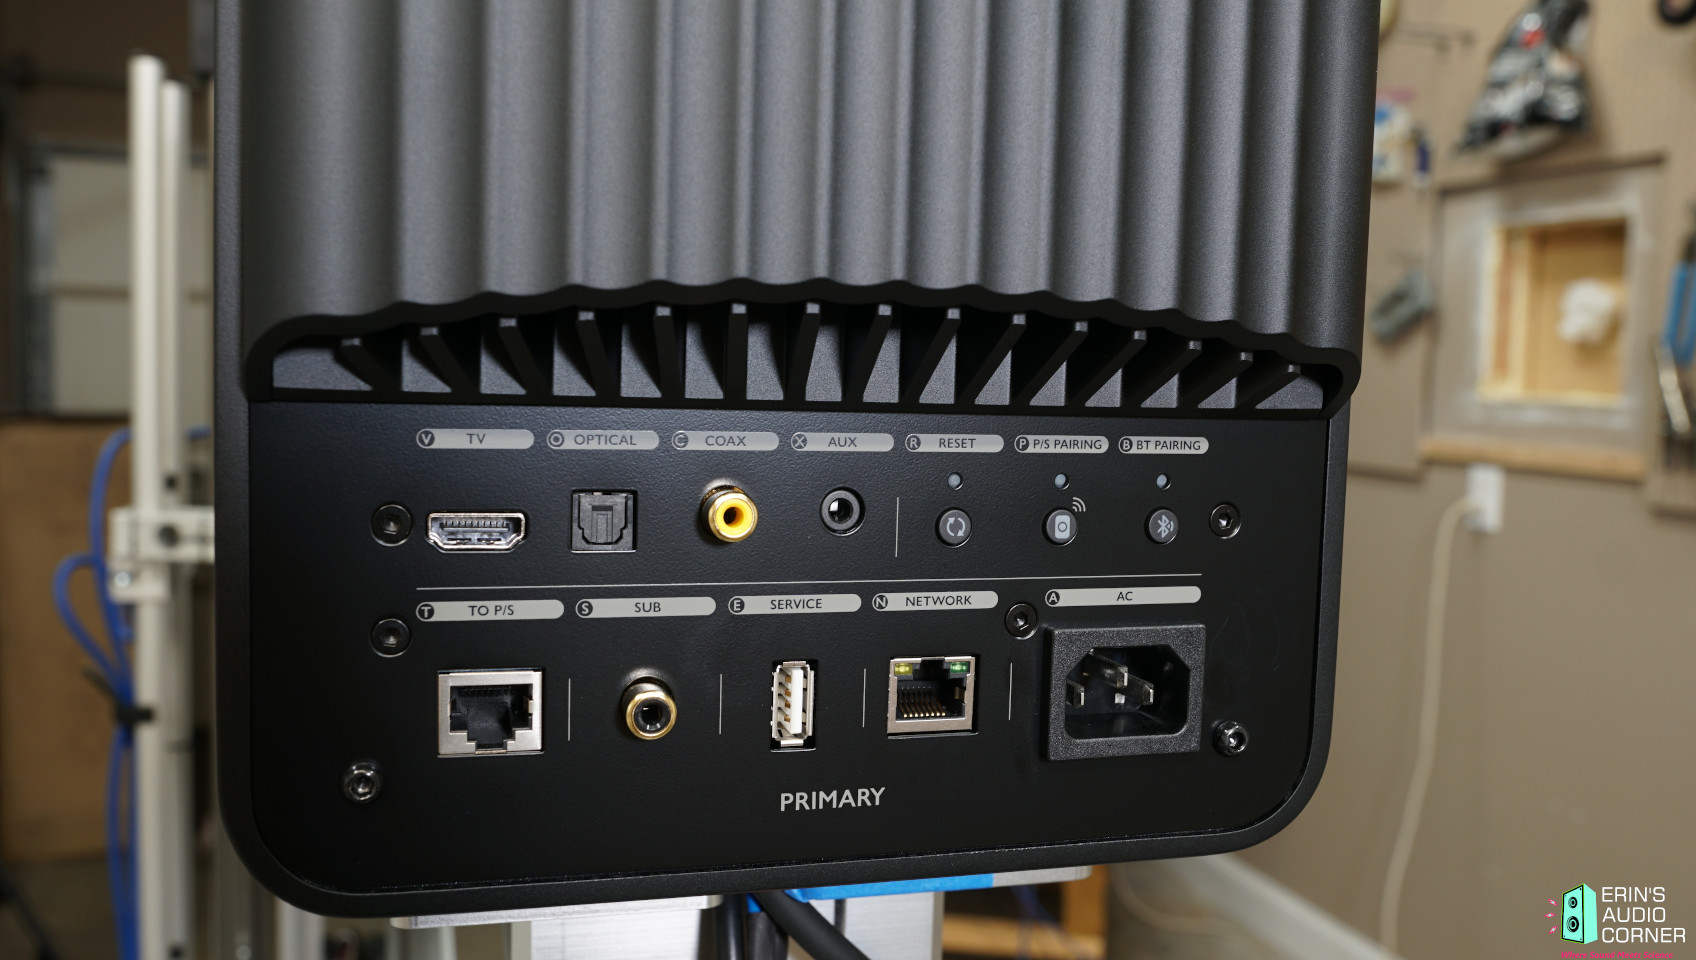
The Kef LS50 Wireless II is a compact, bookshelf-sized wireless speaker. It features a 5.25-inch concentric “Uni-Q” midrange with 1-inch tweeter and the cabinet is ported. When kept within its limits of output, I have to say that this is one of my favorite speakers. That is due in part to its sound quality but also to the incredible ease of use. While it does feature a number of input options such as HDMI eARC, TOSLINK Optical, Digital Coaxial, Analog 3.5mm Auxiliary and RJ45 ethernet for network connection, my favorite part is the wireless nature. All I needed for enjoying these speakers was to plug these in to wall-power and use my iPhone in AirPlay mode to listen to my favorite tunes. For those who don’t use Apple Music like I do, you have the option of built-in Spotify, Amazon Music, and others.
Here is a blurb from the website:
Out-of-the-box wireless compatibility with AirPlay 2, Google Chromecast and more, backed up with wired connections for your TV, turntable, CD player and games console. Whatever source you’ve got, LS50 Wireless II is ready for it. LS50 Wireless II has audiophiles covered with support for streaming music files up to 24bit/384kHz, as well as MQA, DSD256, and Roon Ready. These features mean that even the experienced hifi enthusiast will marvel at this exceptional loudspeaker’s ability.
Price is approximately $2800 USD for a pair.
CTA-2034 (SPINORAMA) and Accompanying Data
All data collected using Klippel’s Near-Field Scanner. The Near-Field-Scanner 3D (NFS) offers a fully automated acoustic measurement of direct sound radiated from the source under test. The radiated sound is determined in any desired distance and angle in the 3D space outside the scanning surface. Directivity, sound power, SPL response and many more key figures are obtained for any kind of loudspeaker and audio system in near field applications (e.g. studio monitors, mobile devices) as well as far field applications (e.g. professional audio systems). Utilizing a minimum of measurement points, a comprehensive data set is generated containing the loudspeaker’s high resolution, free field sound radiation in the near and far field. For a detailed explanation of how the NFS works and the science behind it, please watch the below discussion with designer Christian Bellmann:
Some notes about how this speaker was tested:
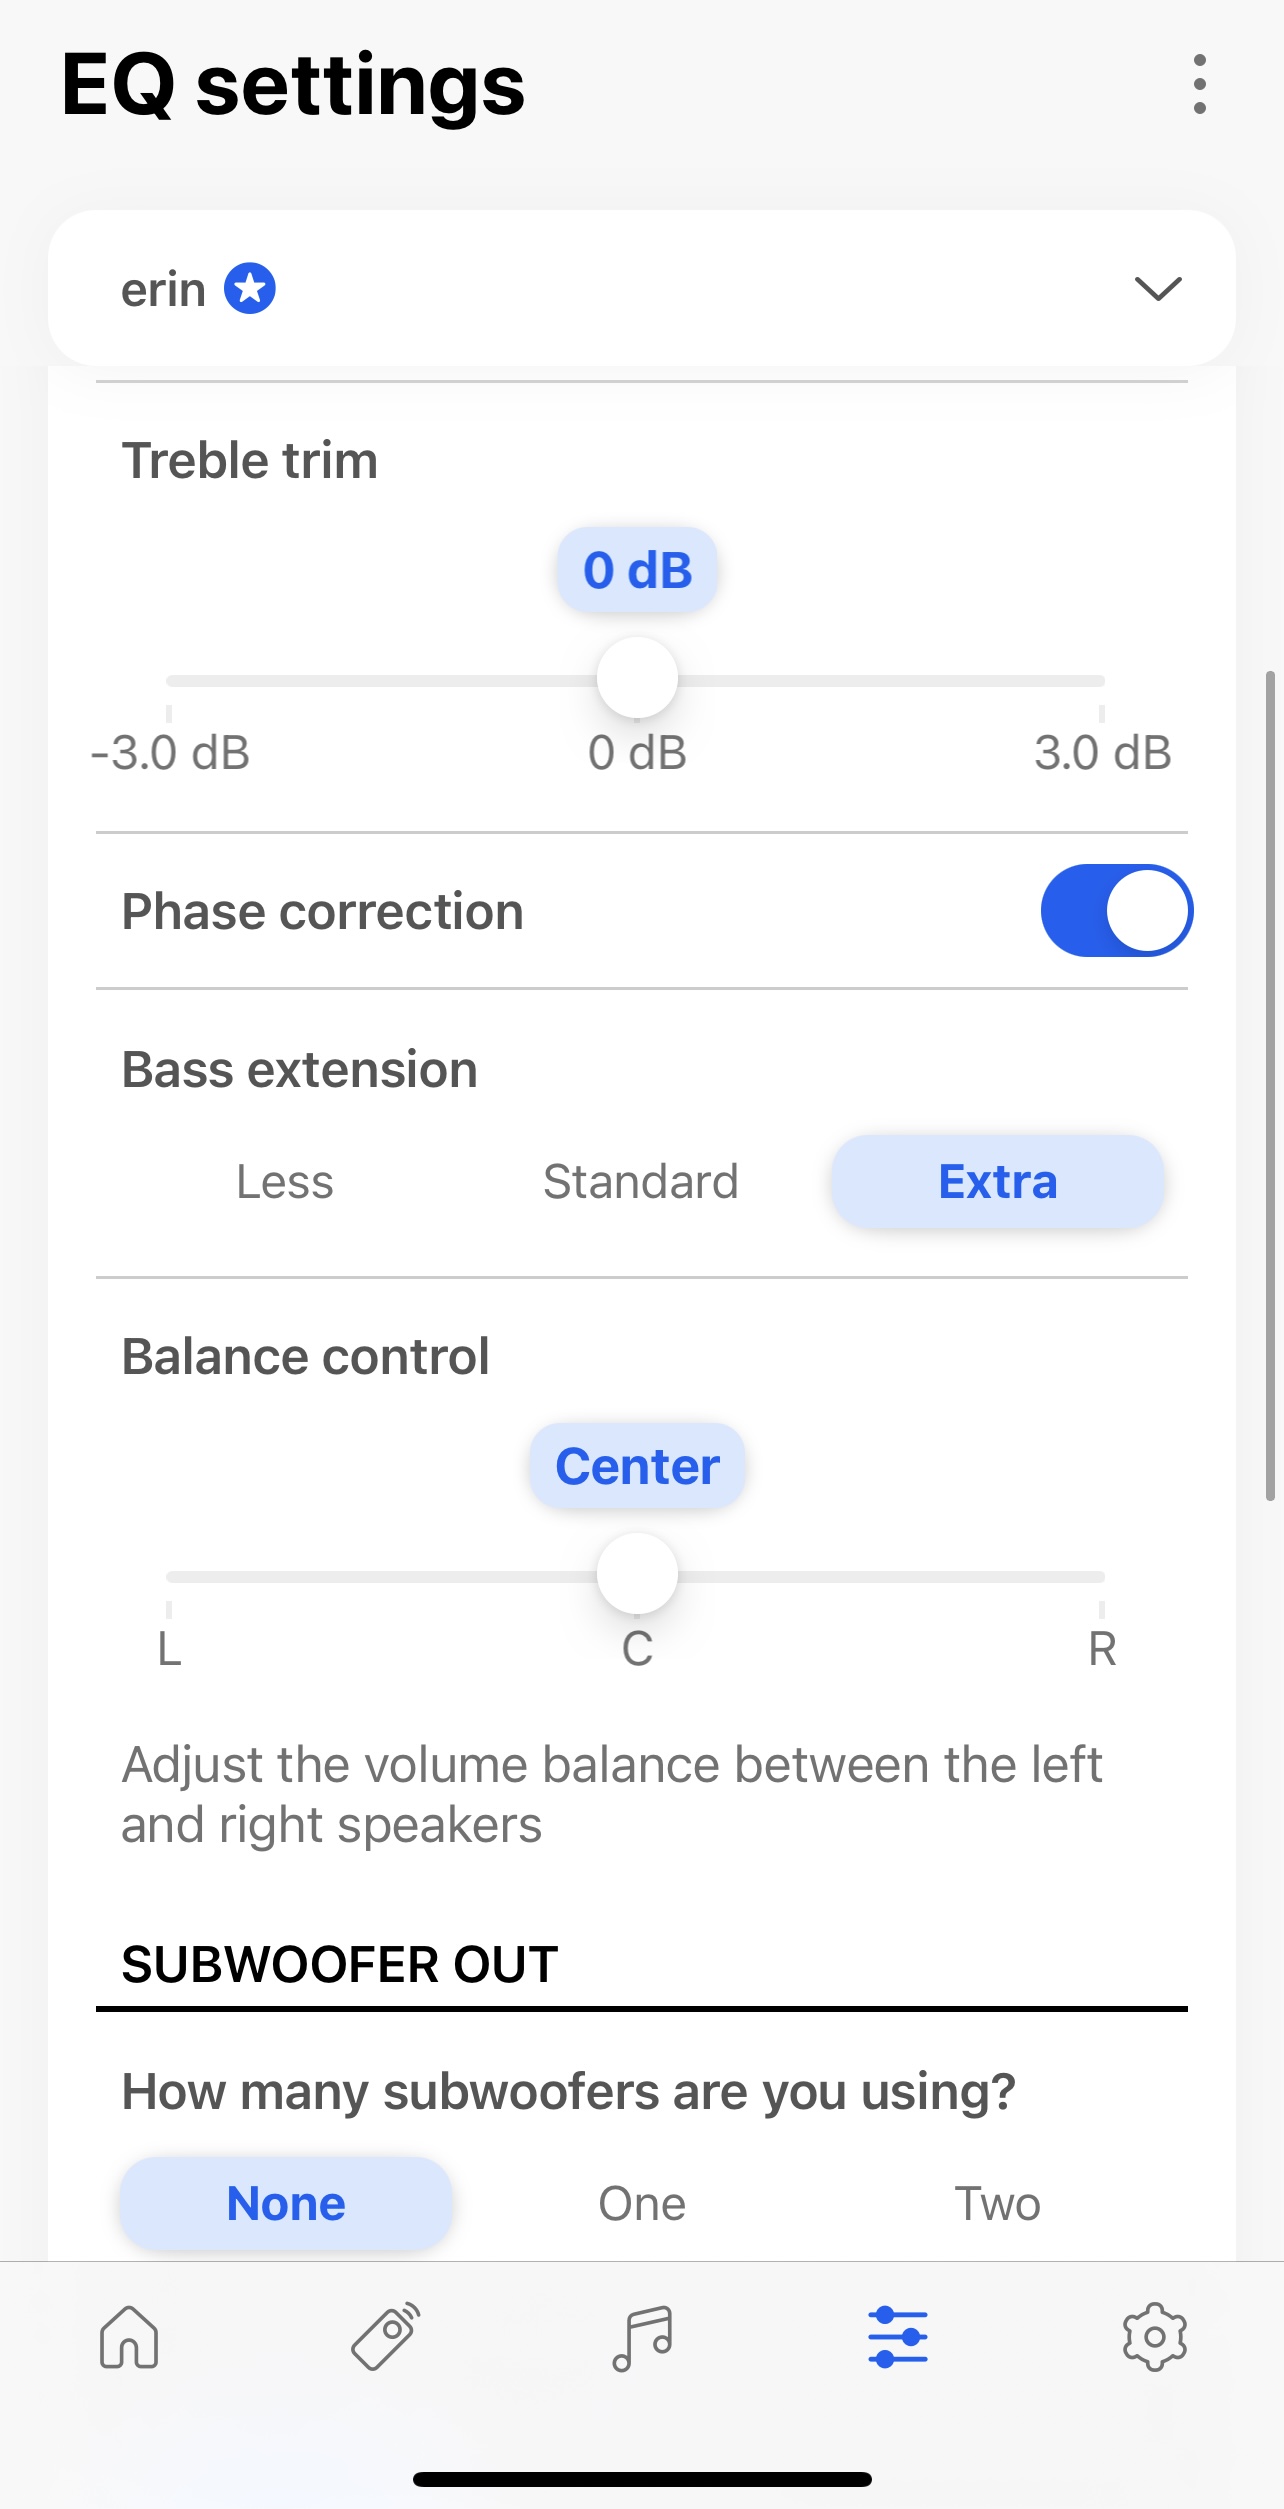
There are countless user settings available in “expert” mode. From room position to external subwoofer integration, to treble and bass extension controls. I tested a lot of these settings but my primary testing was done with the “extra” bass mode enabled but all other settings turned off. Essentially ‘default’, other than the bass extension, as shown below.
The reference plane in this test is at the tweeter/midrange.
I did perform additional testing which is all shown in later sections and clearly indicated. But, again, the CEA-2034 testing was done with the aforementioned settings.
Measurements are provided in a format in accordance with the Standard Method of Measurement for In-Home Loudspeakers (ANSI/CTA-2034-A R-2020). For more information, please see this link.
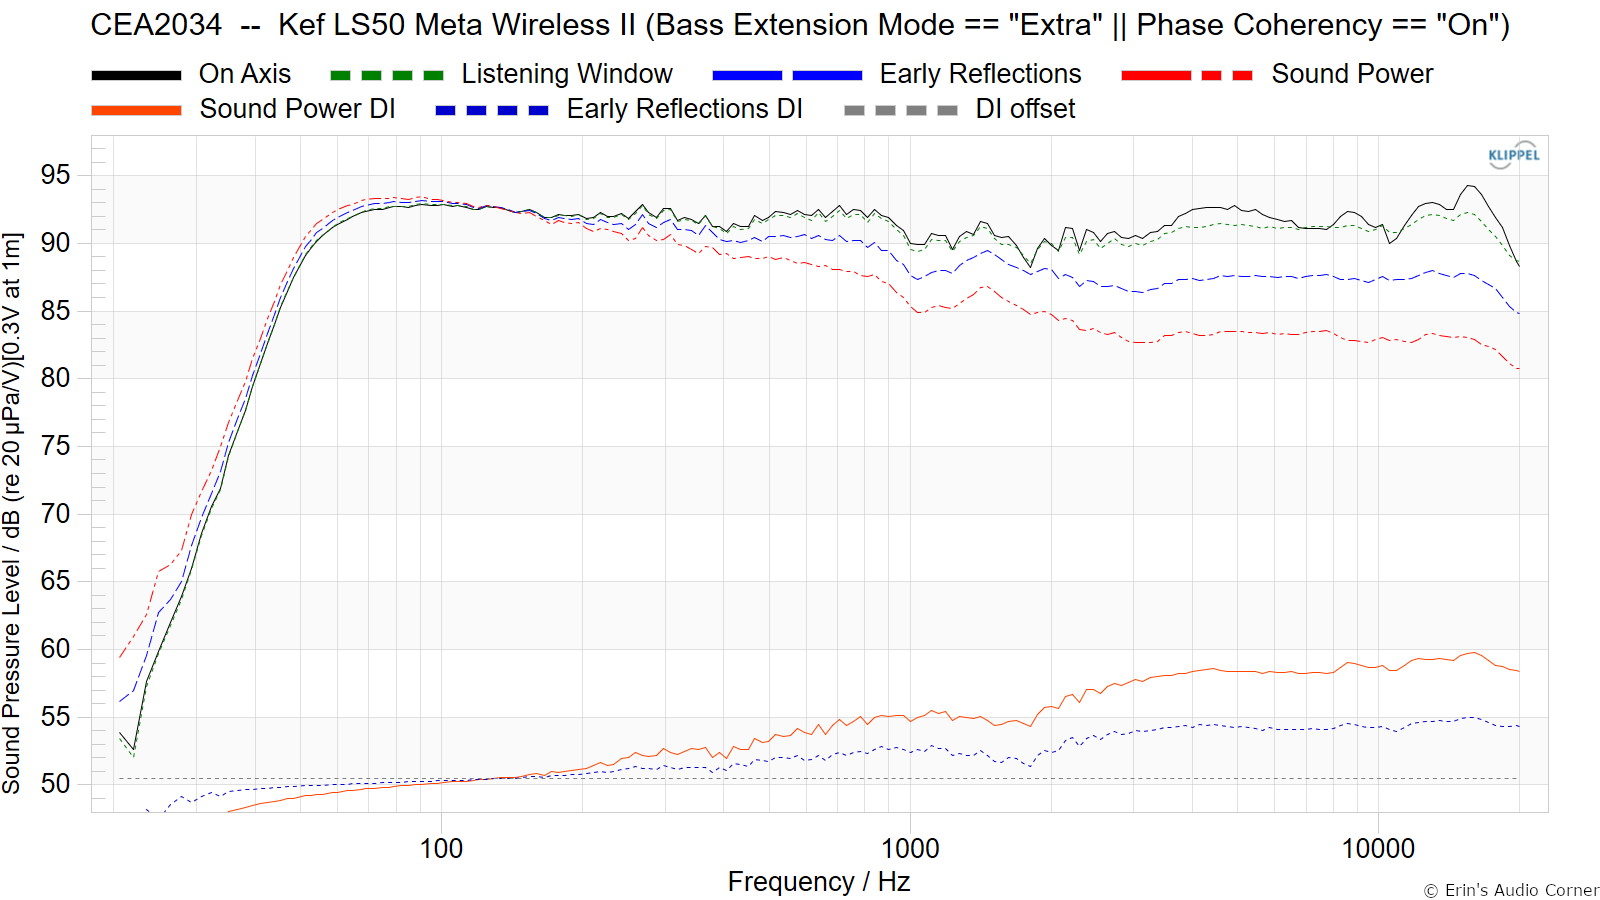
CTA-2034 / SPINORAMA:
The On-axis Frequency Response (0°) is the universal starting point and in many situations, it is a fair representation of the first sound to arrive at a listener’s ears.
The Listening Window is a spatial average of the nine amplitude responses in the ±10º vertical and ±30º horizontal angular range. This encompasses those listeners who sit within a typical home theater audience, as well as those who disregard the normal rules when listening alone.
The Early Reflections curve is an estimate of all single-bounce, first-reflections, in a typical listening room.
Sound Power represents all of the sounds arriving at the listening position after any number of reflections from any direction. It is the weighted rms average of all 70 measurements, with individual measurements weighted according to the portion of the spherical surface that they represent.
Sound Power Directivity Index (SPDI): In this standard the SPDI is defined as the difference between the listening window curve and the sound power curve.
Early Reflections Directivity Index (EPDI): is defined as the difference between the listening window curve and the early reflections curve. In small rooms, early reflections figure prominently in what is measured and heard in the room so this curve may provide insights into potential sound quality.
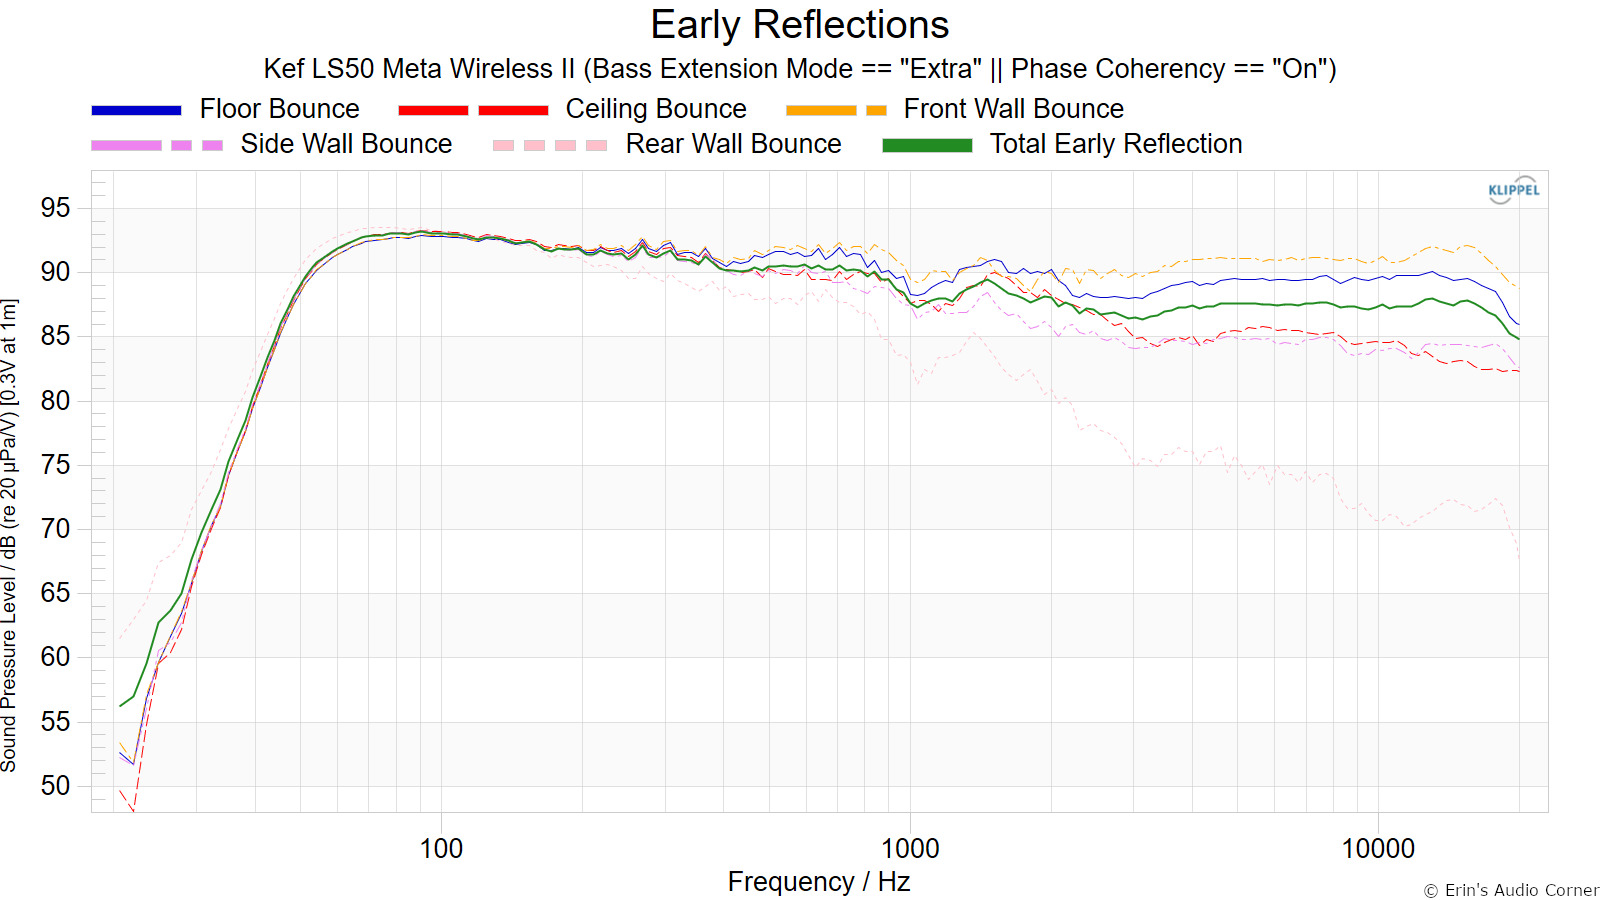
Early Reflections Breakout:
Floor bounce: average of 20º, 30º, 40º down
Ceiling bounce: average of 40º, 50º, 60º up
Front wall bounce: average of 0º, ± 10º, ± 20º, ± 30º horizontal
Side wall bounces: average of ± 40º, ± 50º, ± 60º, ± 70º, ± 80º horizontal
Rear wall bounces: average of 180º, ± 90º horizontal
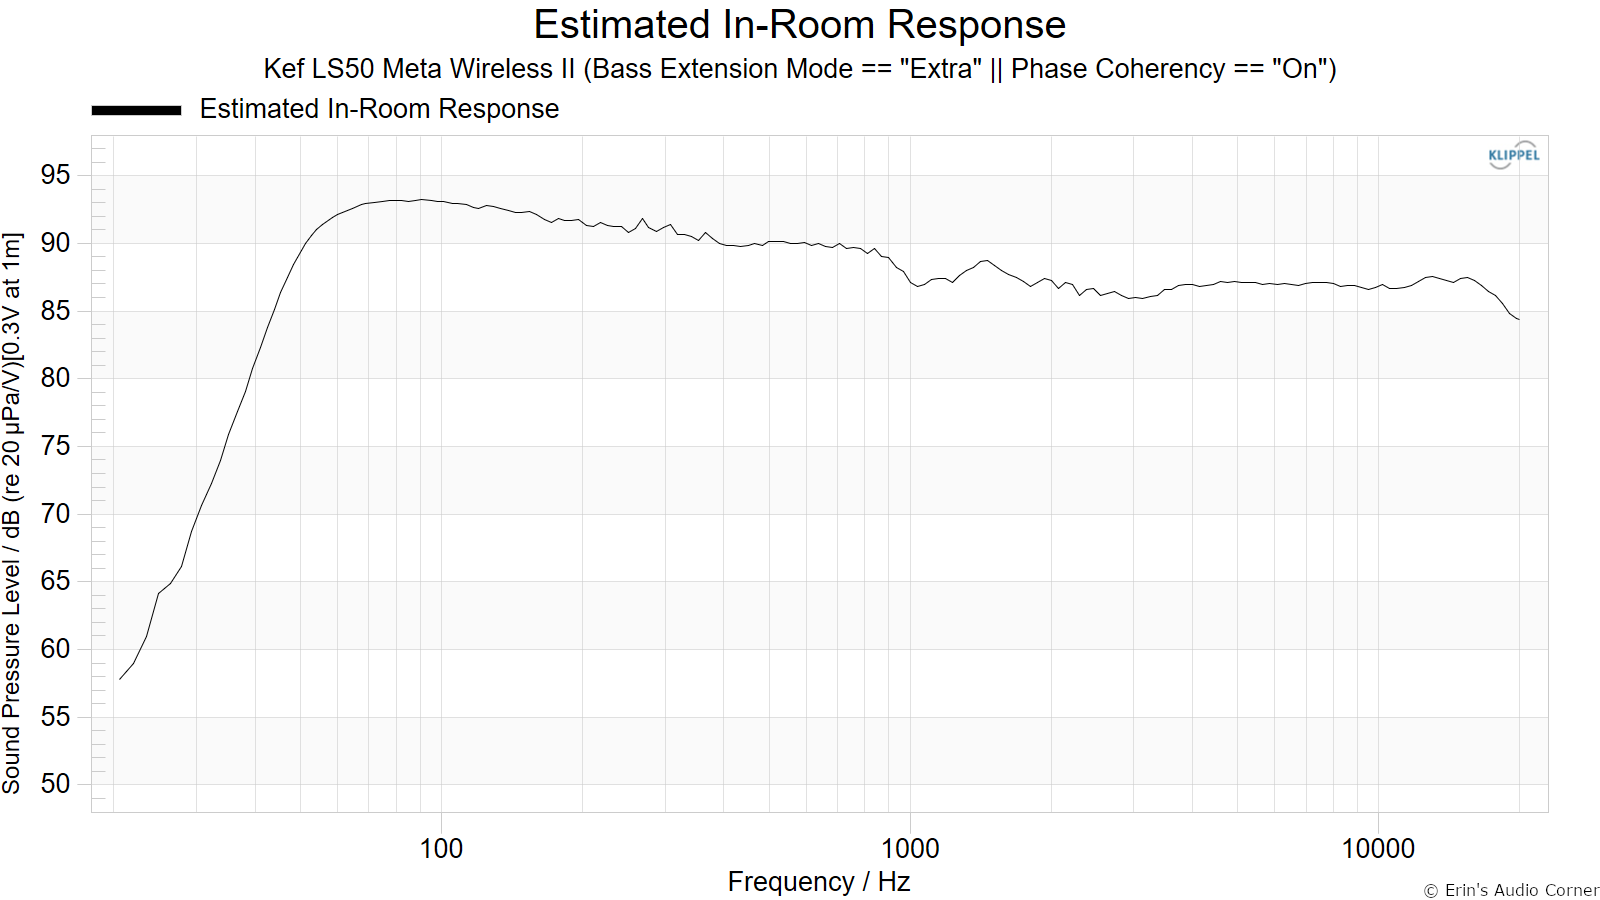
Estimated In-Room Response:
In theory, with complete 360-degree anechoic data on a loudspeaker and sufficient acoustical and geometrical data on the listening room and its layout it would be possible to estimate with good precision what would be measured by an omnidirectional microphone located in the listening area of that room. By making some simplifying assumptions about the listening space, the data set described above permits a usefully accurate preview of how a given loudspeaker might perform in a typical domestic listening room. Obviously, there are no guarantees, because individual rooms can be acoustically aberrant. Sometimes rooms are excessively reflective (“live”) as happens in certain hot, humid climates, with certain styles of interior décor and in under-furnished rooms. Sometimes rooms are excessively “dead” as in other styles of décor and in some custom home theaters where acoustical treatment has been used excessively. This form of post processing is offered only as an estimate of what might happen in a domestic living space with carpet on the floor and a “normal” amount of seating, drapes and cabinetry.
For these limited circumstances it has been found that a usefully accurate Predicted In-Room (PIR) amplitude response, also known as a “room curve” is obtained by a weighted average consisting of 12 % listening window, 44 % early reflections and 44 % sound power. At very high frequencies errors can creep in because of excessive absorption, microphone directivity, and room geometry. These discrepancies are not considered to be of great importance.
Horizontal Frequency Response (0° to ±90°):

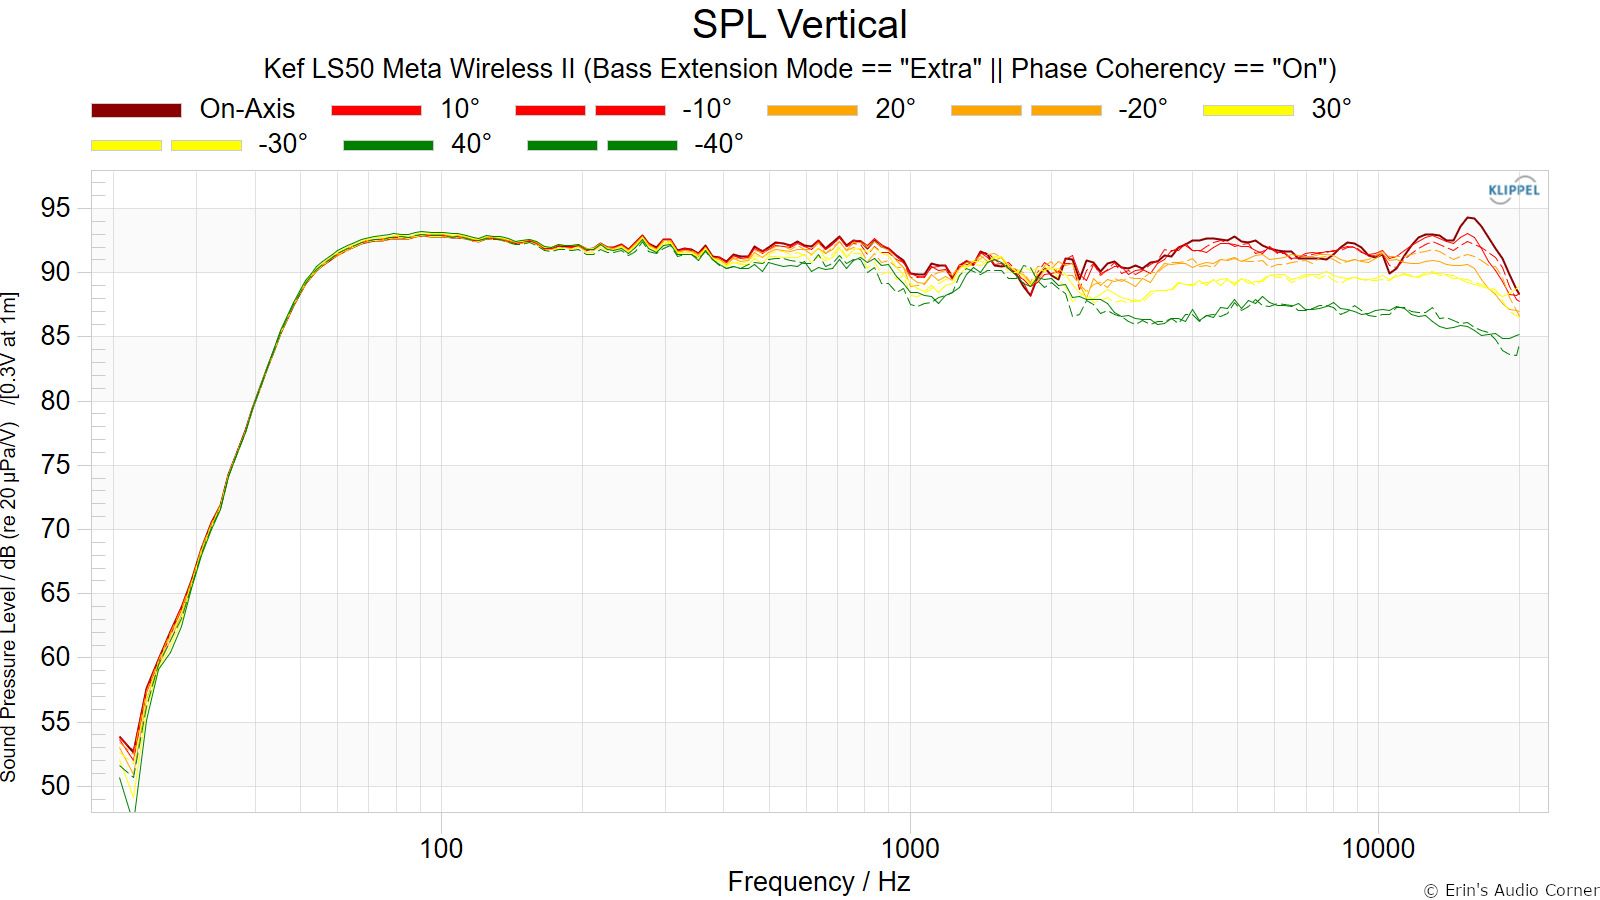
Vertical Frequency Response (0° to ±40°):
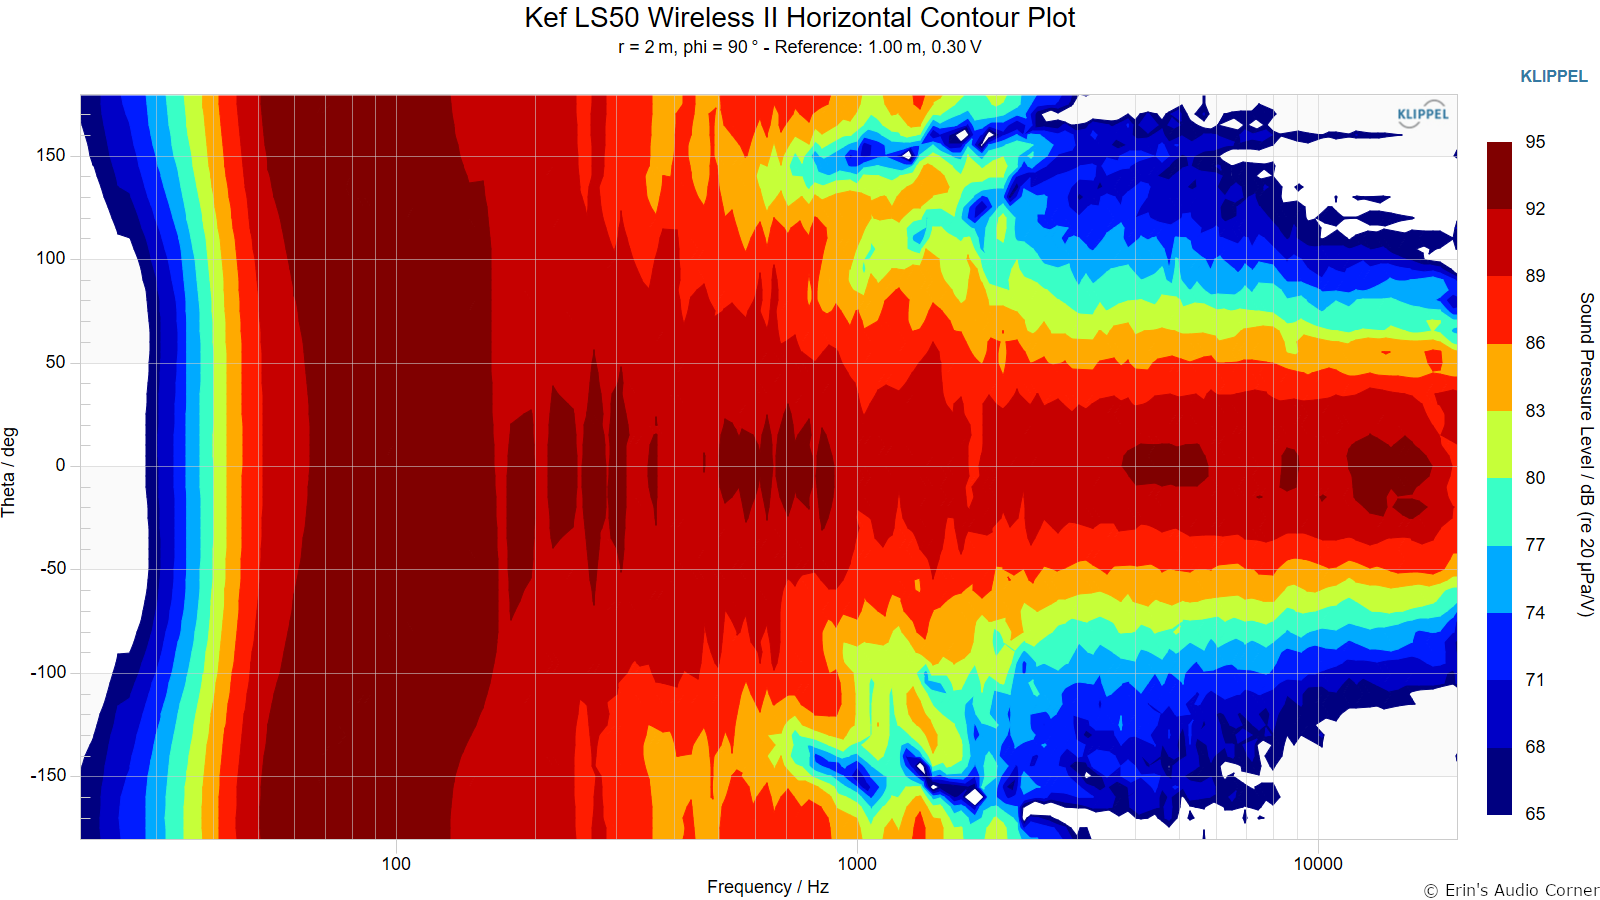
Horizontal Contour Plot (not normalized):
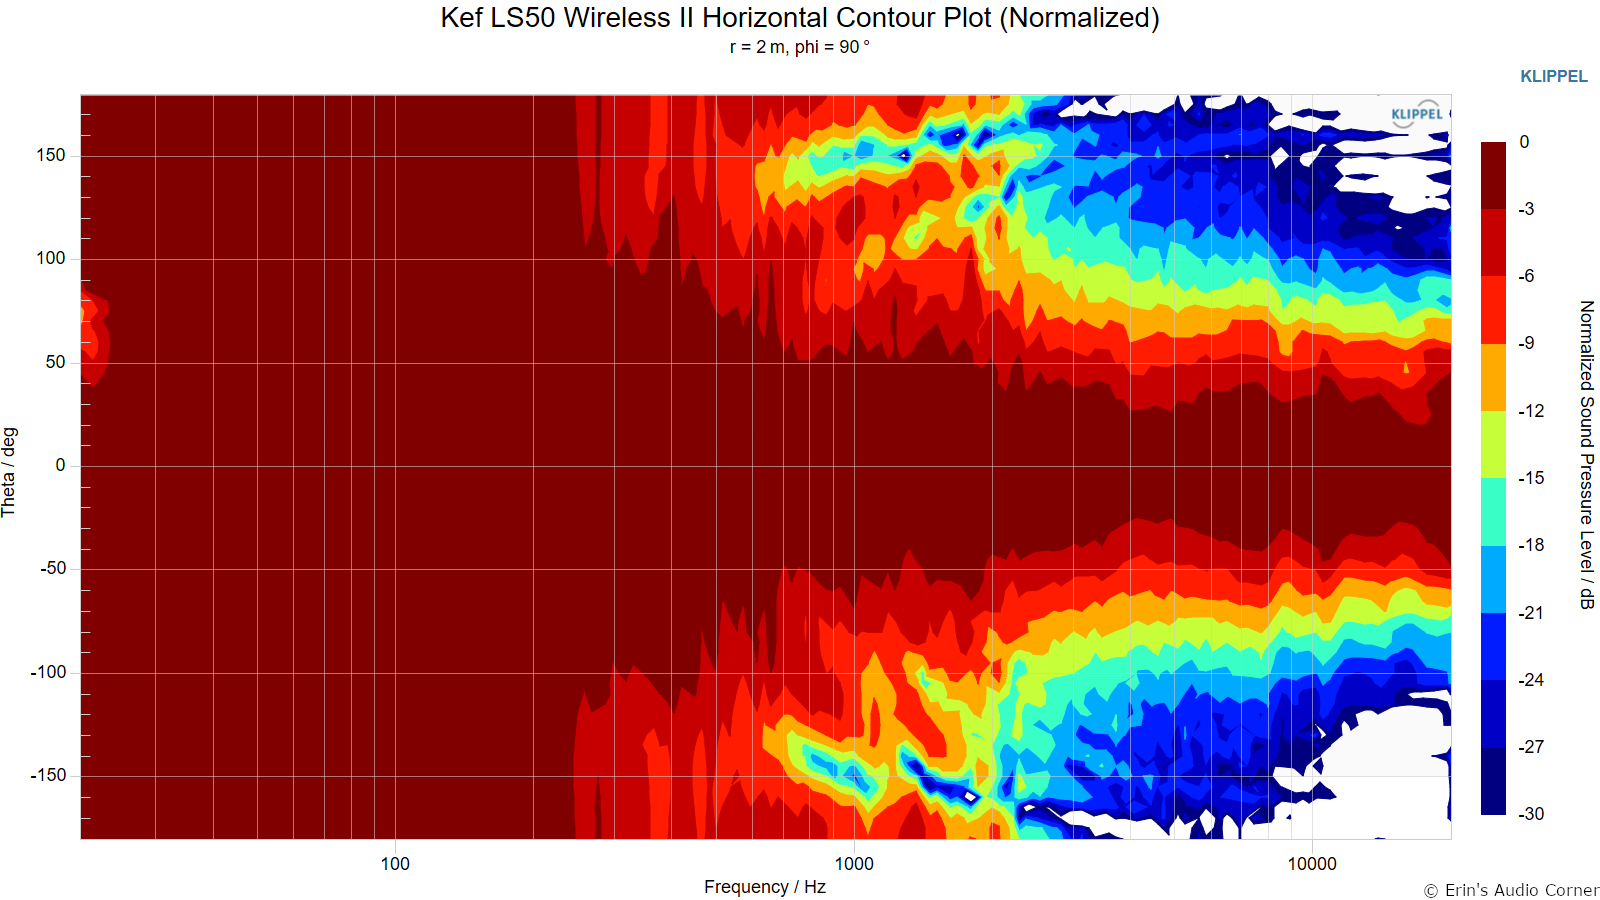
Horizontal Contour Plot (normalized):
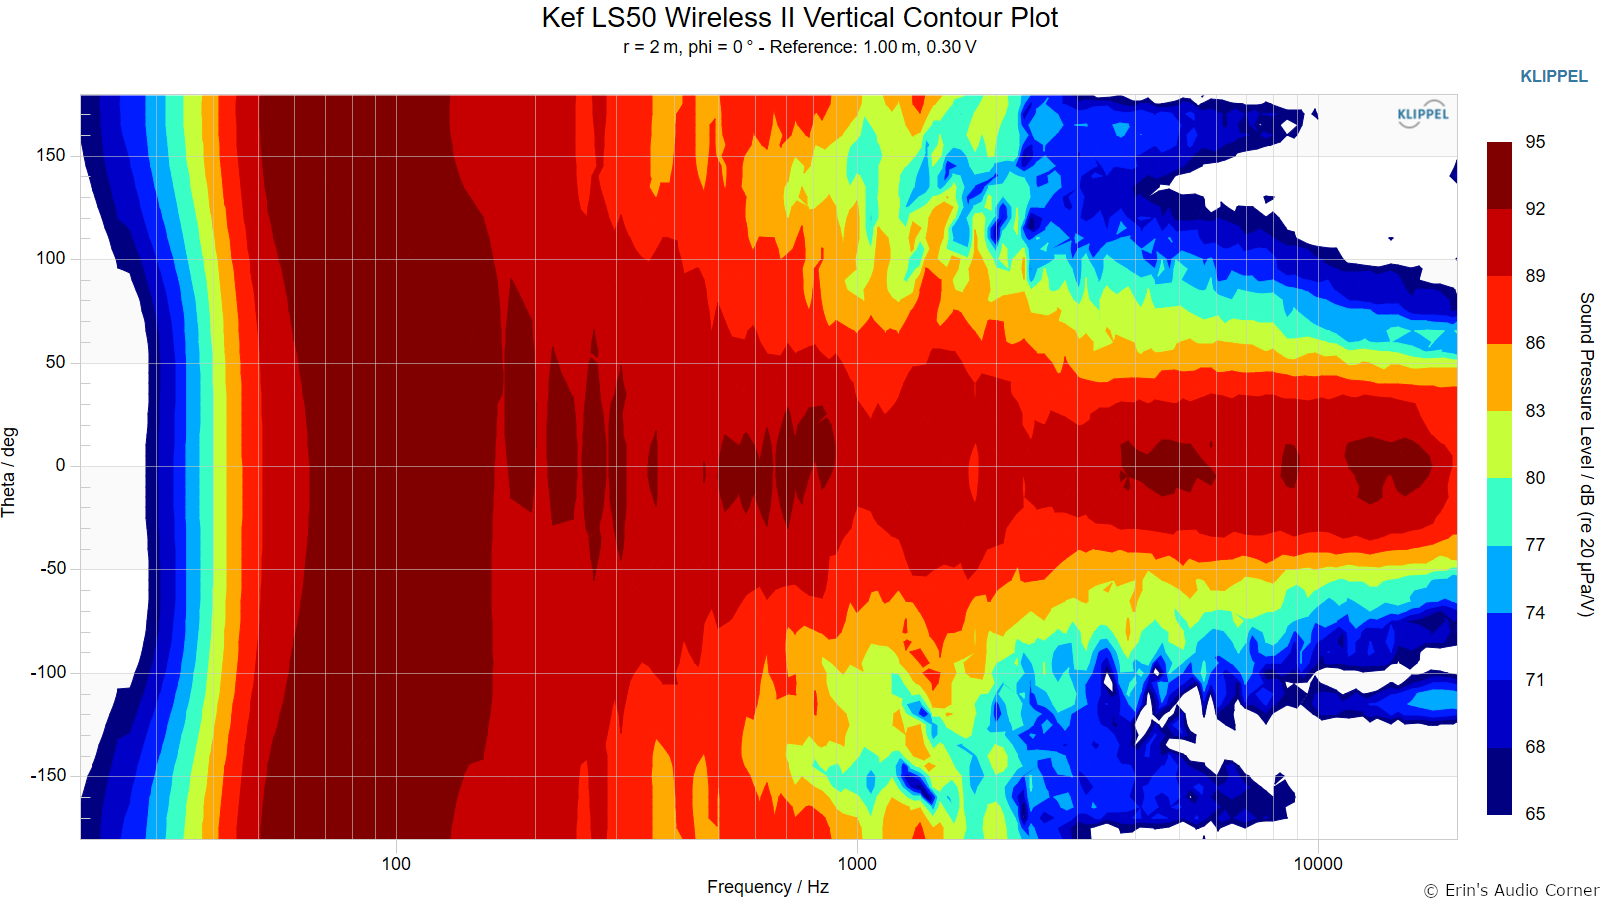
Vertical Contour Plot (not normalized):
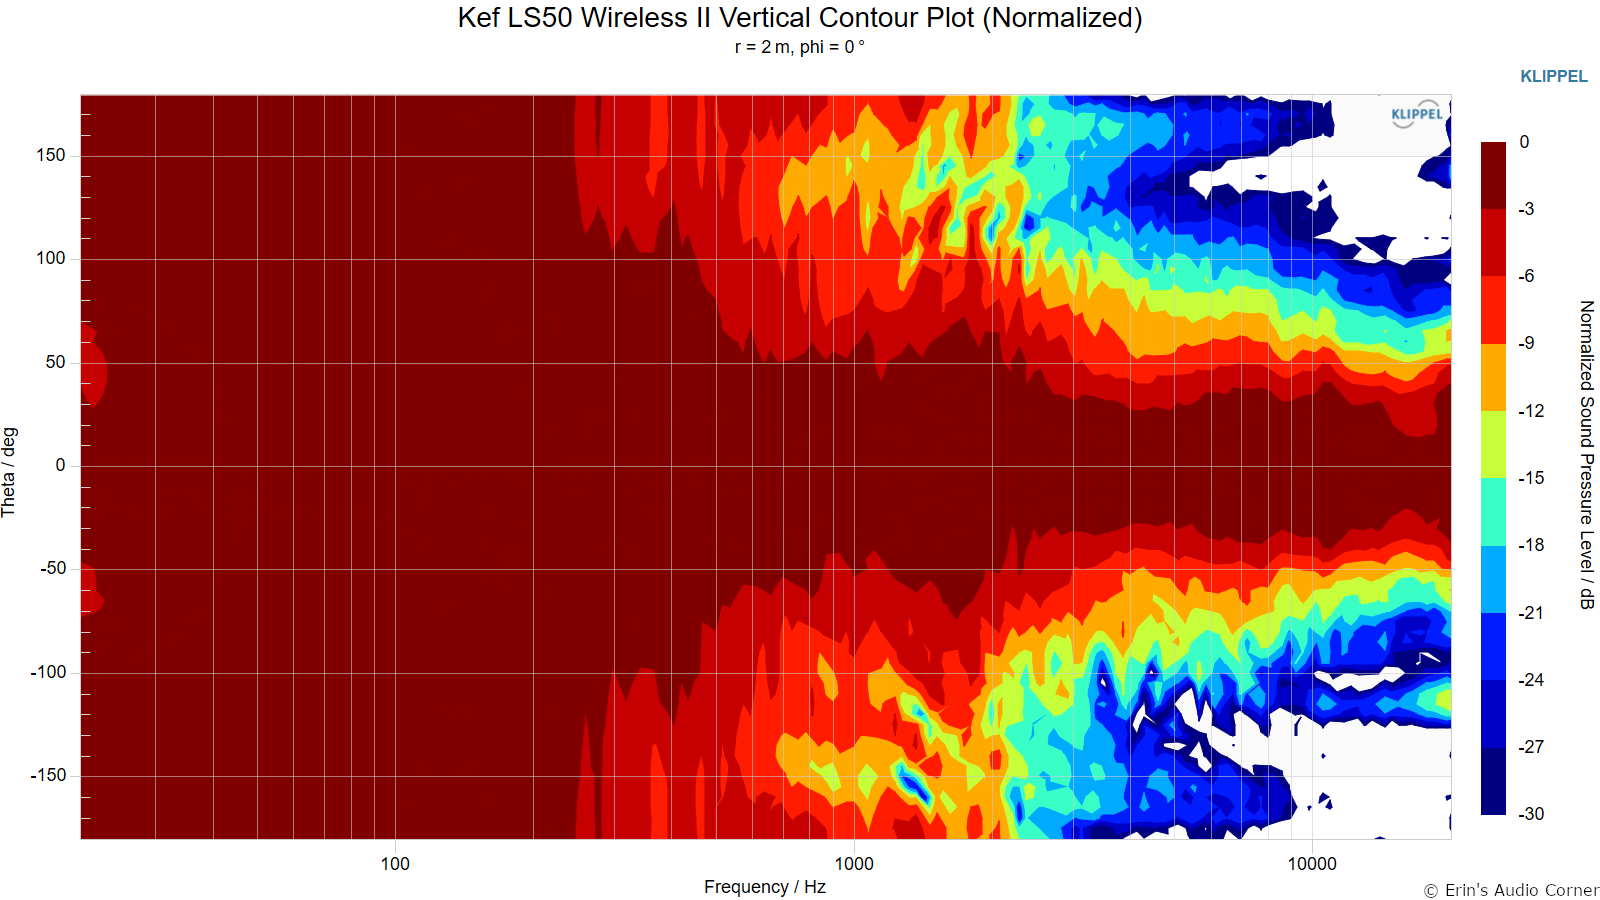
Vertical Contour Plot (normalized):
“Globe” Plots
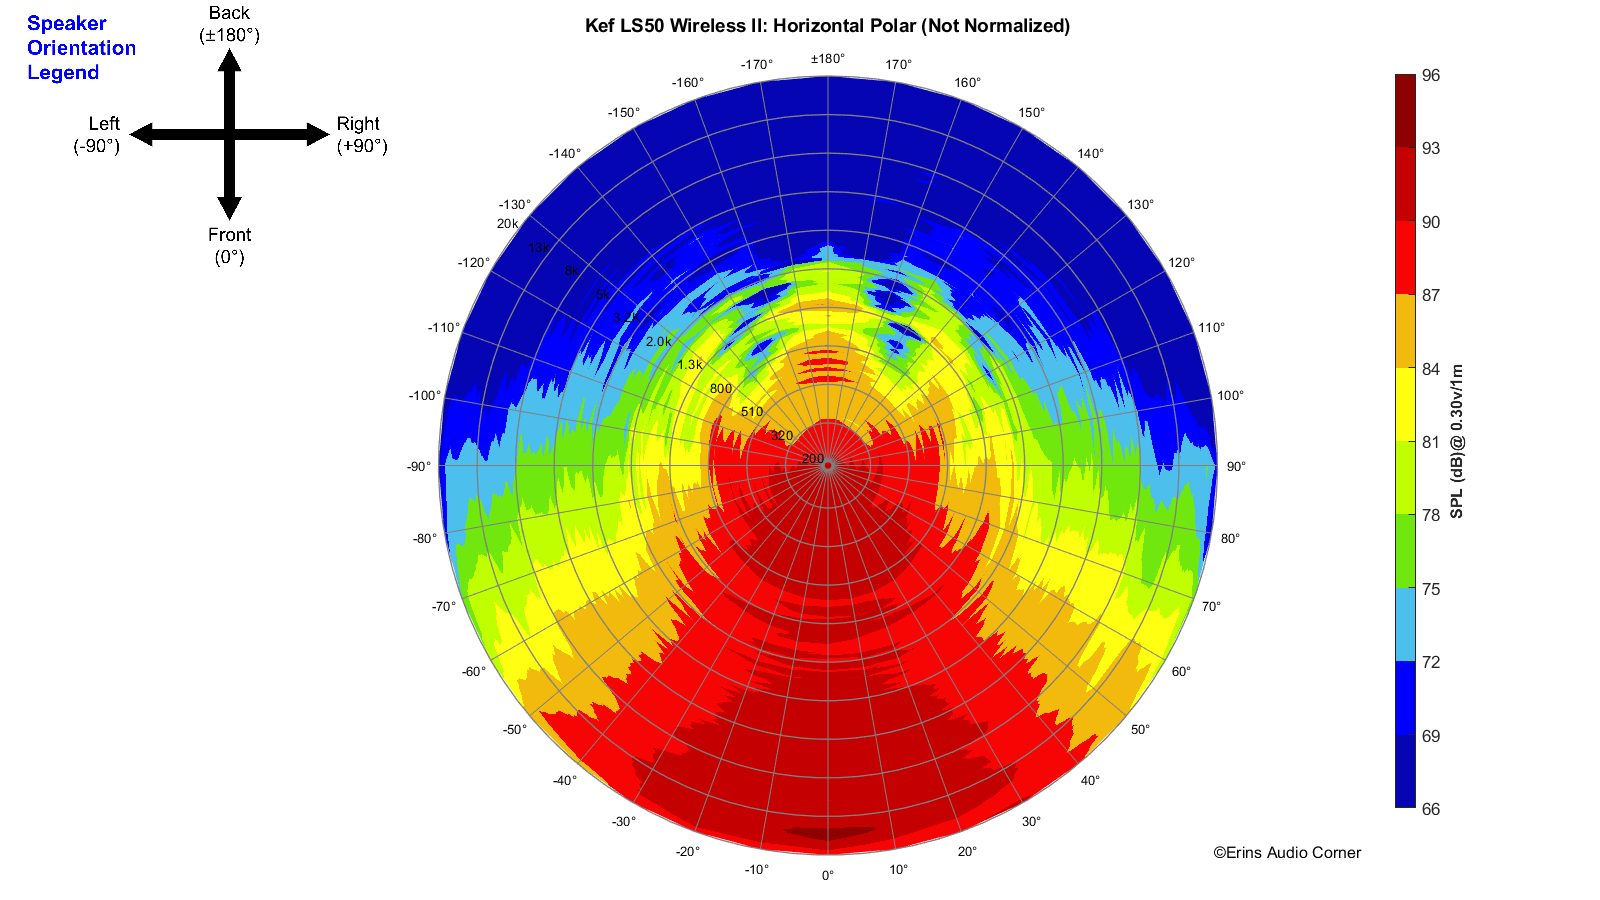
Horizontal Polar (Globe) Plot:
This represents the sound field at 2 meters - above 200Hz - per the legend in the upper left.
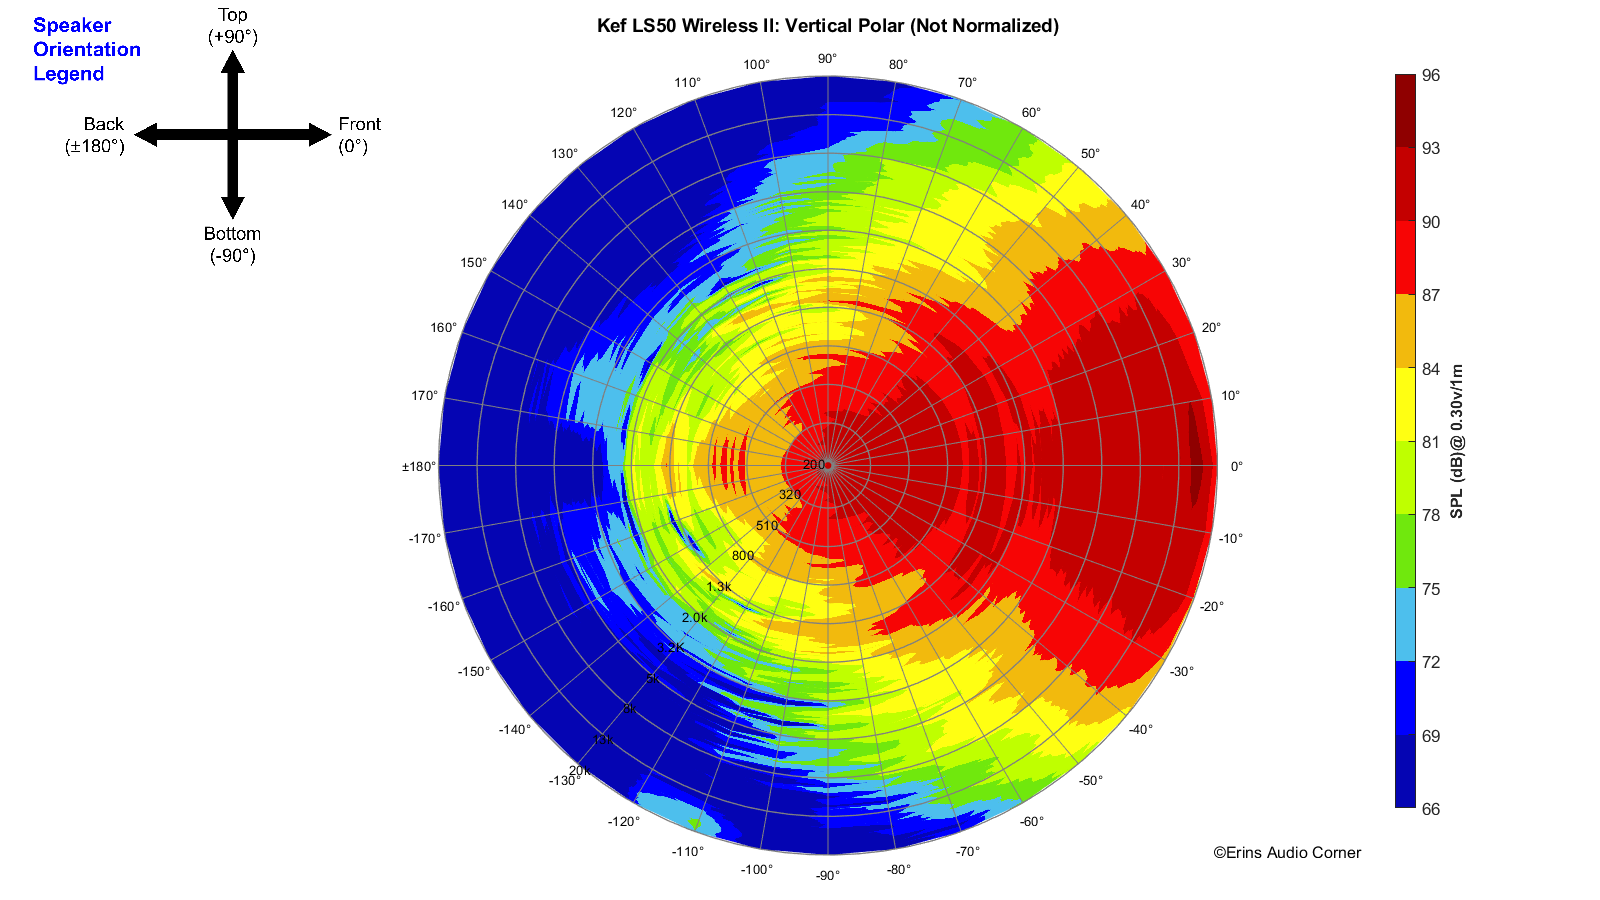
Vertical Polar (Globe) Plot:
This represents the sound field at 2 meters - above 200Hz - per the legend in the upper left.
Additional Measurements
On-Axis Response Linearity

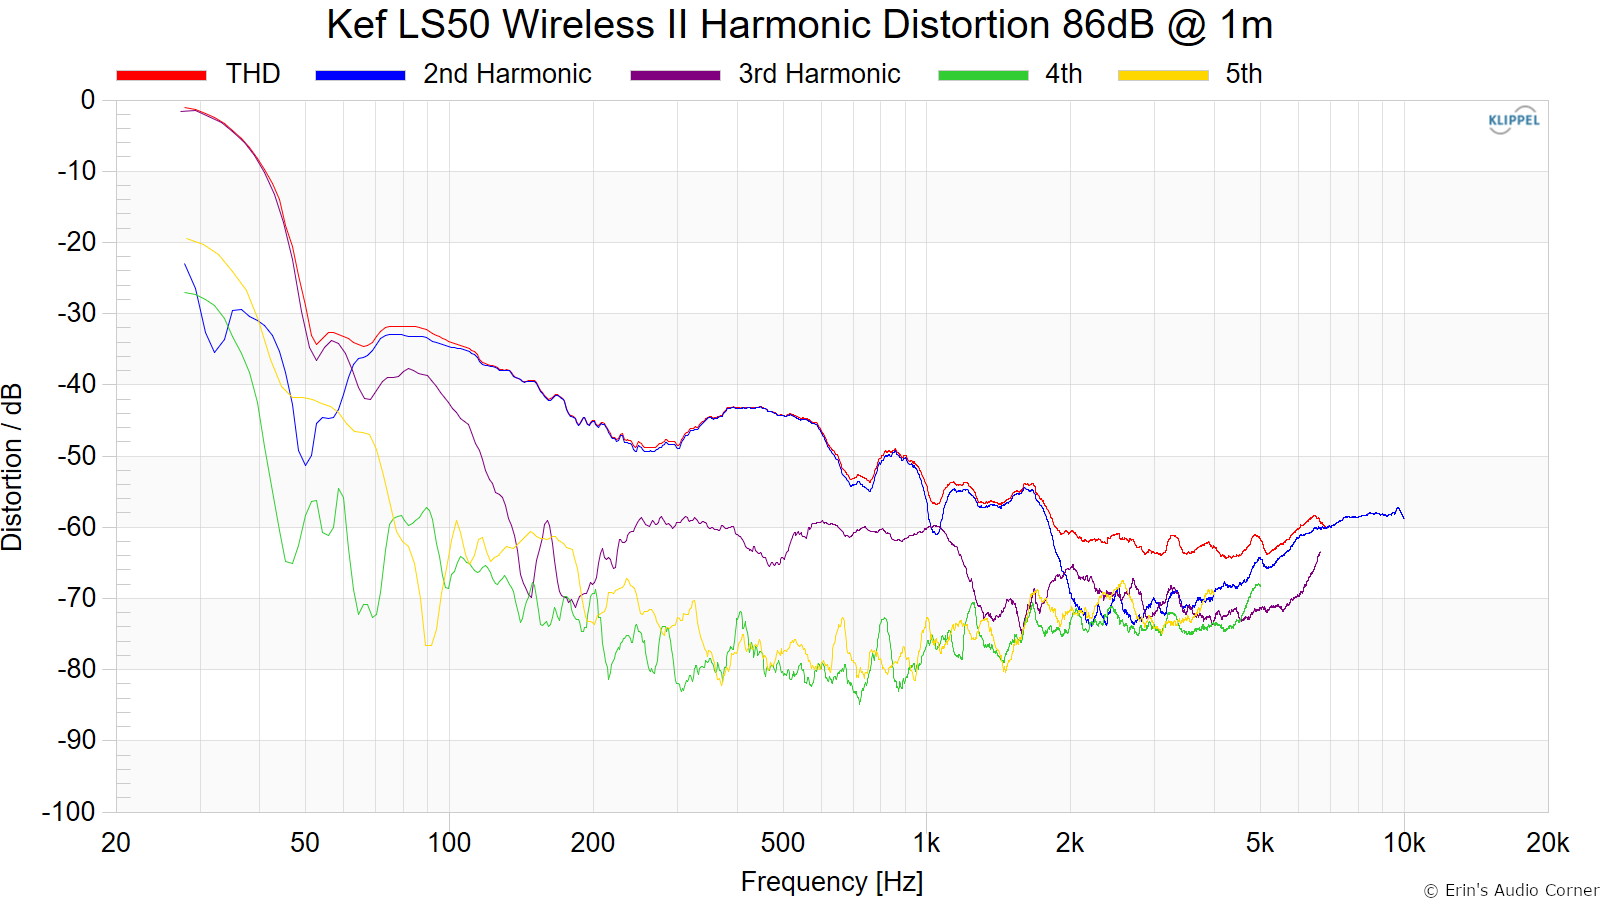
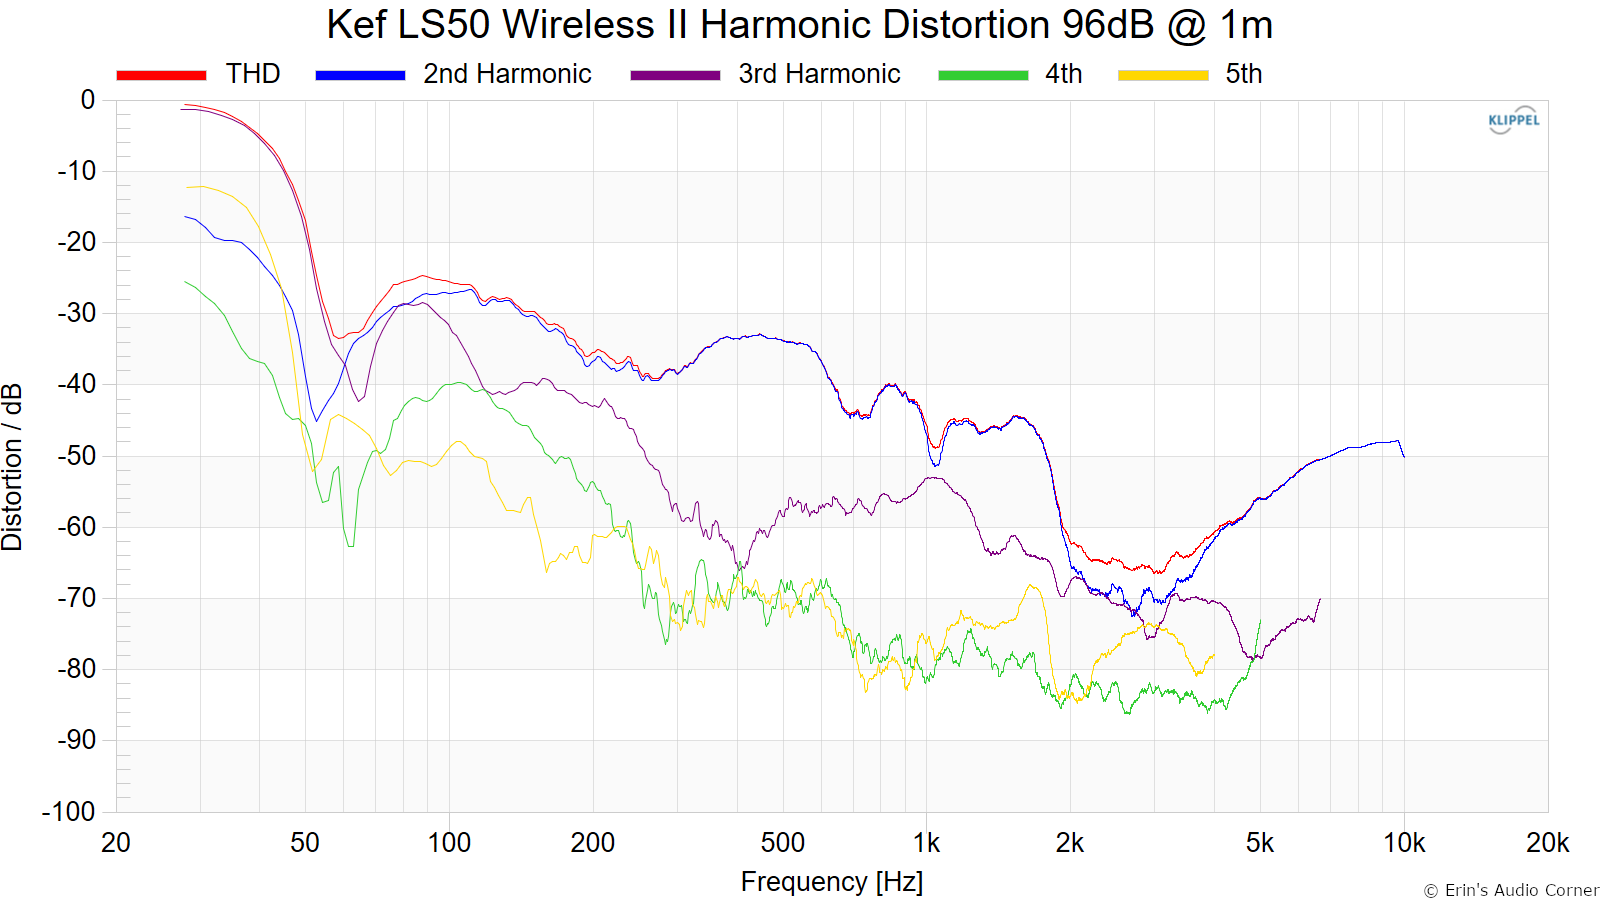
Harmonic Distortion
Harmonic Distortion at 86dB @ 1m:
Harmonic Distortion at 96dB @ 1m:
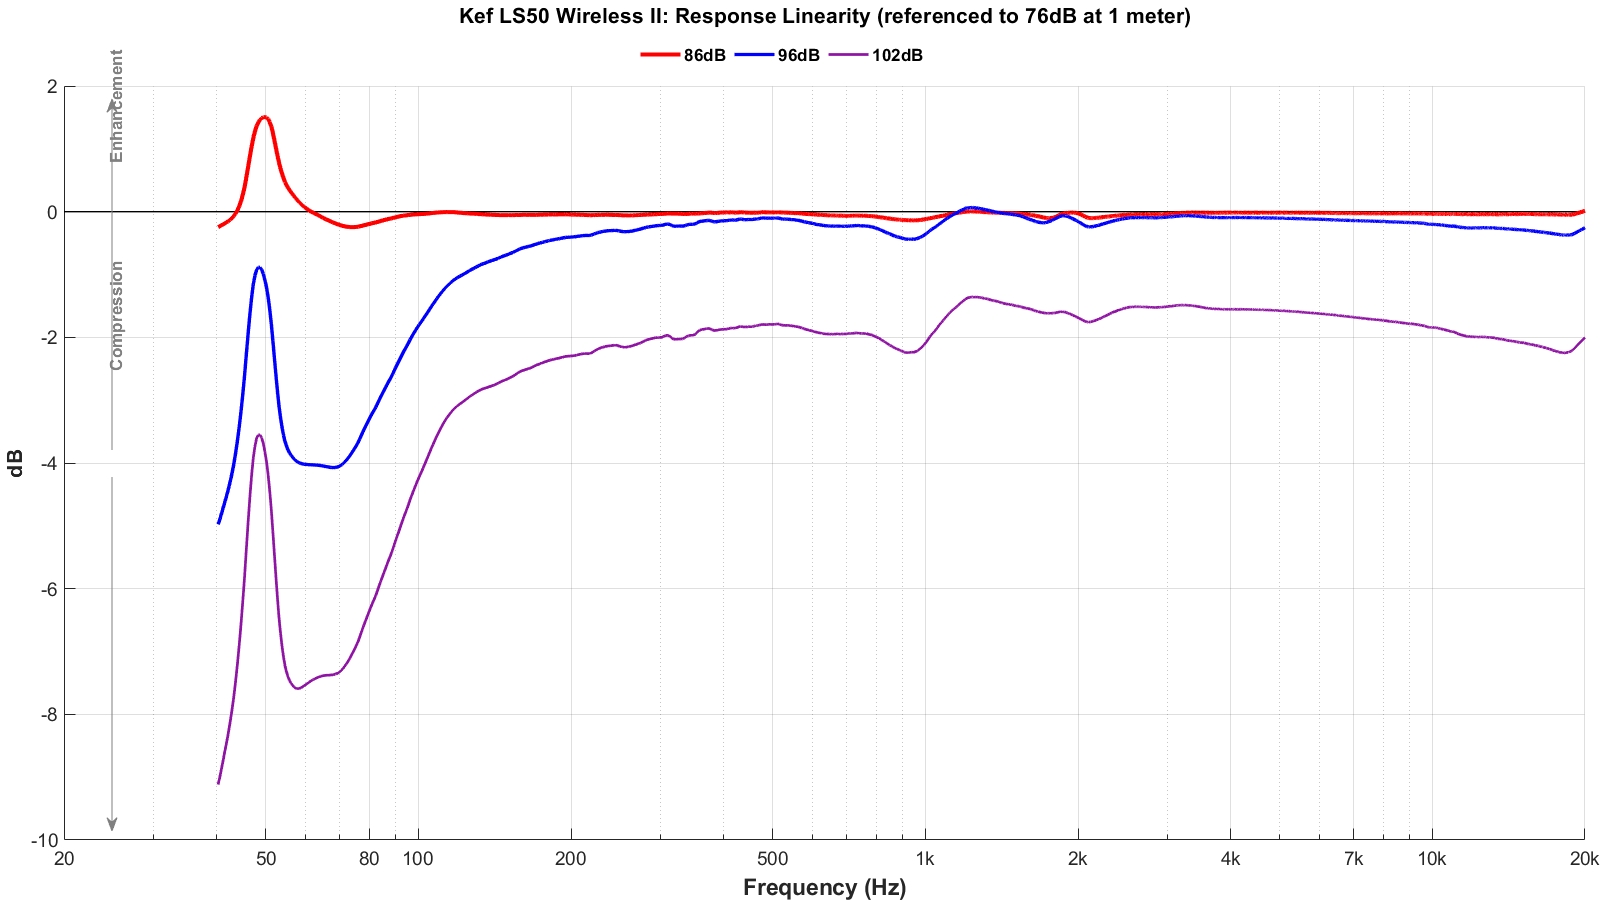
Dynamic Range (Instantaneous Compression Test)
The below graphic indicates just how much SPL is lost (compression) or gained (enhancement; usually due to distortion) when the speaker is played at higher output volumes instantly via a 2.7 second logarithmic sine sweep referenced to 76dB at 1 meter. The signals are played consecutively without any additional stimulus applied. Then normalized against the 76dB result.
The tests are conducted in this fashion:
- 76dB at 1 meter (baseline; black)
- 86dB at 1 meter (red)
- 96dB at 1 meter (blue)
- 102dB at 1 meter (purple)
The purpose of this test is to illustrate how much (if at all) the output changes as a speaker’s components temperature increases (i.e., voice coils, crossover components) instantaneously.
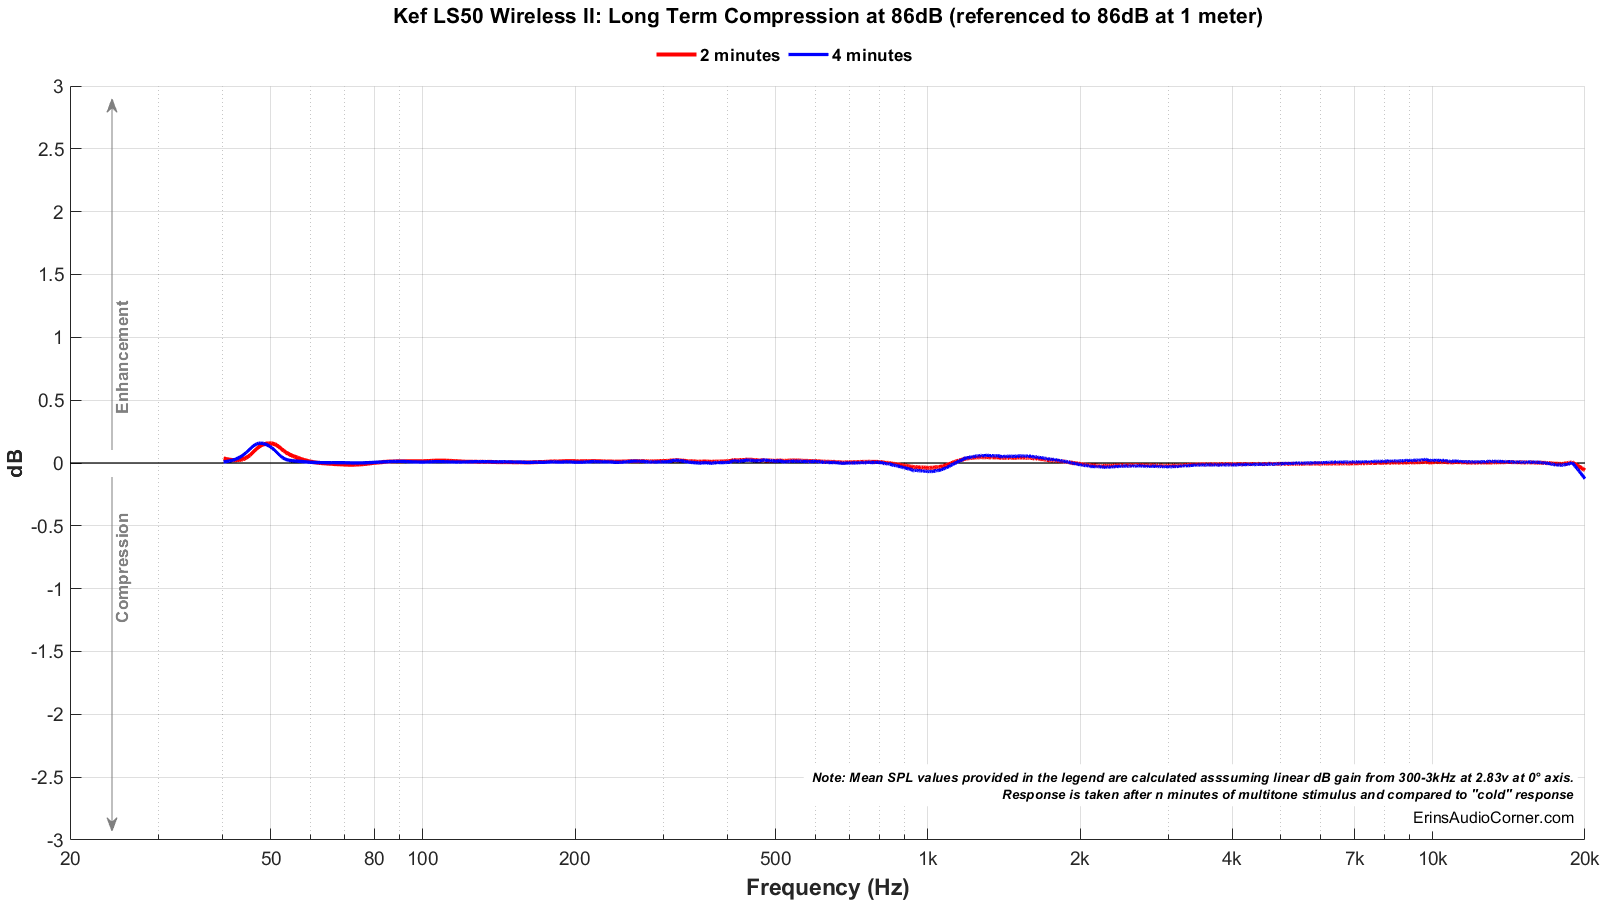
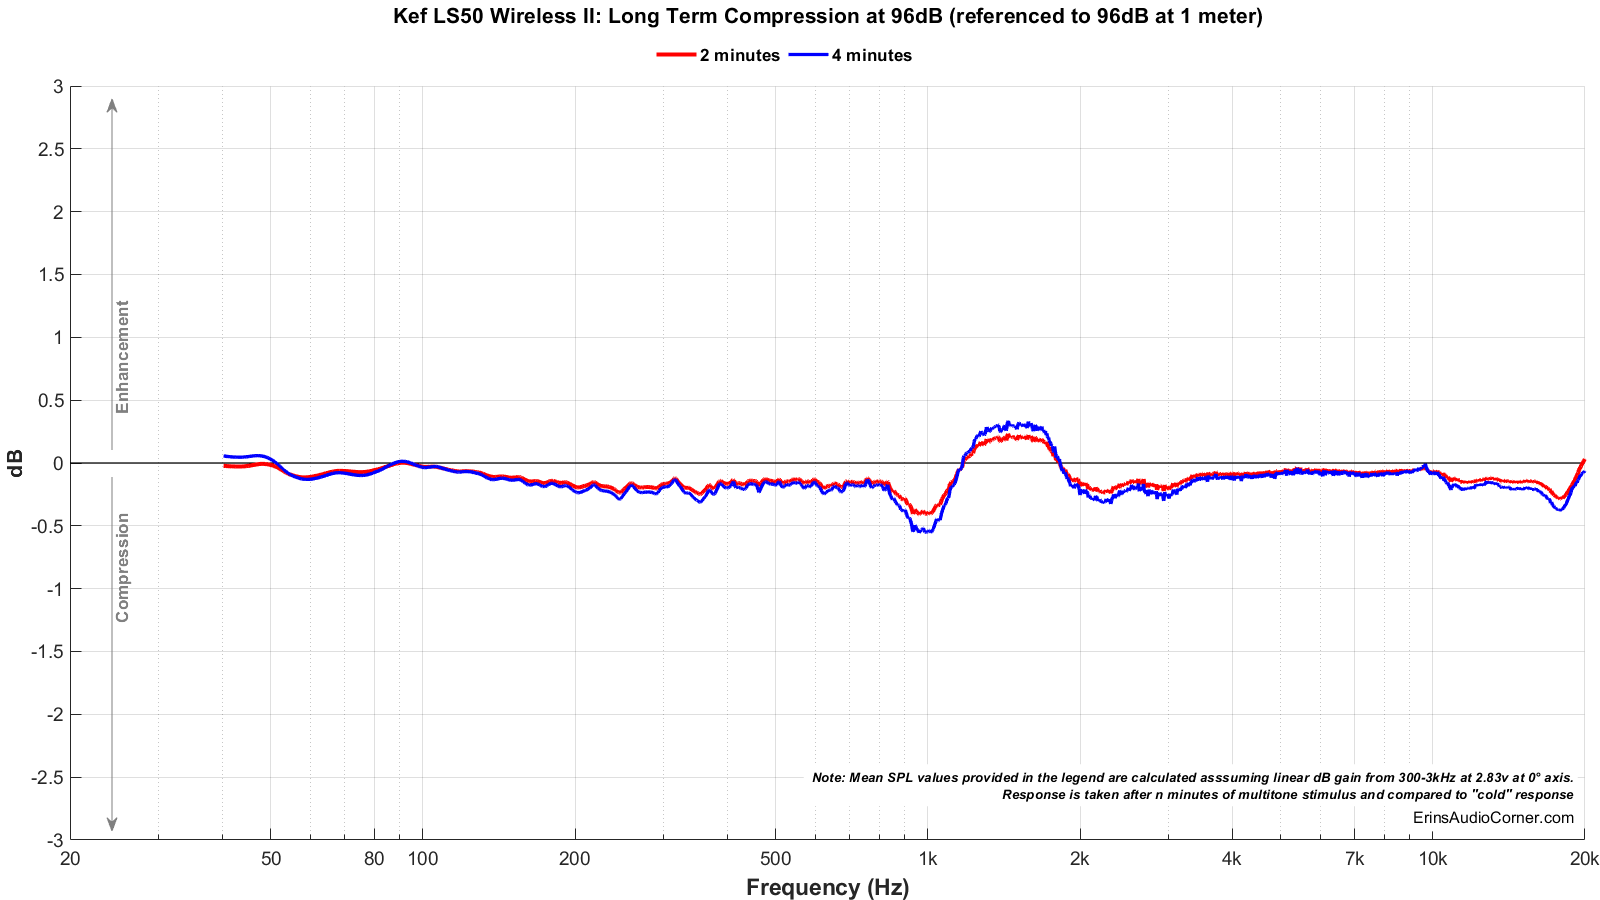
Long Term Compression Tests
The below graphics indicate how much SPL is lost or gained in the long-term as a speaker plays at the same output level for 2 minutes, in intervals. Each graphic represents a different SPL: 86dB and 96dB both at 1 meter.
The purpose of this test is to illustrate how much (if at all) the output changes as a speaker’s components temperature increases (i.e., voice coils, crossover components).
The tests are conducted in this fashion:
- “Cold” logarithmic sine sweep (no stimulus applied beforehand)
- Multitone stimulus played at desired SPL/distance for 2 minutes; intended to represent music signal
- Interim logarithmic sine sweep (no stimulus applied beforehand) (Red in graphic)
- Multitone stimulus played at desired SPL/distance for 2 minutes; intended to represent music signal
- Final logarithmic sine sweep (no stimulus applied beforehand) (Blue in graphic)
The red and blue lines represent changes in the output compared to the initial “cold” test.
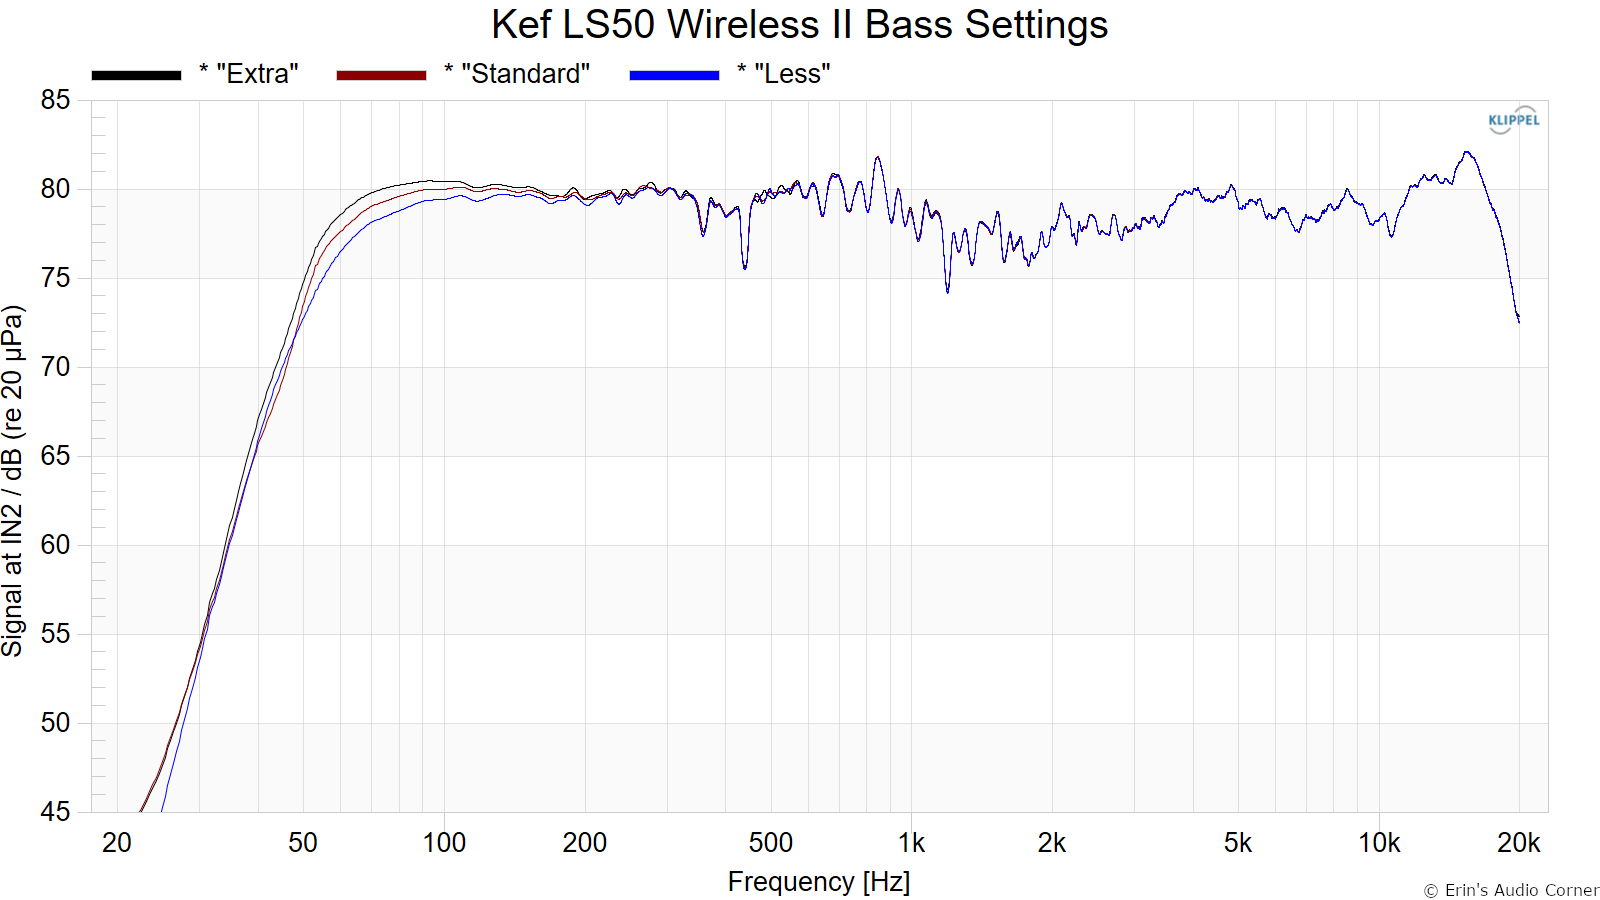
DSP settings
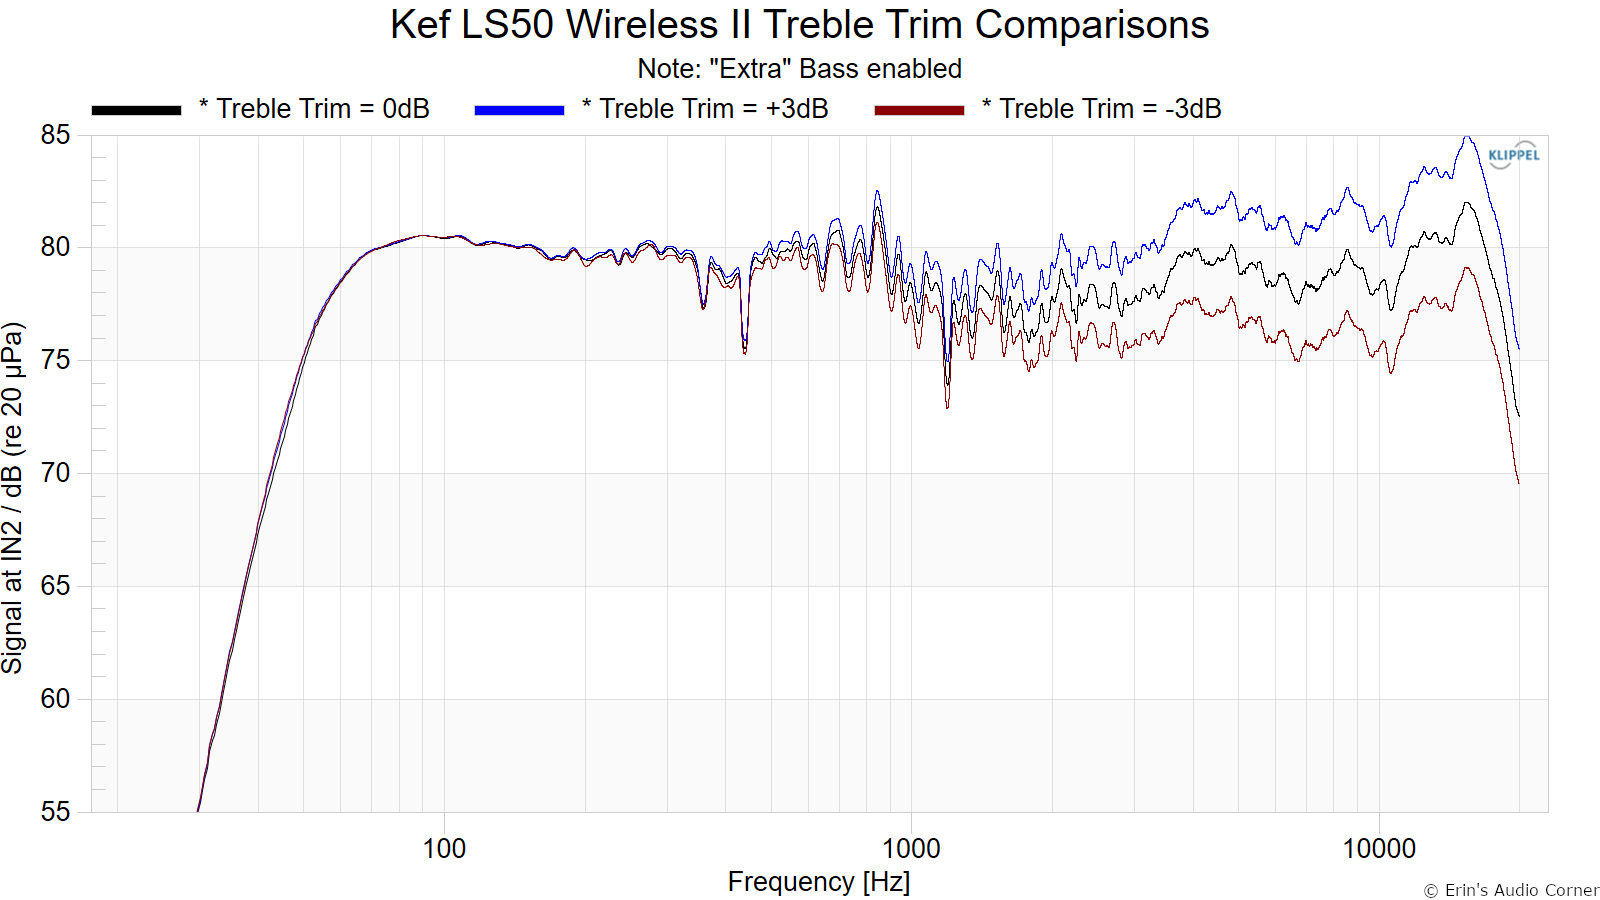
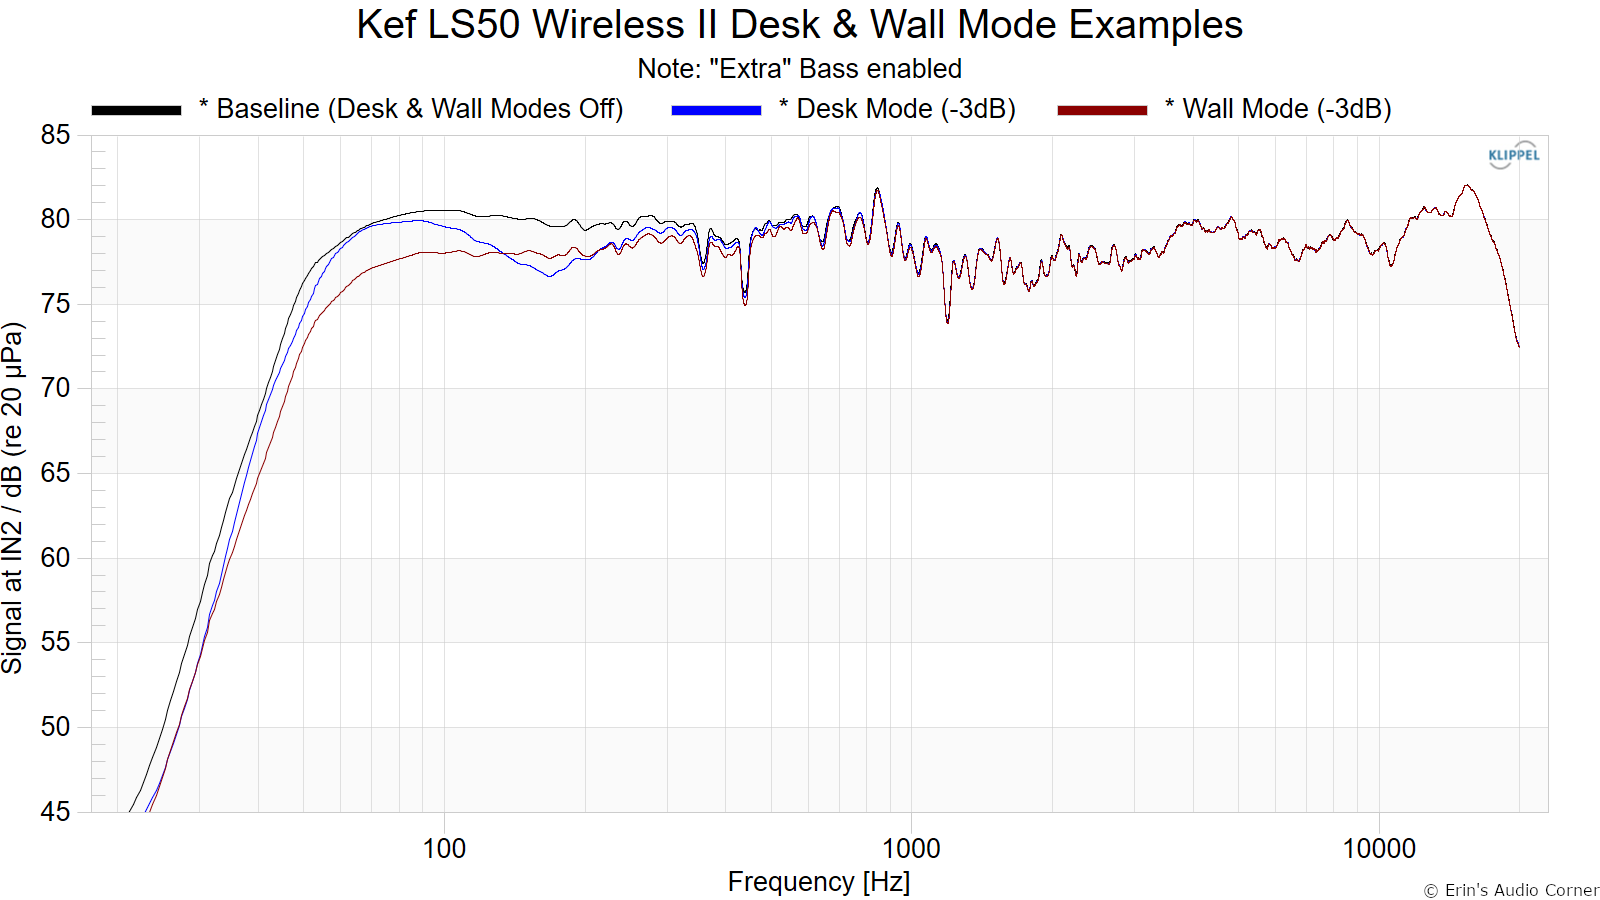
As I mentioned previously, there are numerous DSP settings. Below I have captured some of the more important ones to provide you a sense of the impact these can make. Pay attention to the legend; everything is laid out there.
Bass Settings:
Treble Trim:
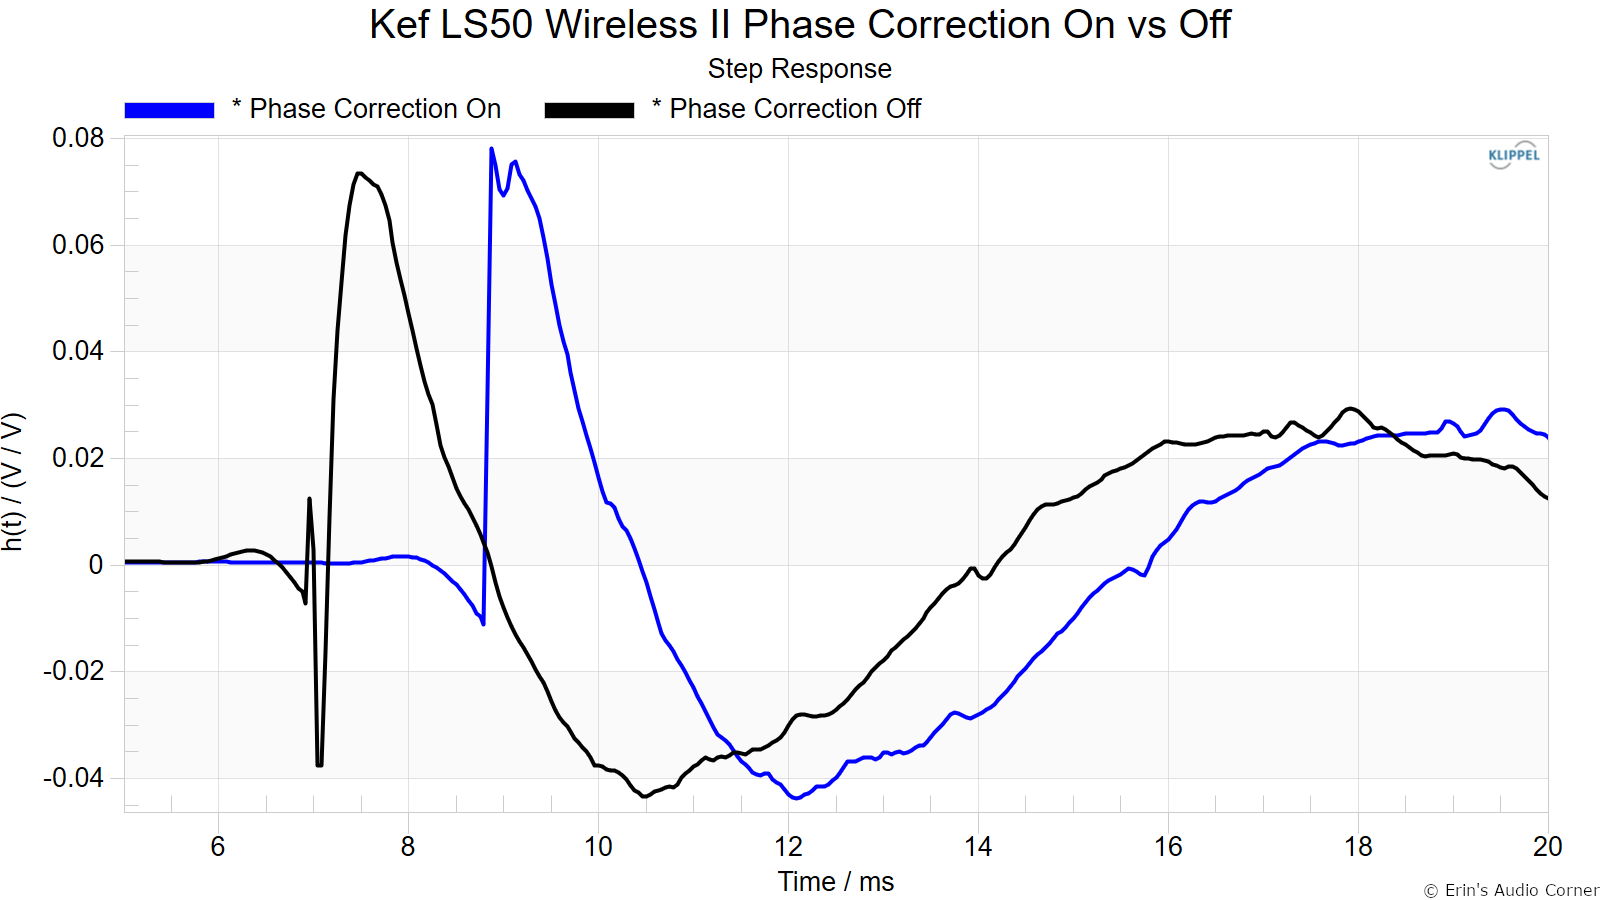
Phase Correction:
The phase correction setting makes absolutely no difference in frequency response so I won’t waste your time showing you a response comparison. However, the difference is evident in the step response:
Desk & Wall Mode (samples):
Parting / Random Thoughts
As stated in the Foreword, this written review is purposely a cliff’s notes version. For more details about the performance (objectively and subjectively) please watch the YouTube video.
Briefly, though, I will say: The max output volume is about 90dB at 4 meters. These speakers are excellent but are not high output speakers. I think the best case scenario for these is moderate volume at long distances or a bit more volume at shorter distances. For example, 80-85dB at 4 meters or 90dB at 2 meters is where the sweet spot is for a pair of these in a typical room setting.
The wireless capability of these is one that I adore. It is so nice to be able to sit down on the couch and stream music (lossless, through whatever service you care for, really) to these directly. It made my listening session better because there was no need to turn on different pieces of gear and have volume control on different devices. For those who want to pair these with a TV or computer, you can. But, again, for me the payoff is being able to plug these into a wall and then start streaming. Setup was easy. DSP settings are at your fingertips and you can even control a separate subwoofer(s) directly from the Kef Connect app which makes dialing in the crossover frequency and subwoofer level easy and straightforward.
With the SPL and low-frequency limitations in mind, I do very much like this speaker. I think it is a fine ’lifestyle’ speaker for someone who wants a mostly neutral speaker (other than the dip in the 1-3kHz region) and a very deep soundstage. Width of soundstage could be wider but if you have a smaller room that is untreated, this may work to your advantage as the direct to reflected ratio is reasonably high and the off-axis response mimics the direct sound quite well. It’s an expensive speaker set, sure. But if you’re looking at this review and considering them, I have no problem giving them a recommendation as long as you are realistic about the SPL levels and the bass output below 50Hz.
Support the Cause
If you like what you see here and want to help support the cause there are a few ways you can do so:
- Join my Patreon here.
- Contribute via PayPal here.
- Using my Amazon affiliate link below as it helps me gain a small commission at no additional cost to you.
Your support helps me pay for new items to test, hardware, miscellaneous items and costs of the site’s server space and bandwidth. All of which I otherwise pay out of pocket. So, if you can help chip in a few bucks, know that it is very much appreciated.
You can also join my Facebook and YouTube pages if you’d like to follow along with updates.