Foreword / YouTube Video Review
Note 1: I reviewed this speaker approximately a year ago using quasi-anechoic methods. I am re-reviewing the speaker with Klippel’s Near Field Scanner and have removed my old review as to not cause any confusion between the new and “old” dataset. However, the old data was within acceptable error and would be suitable to use if not for the new data’s higher resolution and accuracy.
Note 2: These speakers were loaned to me by their owner.
If you are interested in seeing my review of the Klipsch Forte IV click this link.
The review on this website is a brief overview and summary of the objective performance of this speaker. It is not intended to be a deep dive. Moreso, this is information for those who prefer “just the facts” and prefer to have the data without the filler. The video below has more discussion.
Information and Photos
Some specs from the manufacturer:
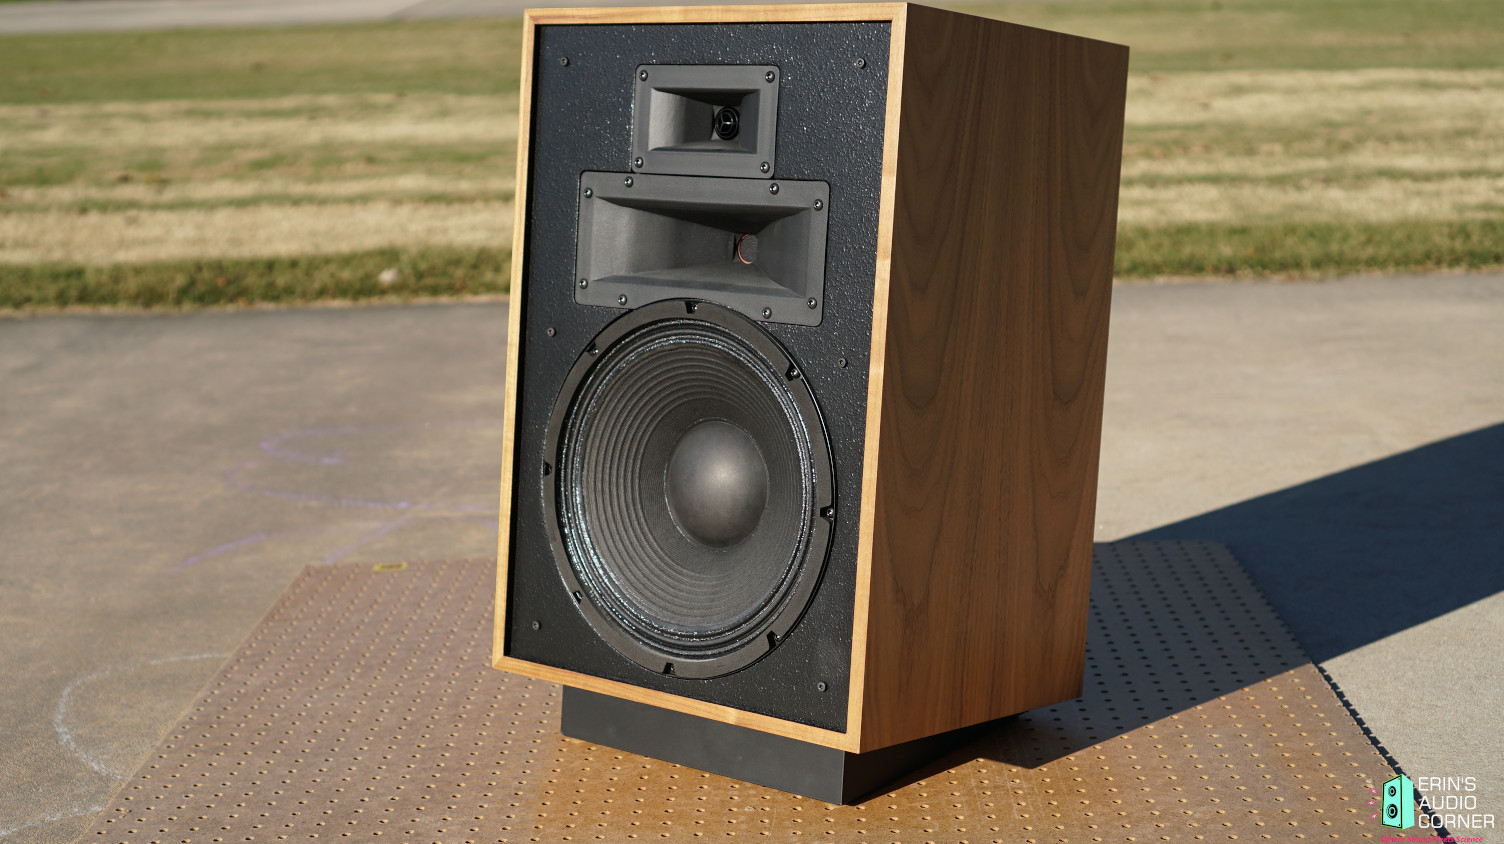
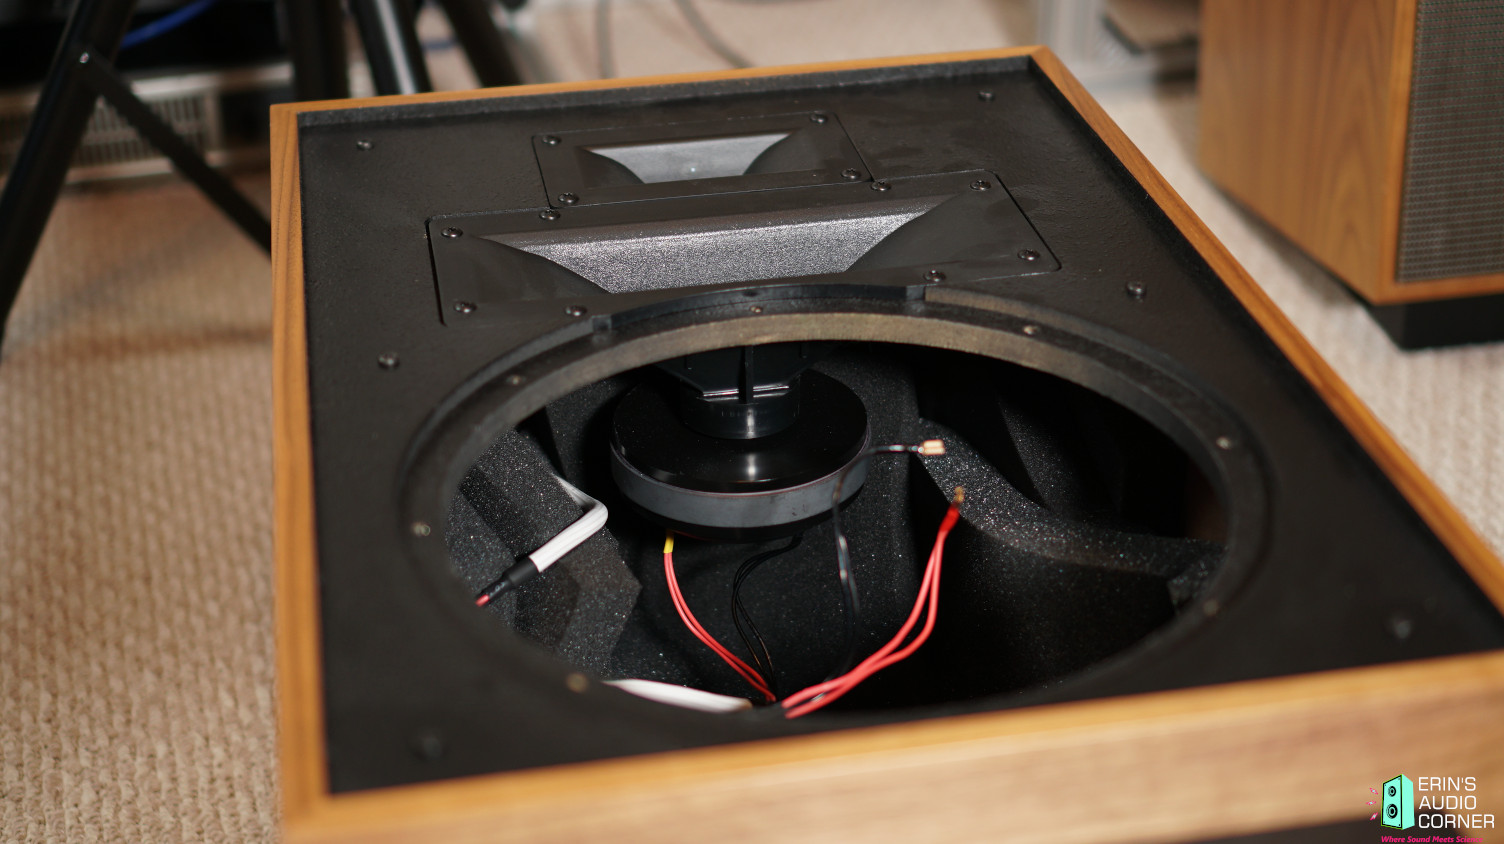
- All-new K-702 midrange compression driver, featuring a polyimide diaphragm, for exceptional detail
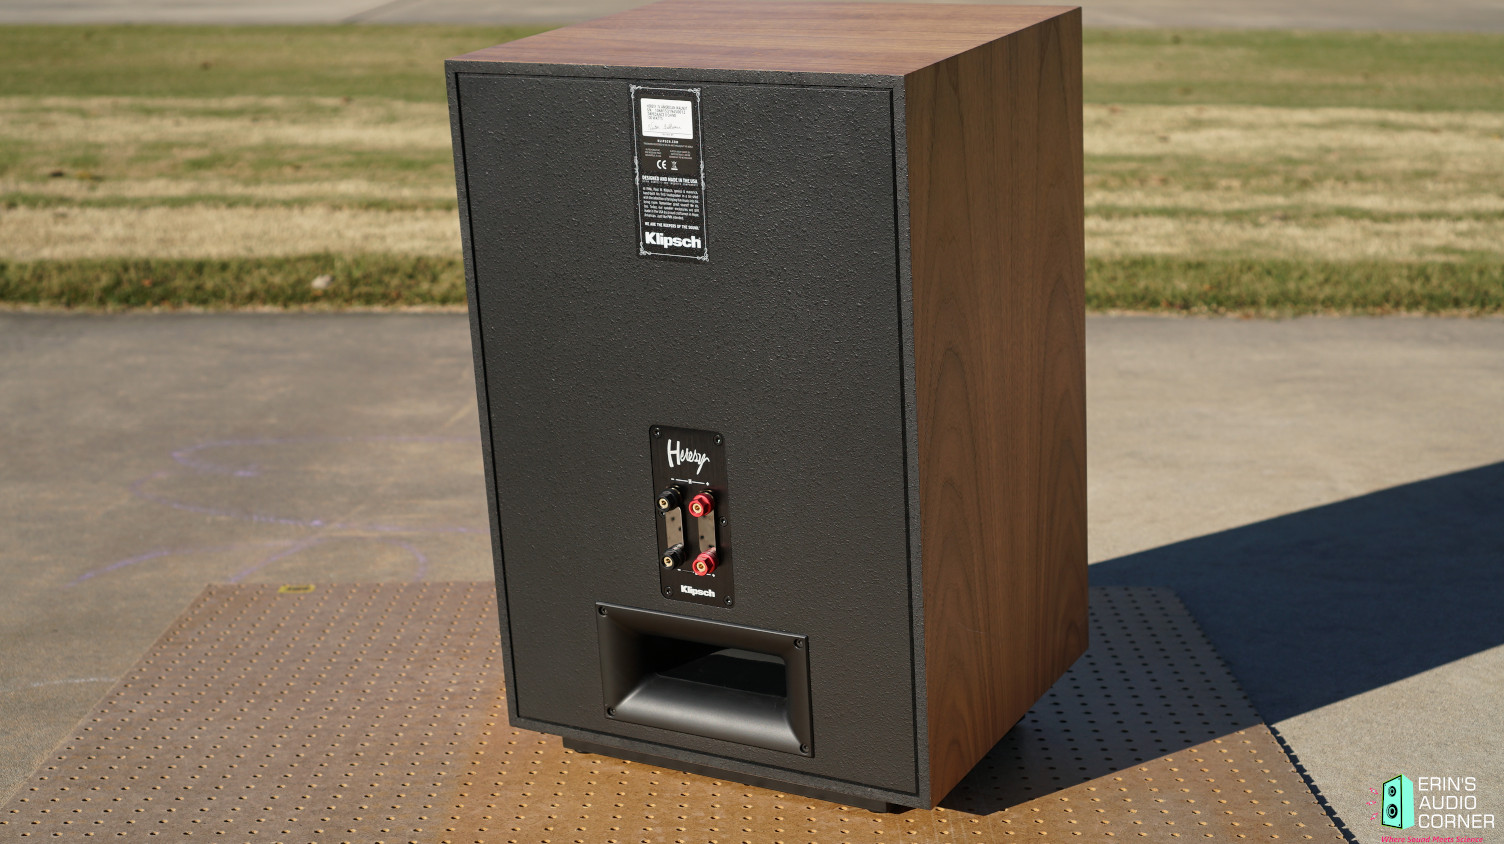
- For the first time, the Heresy IV features a rear port for the most efficient, fastest air transfer in their class, which reduces port noise for punchier low frequencies
- K-702 midrange is mated to the K-704 Tractrix® horn for a wide coverage pattern
- K-107-TI titanium diaphragm high-frequency driver with an all-new wide dispersion phase plug for providing exceptionally even high-frequency dispersion
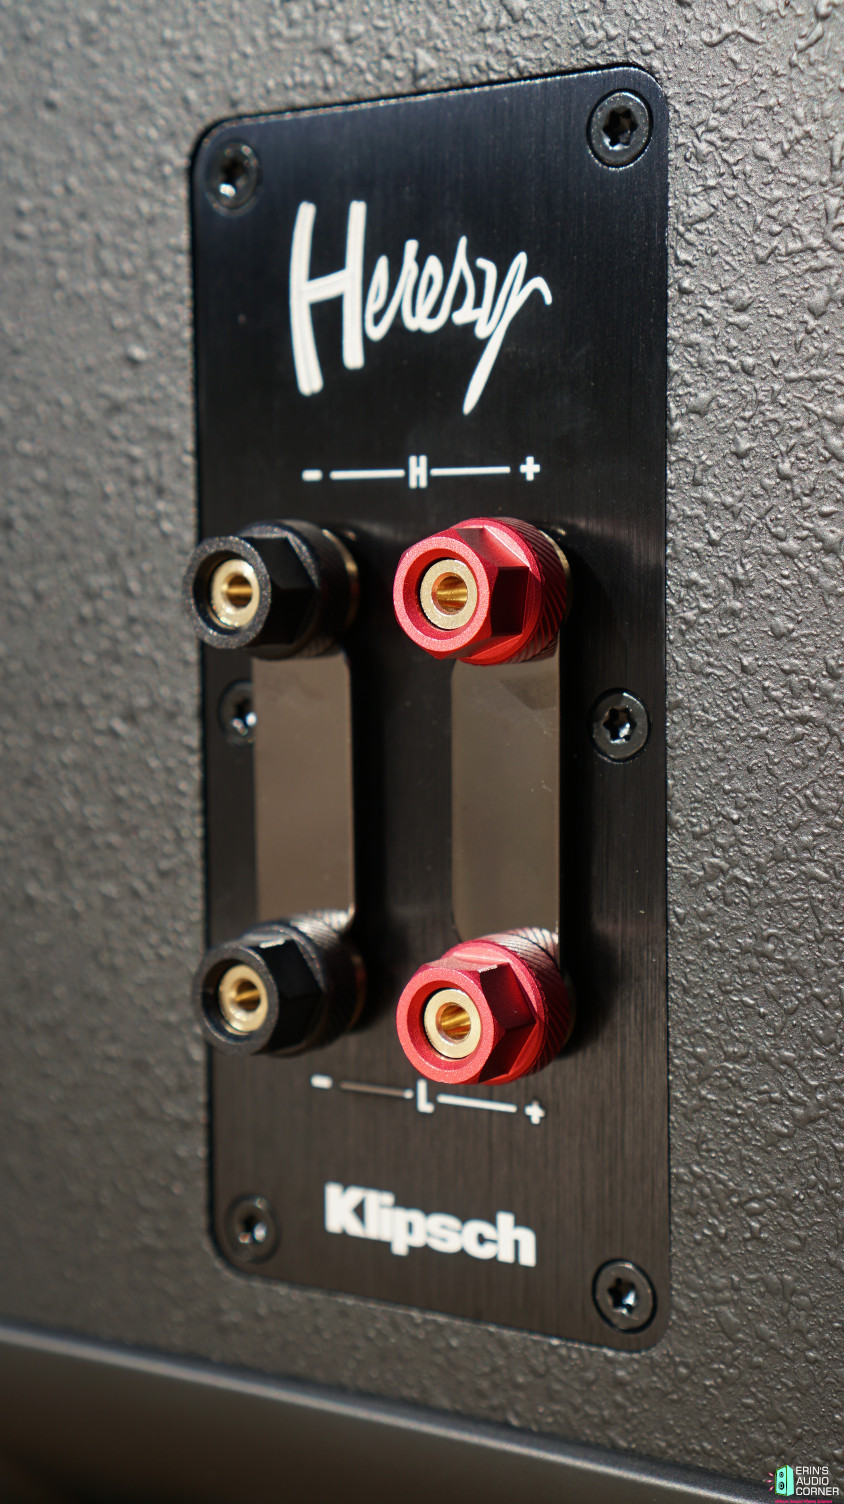
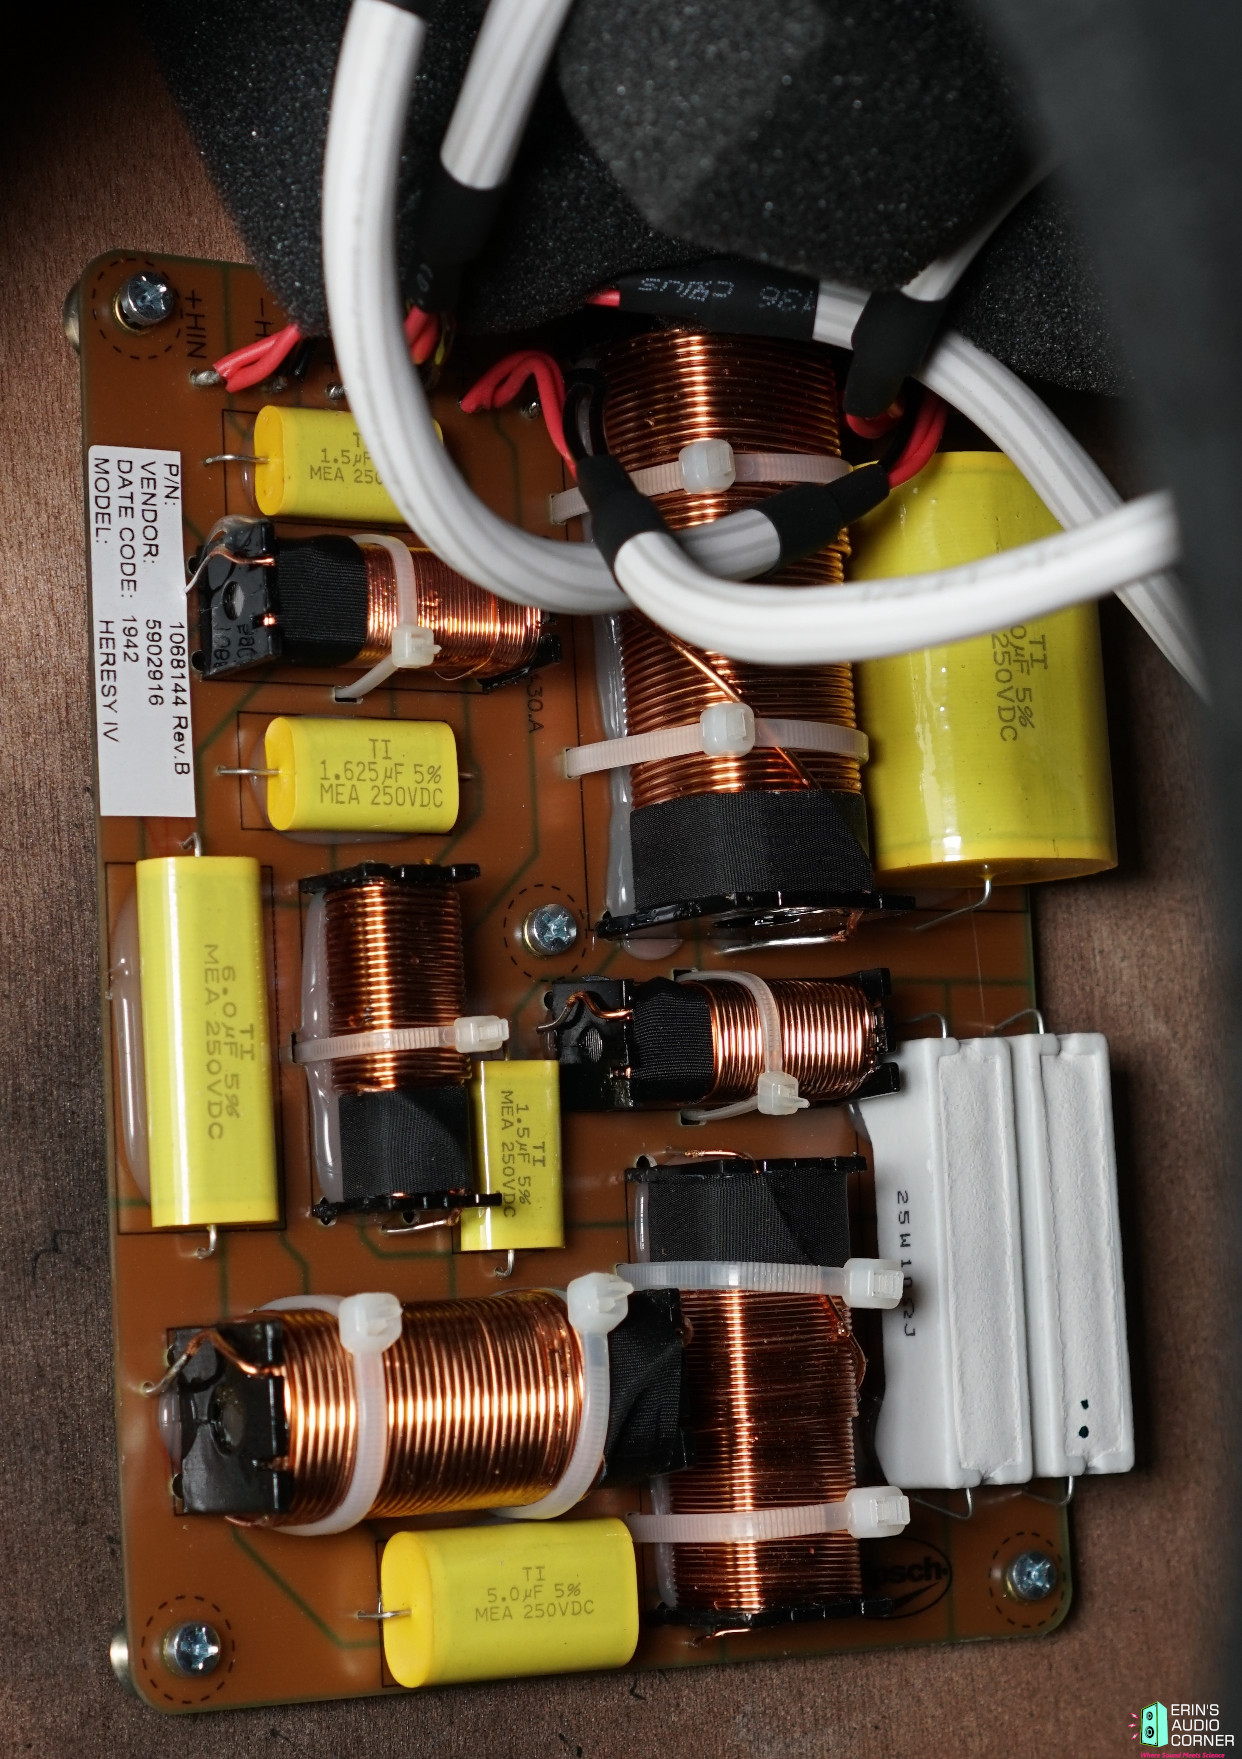
- All-new high fidelity network for truer to life sound, best-in-class efficiency, and power handling
- Klipsch Tractrix ports have custom designed inner flares that help reduce air turbulence entering the port. Less turbulent air helps reduce port noise for cleaner, more powerful bass
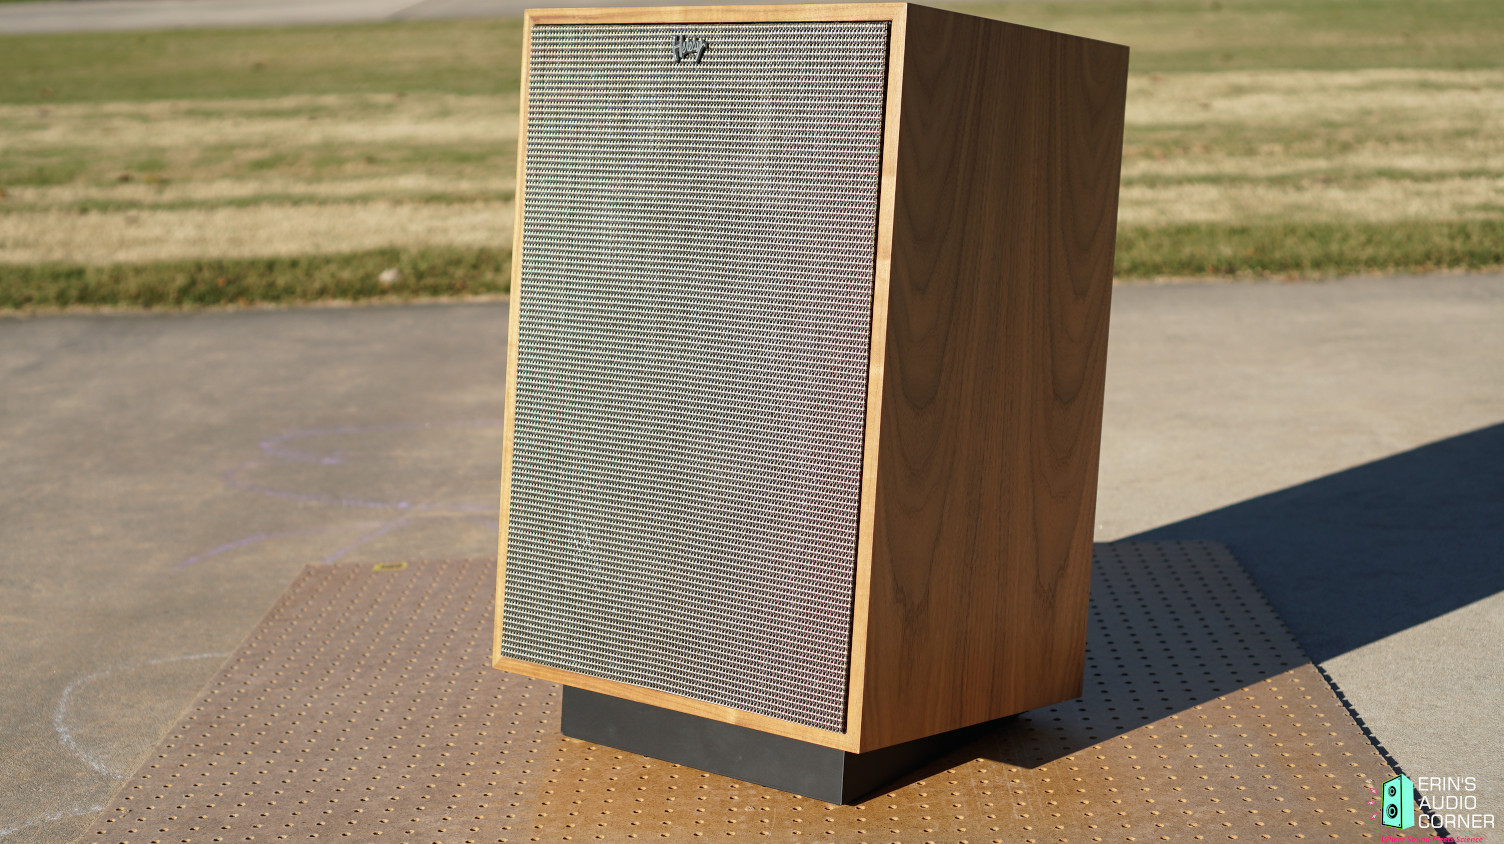
- Available in a high-quality Satin Black Ash, Natural Cherry, Distressed Oak, or American Walnut wood veneer finish
- Designed & assembled in the USA
Price is approximately $3200 USD for the pair.
If you are interested in purchasing this speaker, please consider using the following affiliate link which earns me a small commission at no additional cost to you: Just-Audio.com
CTA-2034 (SPINORAMA) and Accompanying Data
All data collected using Klippel’s Near-Field Scanner. The Near-Field-Scanner 3D (NFS) offers a fully automated acoustic measurement of direct sound radiated from the source under test. The radiated sound is determined in any desired distance and angle in the 3D space outside the scanning surface. Directivity, sound power, SPL response and many more key figures are obtained for any kind of loudspeaker and audio system in near field applications (e.g. studio monitors, mobile devices) as well as far field applications (e.g. professional audio systems). Utilizing a minimum of measurement points, a comprehensive data set is generated containing the loudspeaker’s high resolution, free field sound radiation in the near and far field. For a detailed explanation of how the NFS works and the science behind it, please watch the below discussion with designer Christian Bellmann:
The reference plane in this test is at the tweeter*. Testing was performed without the grille.
*I verified with Klipsch that this was the correct design axis:
You may use the speakers with the built in stand, they are designed to be angled upward a little so they reach your listening perspective properly. Arranging Speakers for Best Sound this article could be helpful as well.
Measurements are provided in a format in accordance with the Standard Method of Measurement for In-Home Loudspeakers (ANSI/CTA-2034-A R-2020). For more information, please see this link.
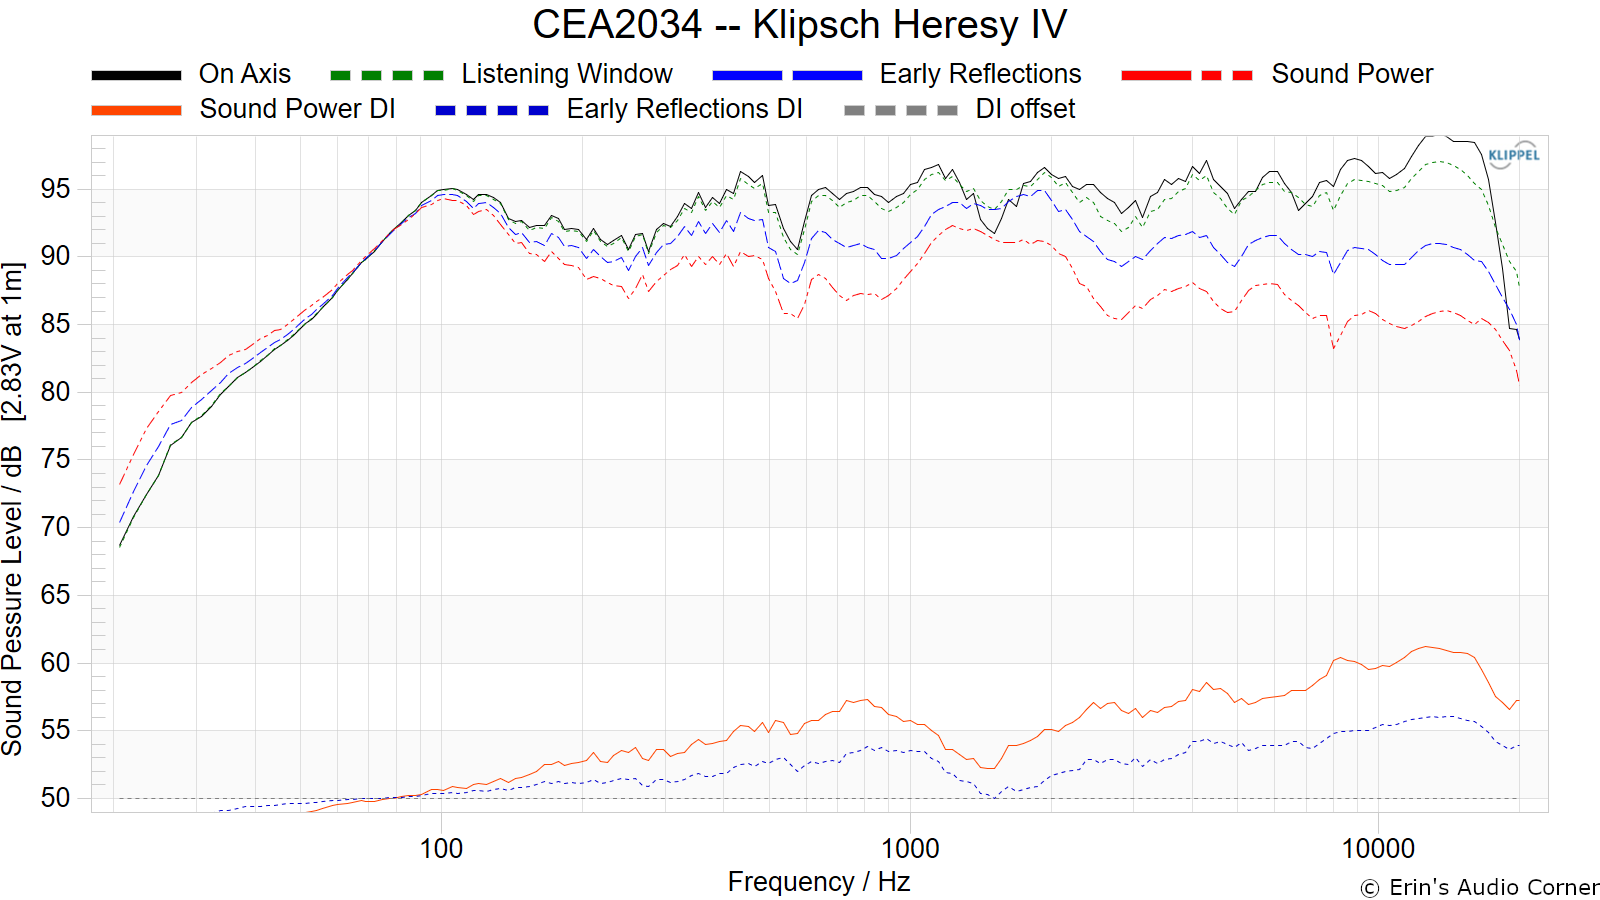
CTA-2034 / SPINORAMA:
The On-axis Frequency Response (0°) is the universal starting point and in many situations it is a fair representation of the first sound to arrive at a listener’s ears.
The Listening Window is a spatial average of the nine amplitude responses in the ±10º vertical and ±30º horizontal angular range. This encompasses those listeners who sit within a typical home theater audience, as well as those who disregard the normal rules when listening alone.
The Early Reflections curve is an estimate of all single-bounce, first-reflections, in a typical listening room.
Sound Power represents all of the sounds arriving at the listening position after any number of reflections from any direction. It is the weighted rms average of all 70 measurements, with individual measurements weighted according to the portion of the spherical surface that they represent.
Sound Power Directivity Index (SPDI): In this standard the SPDI is defined as the difference between the listening window curve and the sound power curve.
Early Reflections Directivity Index (EPDI): is defined as the difference between the listening window curve and the early reflections curve. In small rooms, early reflections figure prominently in what is measured and heard in the room so this curve may provide insights into potential sound quality.
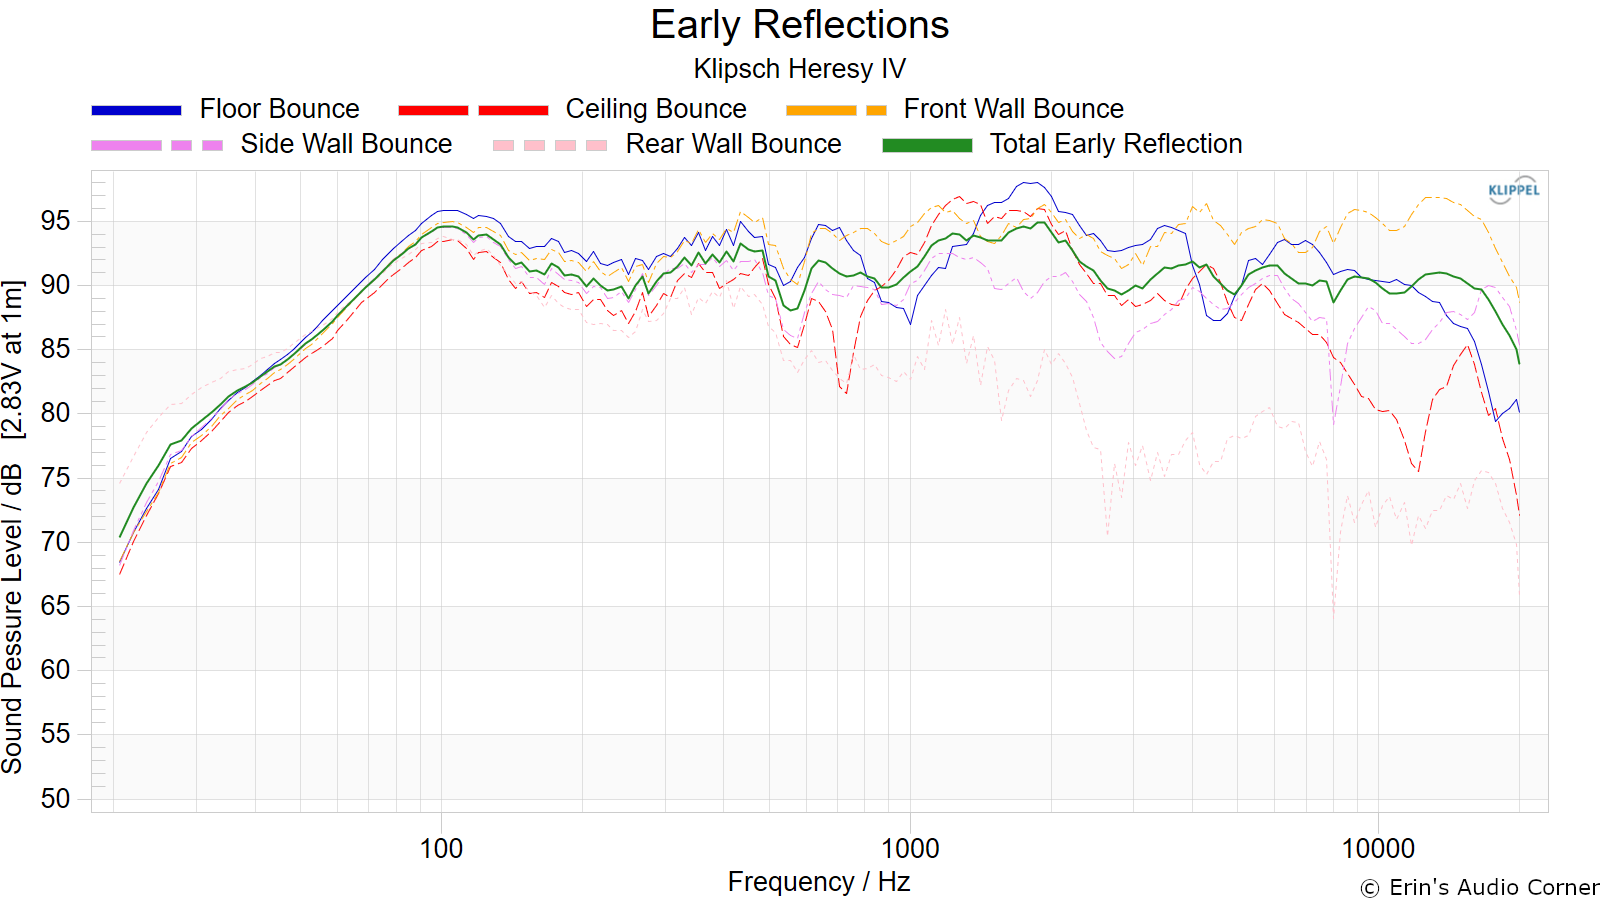
Early Reflections Breakout:
Floor bounce: average of 20º, 30º, 40º down
Ceiling bounce: average of 40º, 50º, 60º up
Front wall bounce: average of 0º, ± 10º, ± 20º, ± 30º horizontal
Side wall bounces: average of ± 40º, ± 50º, ± 60º, ± 70º, ± 80º horizontal
Rear wall bounces: average of 180º, ± 90º horizontal
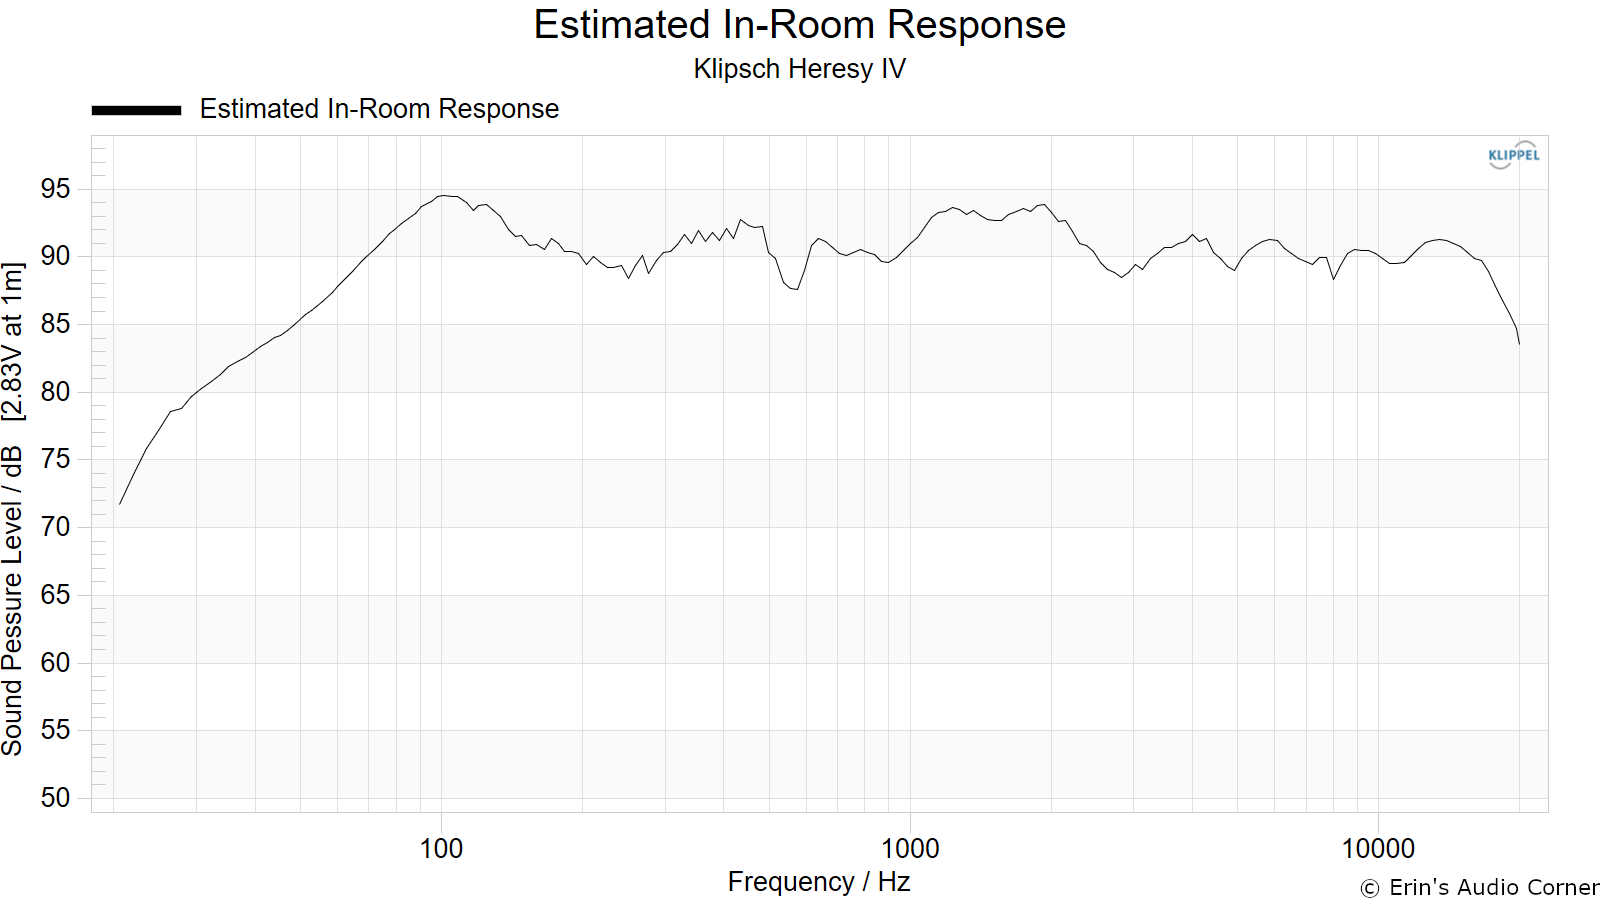
Estimated In-Room Response:
In theory, with complete 360-degree anechoic data on a loudspeaker and sufficient acoustical and geometrical data on the listening room and its layout it would be possible to estimate with good precision what would be measured by an omnidirectional microphone located in the listening area of that room. By making some simplifying assumptions about the listening space, the data set described above permits a usefully accurate preview of how a given loudspeaker might perform in a typical domestic listening room. Obviously, there are no guarantees, because individual rooms can be acoustically aberrant. Sometimes rooms are excessively reflective (“live”) as happens in certain hot, humid climates, with certain styles of interior décor and in under-furnished rooms. Sometimes rooms are excessively “dead” as in other styles of décor and in some custom home theaters where acoustical treatment has been used excessively. This form of post processing is offered only as an estimate of what might happen in a domestic living space with carpet on the floor and a “normal” amount of seating, drapes and cabinetry.
For these limited circumstances it has been found that a usefully accurate Predicted In-Room (PIR) amplitude response, also known as a “room curve” is obtained by a weighted average consisting of 12 % listening window, 44 % early reflections and 44 % sound power. At very high frequencies errors can creep in because of excessive absorption, microphone directivity, and room geometry. These discrepancies are not considered to be of great importance.
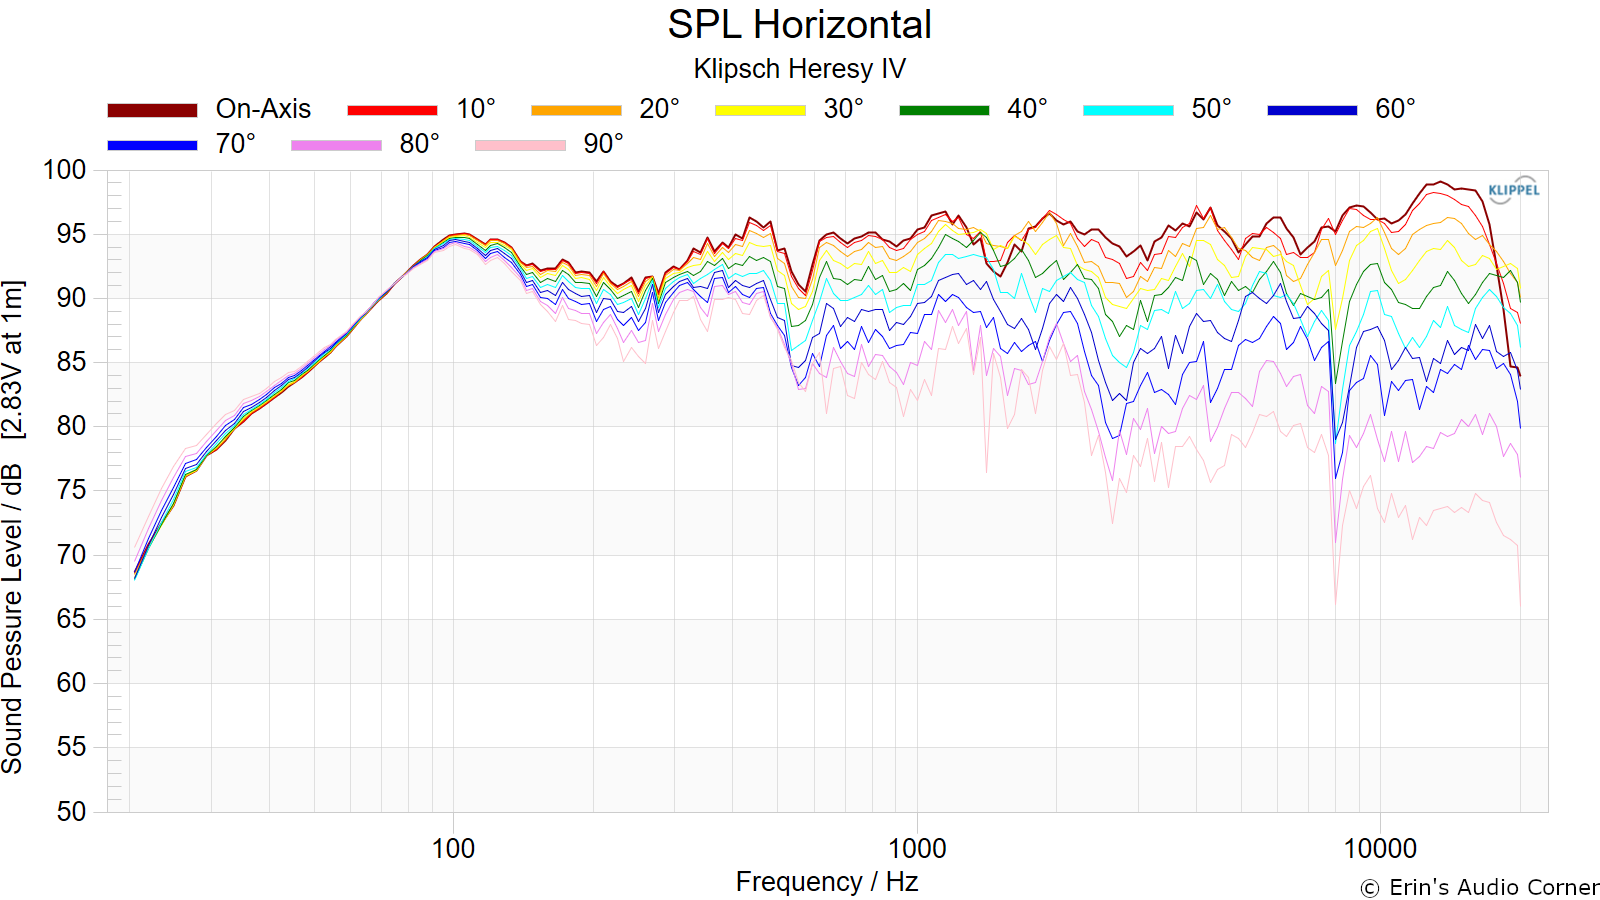
Horizontal Frequency Response (0° to ±90°):
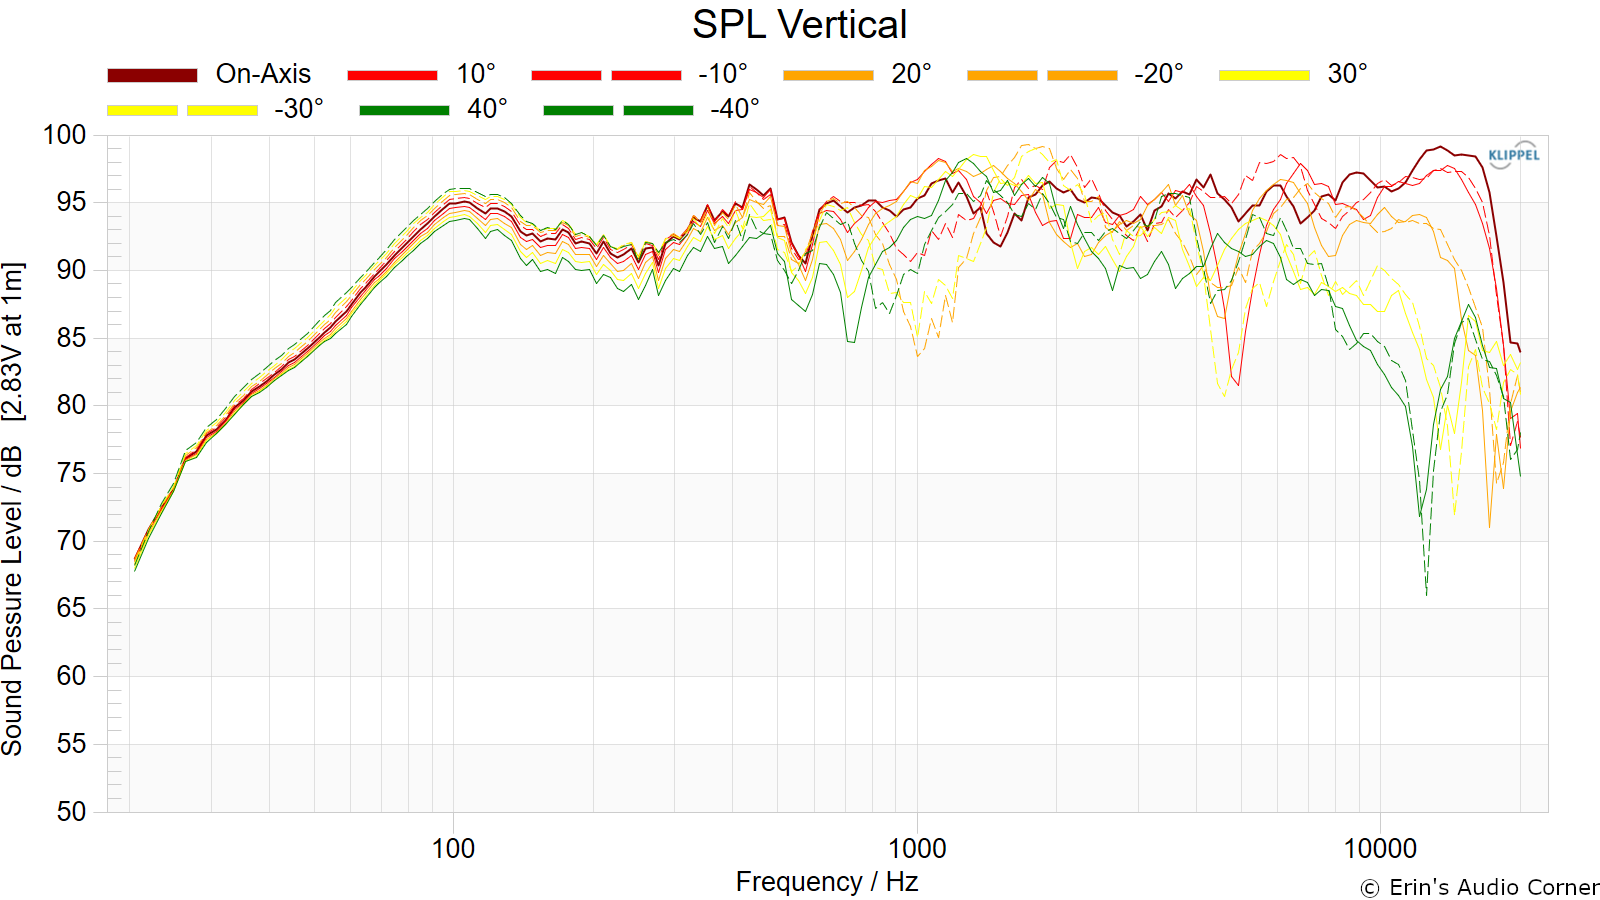
Vertical Frequency Response (0° to ±40°):
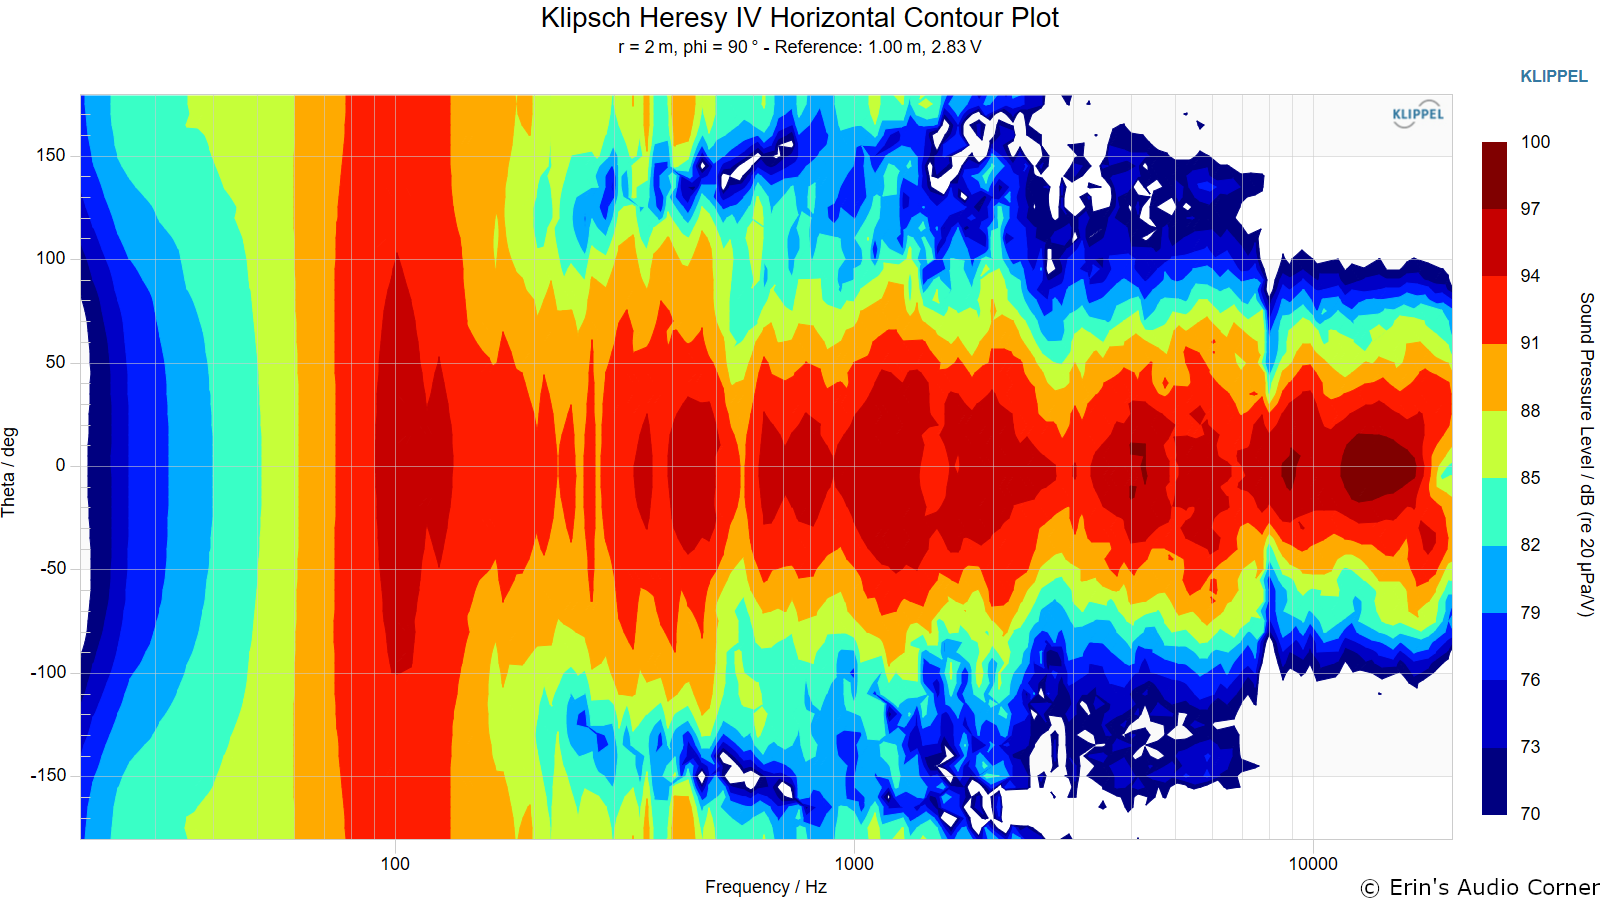
Horizontal Contour Plot (not normalized):
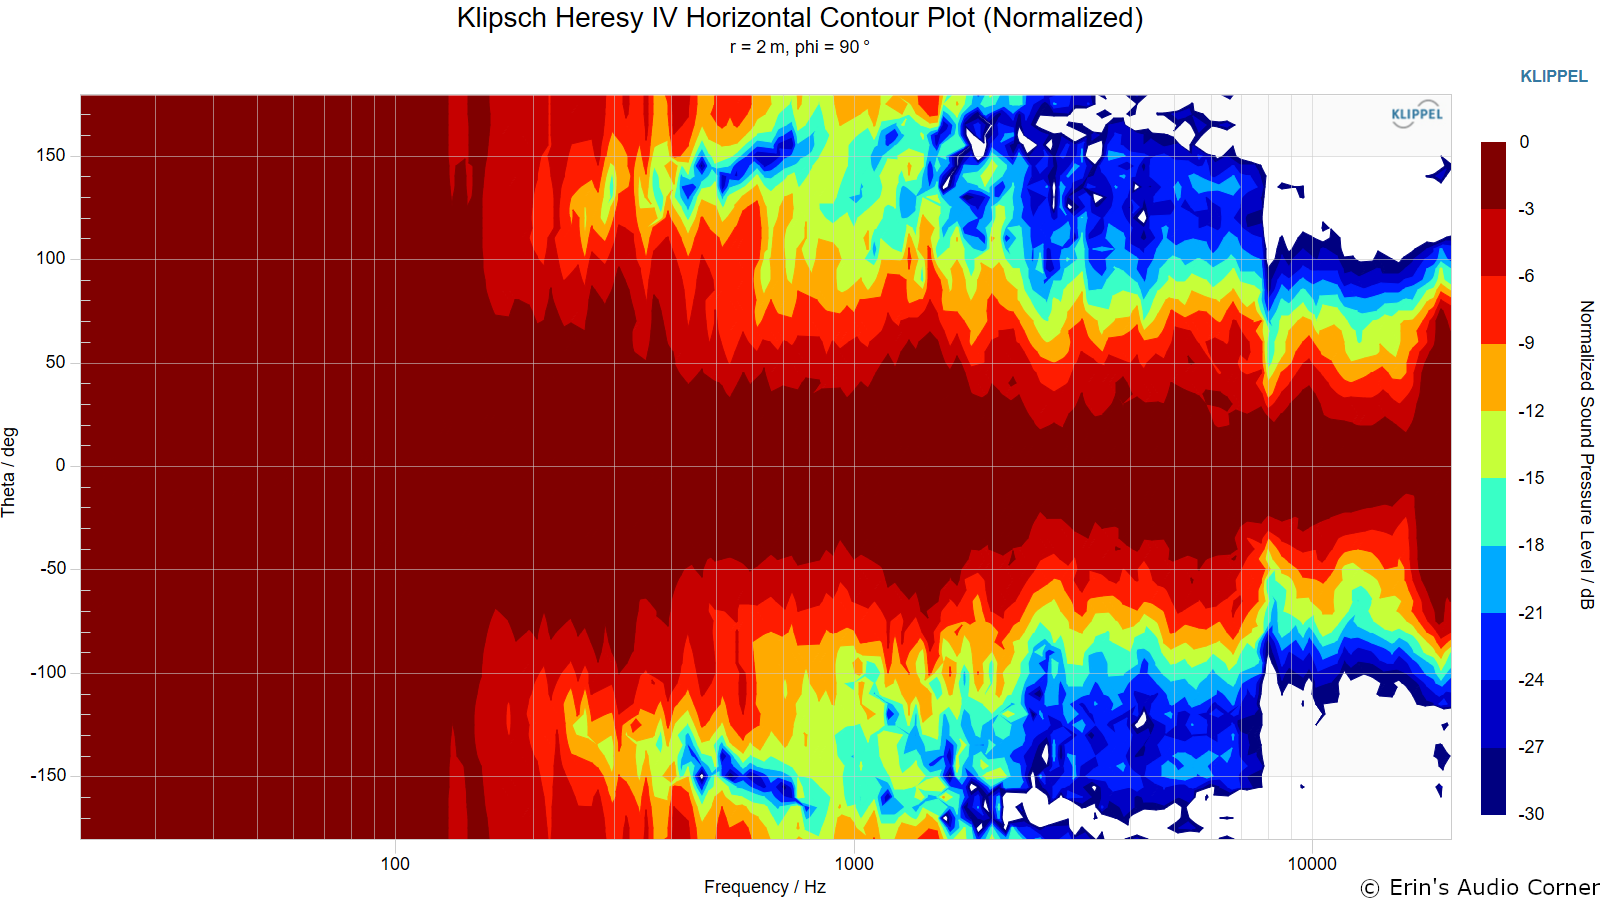
Horizontal Contour Plot (normalized):
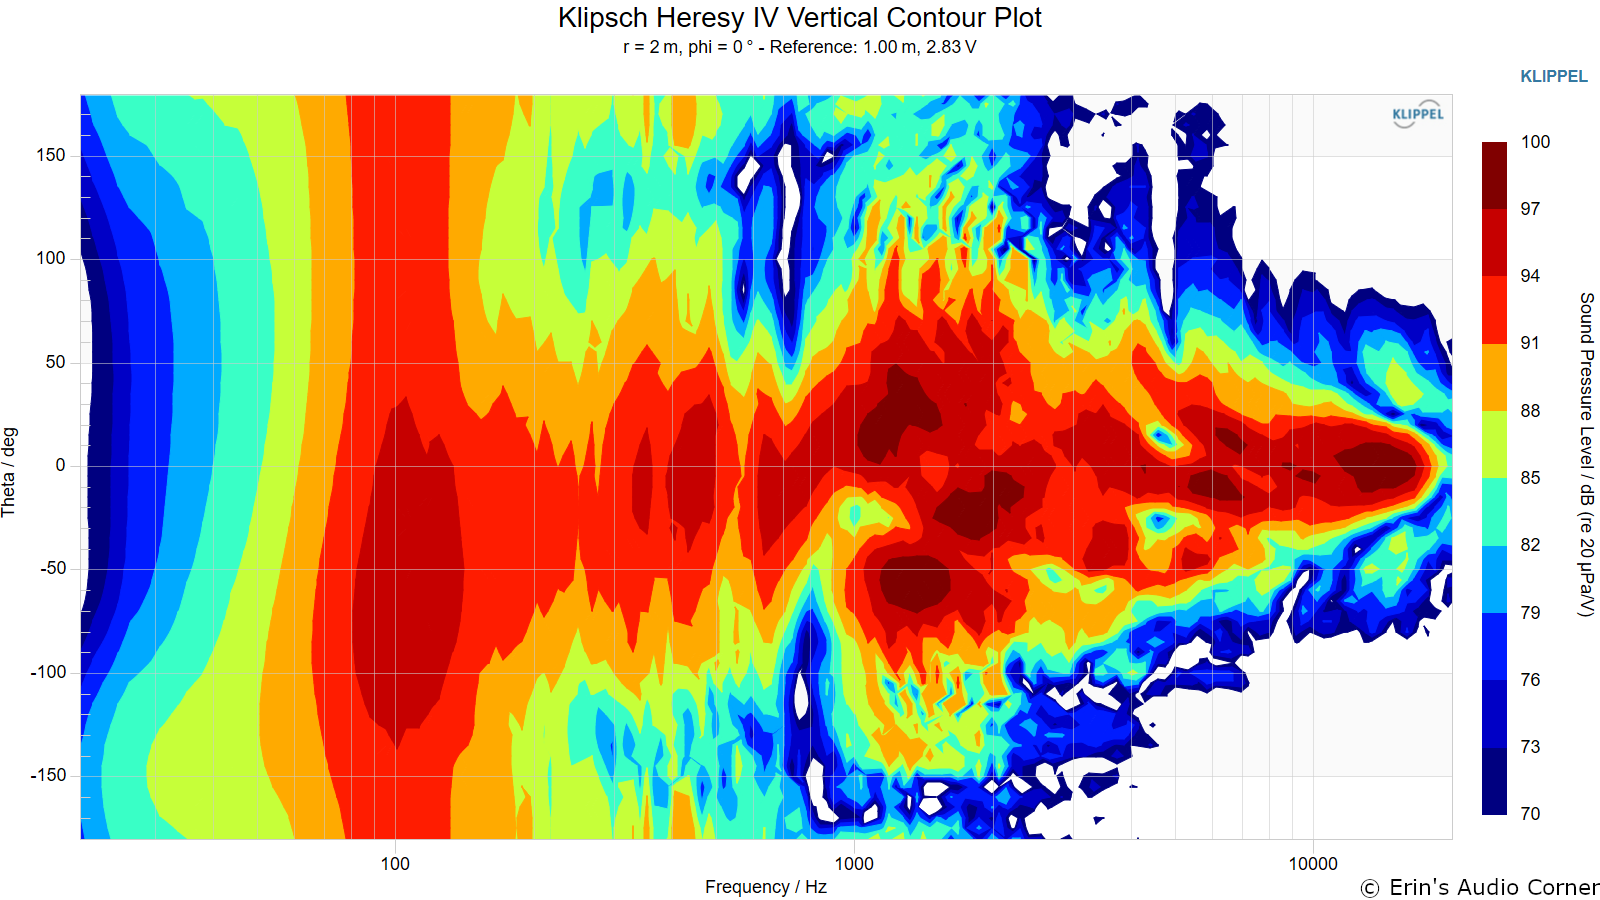
Vertical Contour Plot (not normalized):
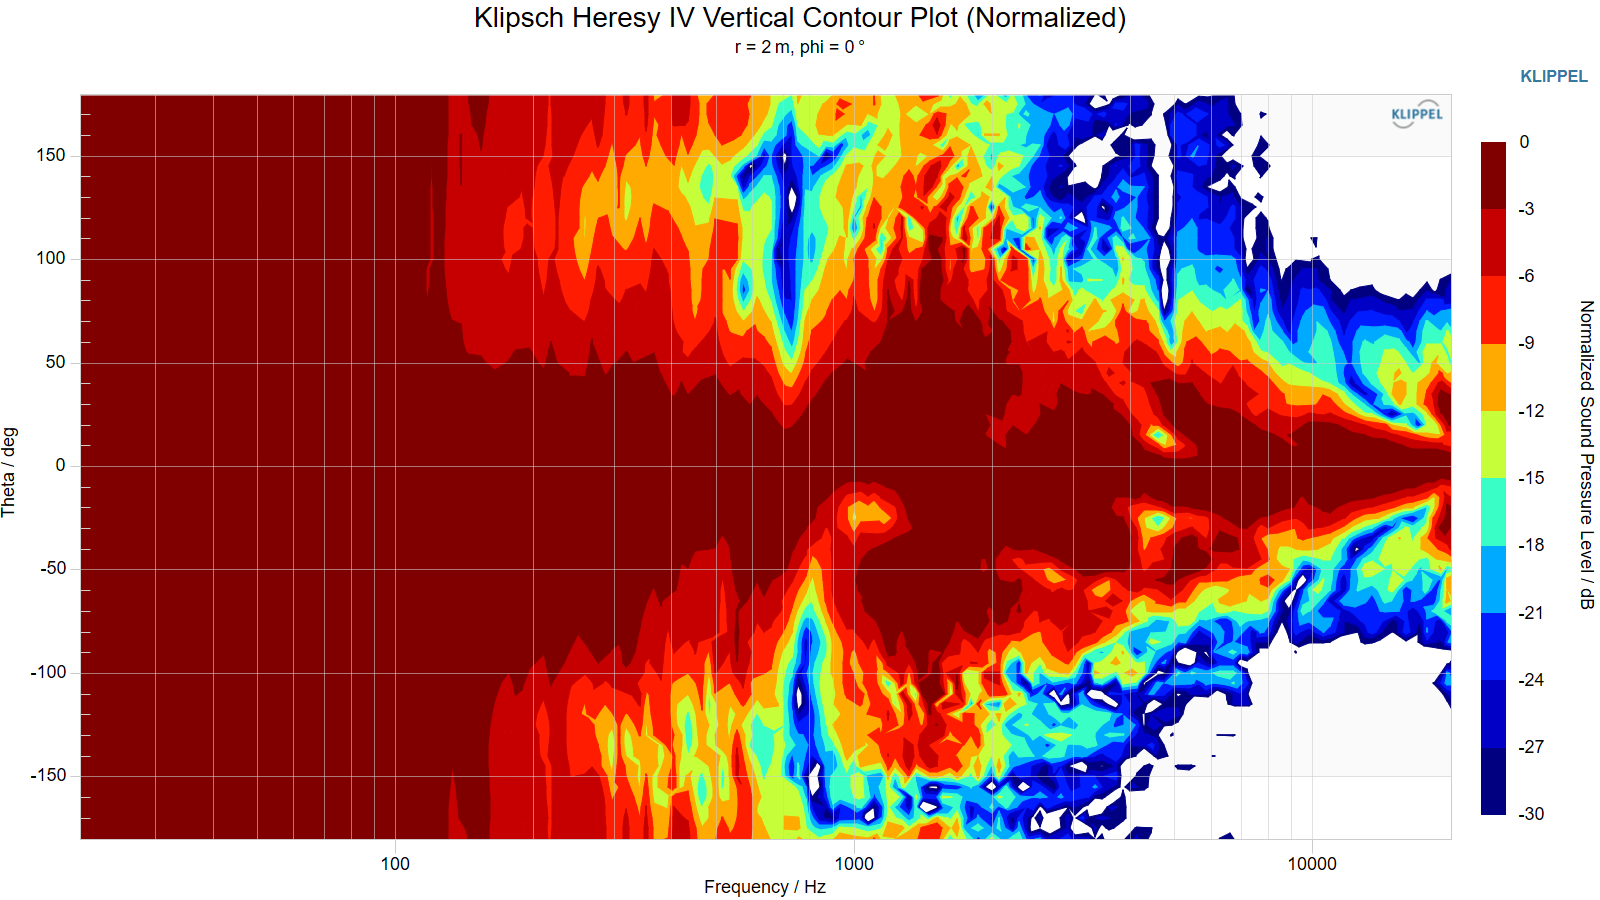
Vertical Contour Plot (normalized):
“Globe” Plots
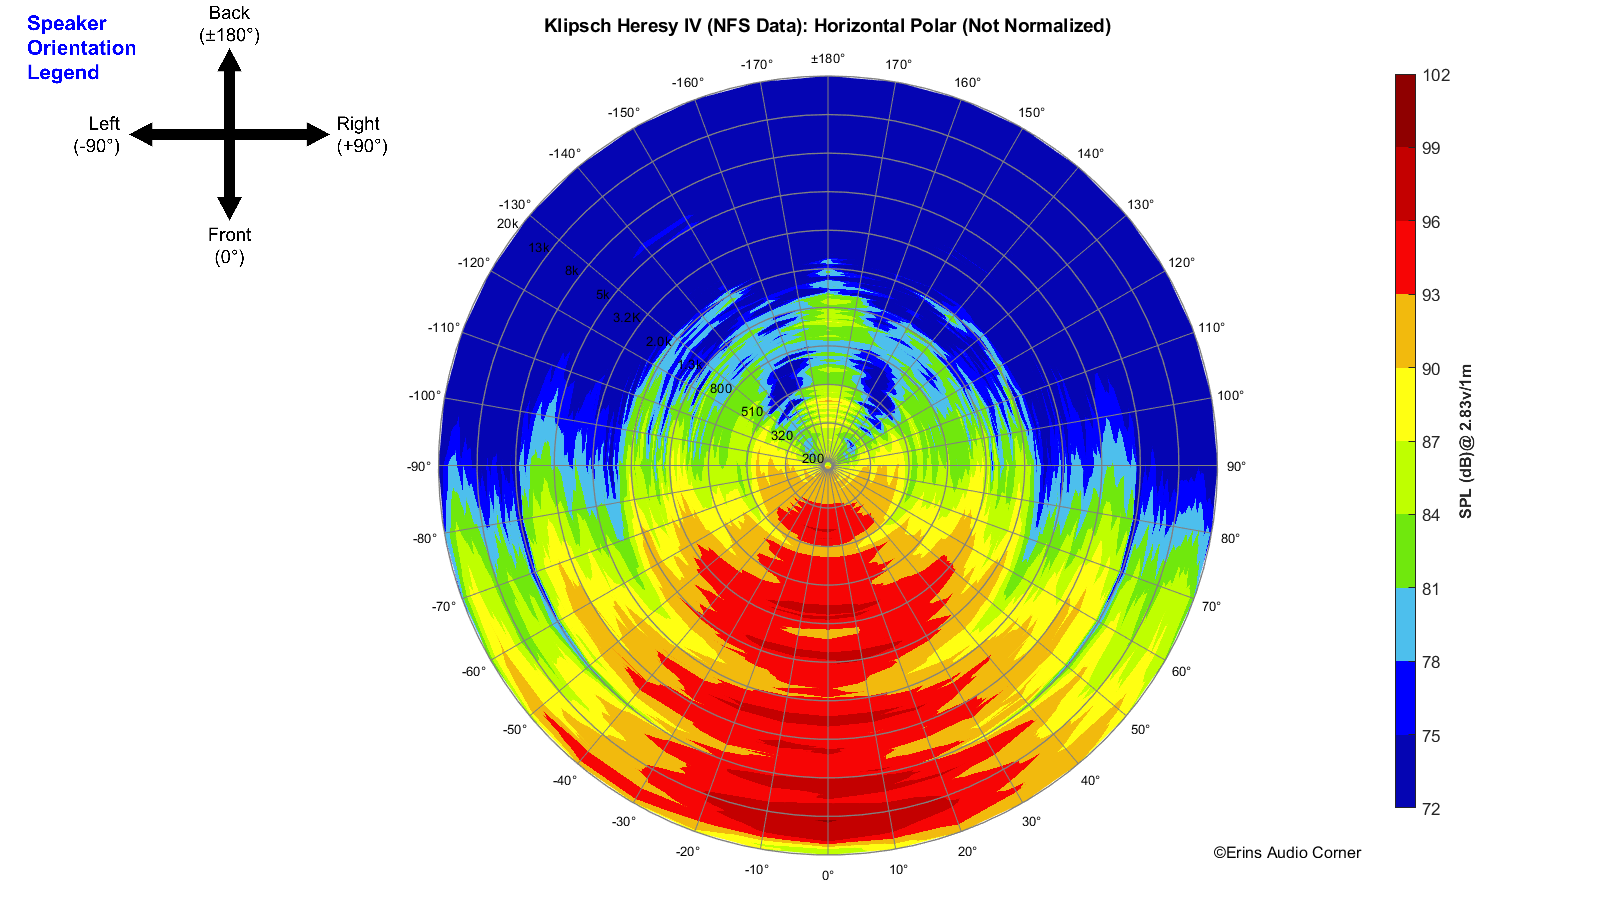
Horizontal Polar (Globe) Plot:
This represents the sound field at 2 meters - above 200Hz - per the legend in the upper left.
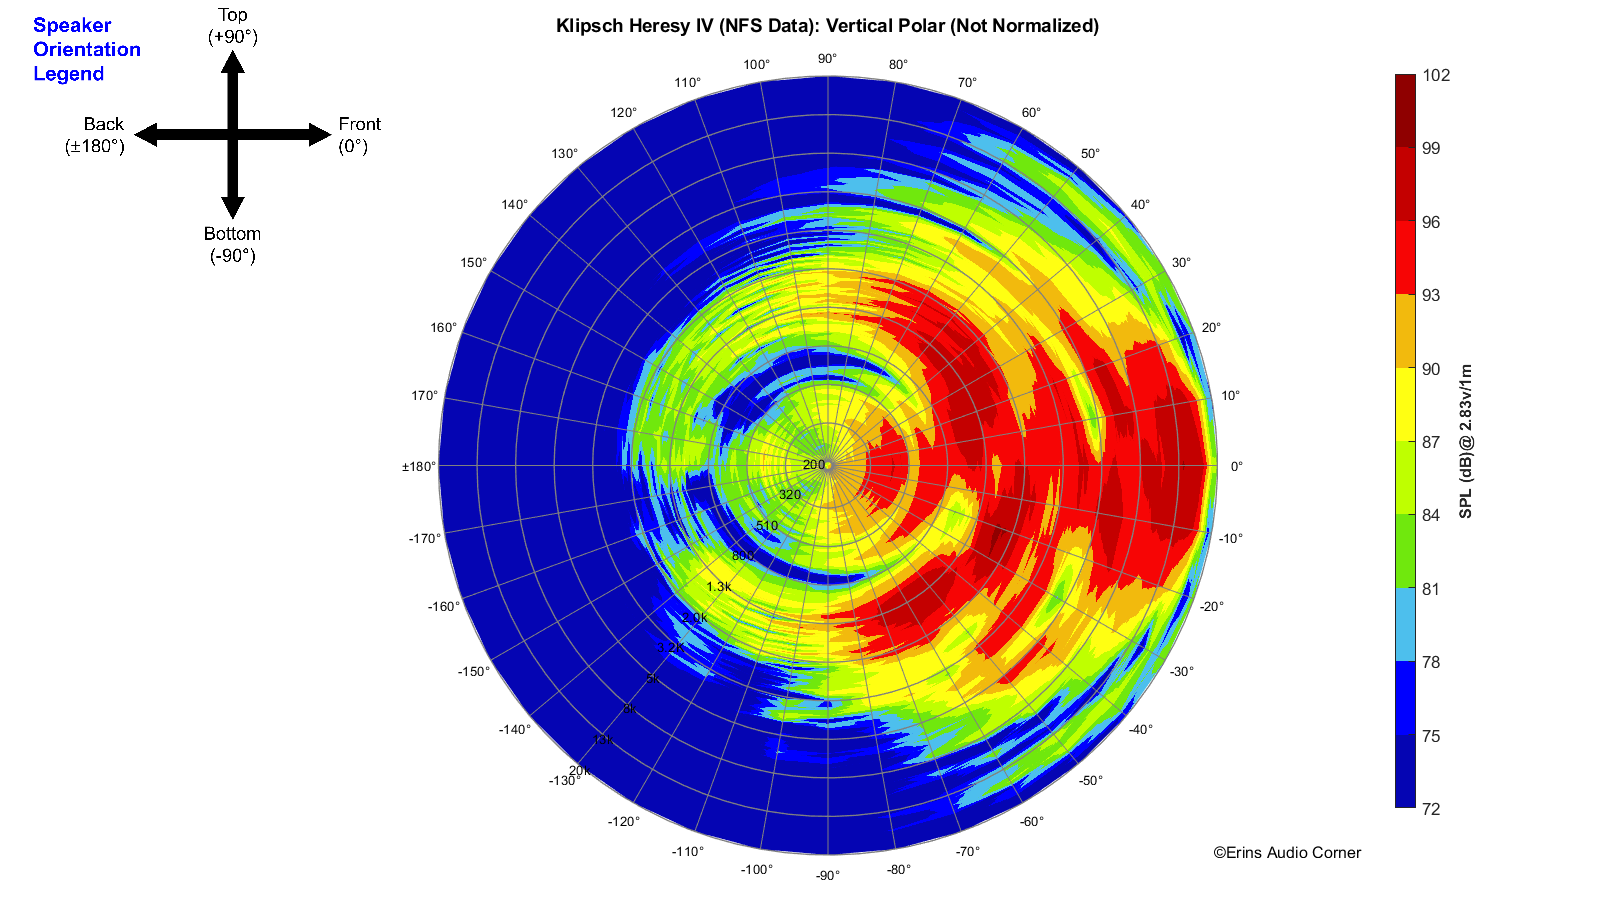
Vertical Polar (Globe) Plot:
This represents the sound field at 2 meters - above 200Hz - per the legend in the upper left.
Additional Measurements
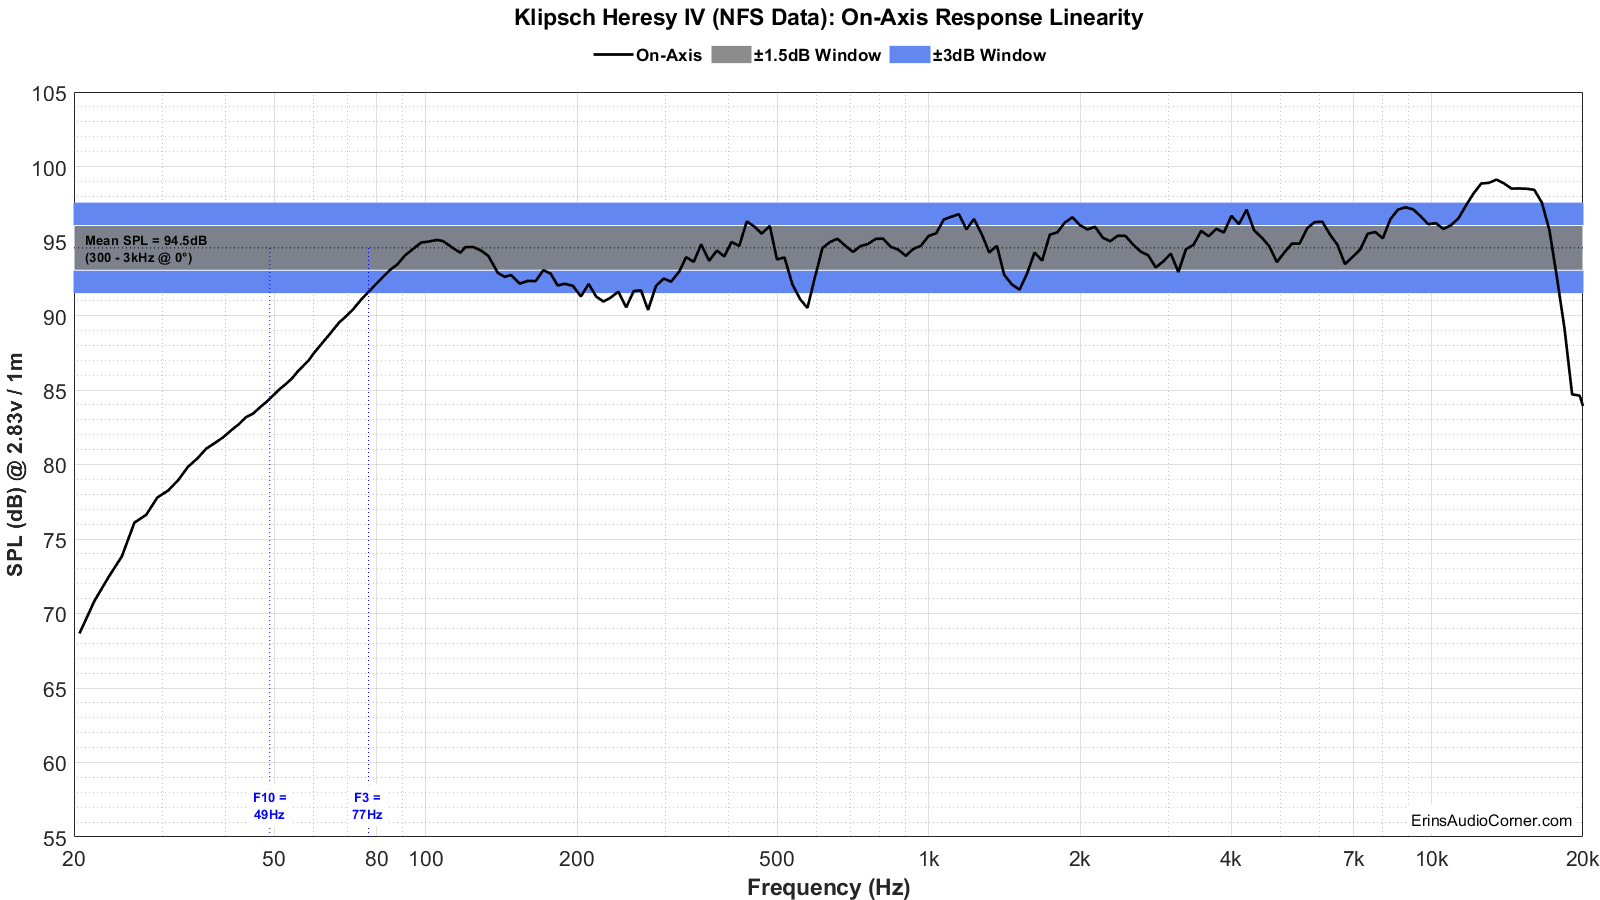
On-Axis Response Linearity
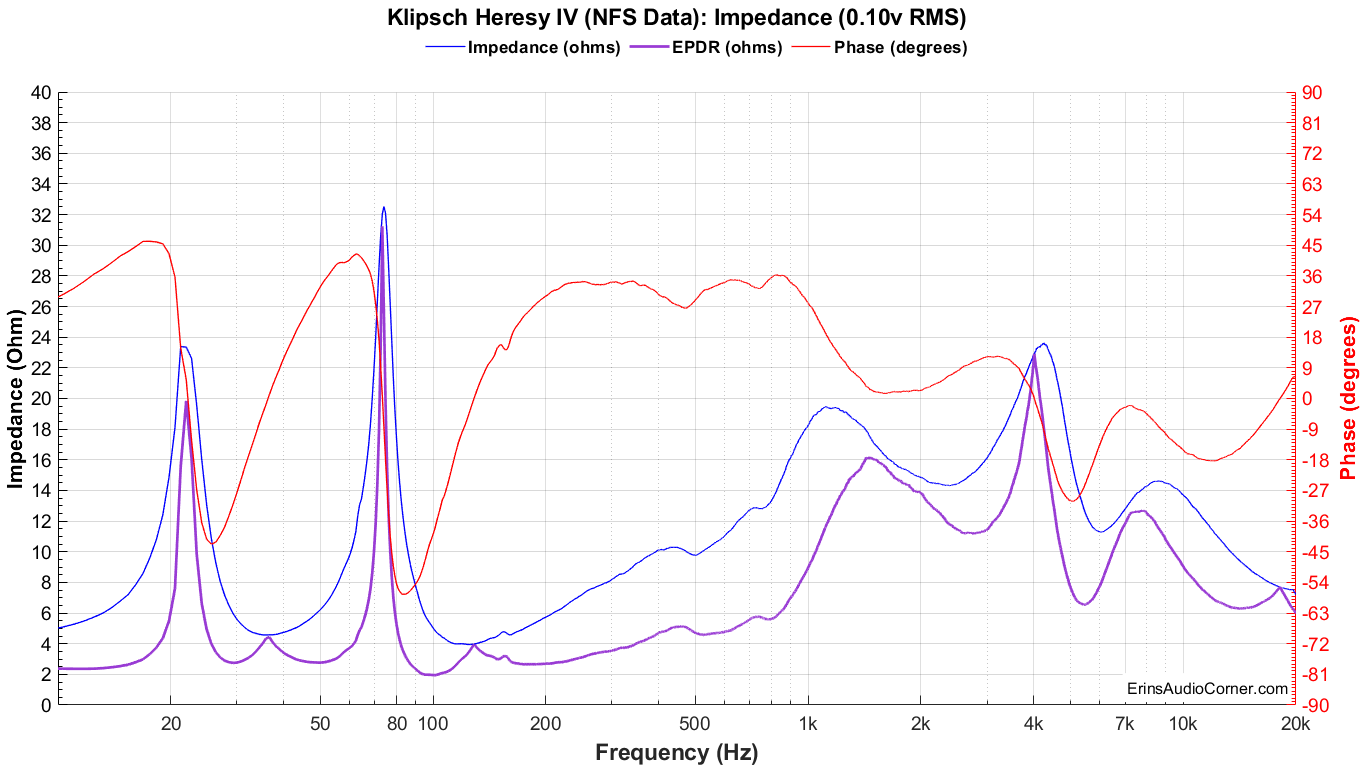
Impedance Magnitude and Phase + Equivalent Peak Dissipation Resistance (EPDR)
For those who do not know what EPDR is (ahem, myself until 2020), Keith Howard came up with this metric which he defined in a 2007 article for Stereophile as:
… simply the resistive load that would give rise to the same peak device dissipation as the speaker itself.
A note from Dr. Jack Oclee-Brown of Kef (who supplied the formula for calculating EPDR):
Just a note of caution that the EPDR derivation is based on a class-B output stage so it’s valid for typical class-AB amps but certainly not for class-A and probably has only marginal relevance for class-D amps (would love to hear from a class-D expert on this topic).
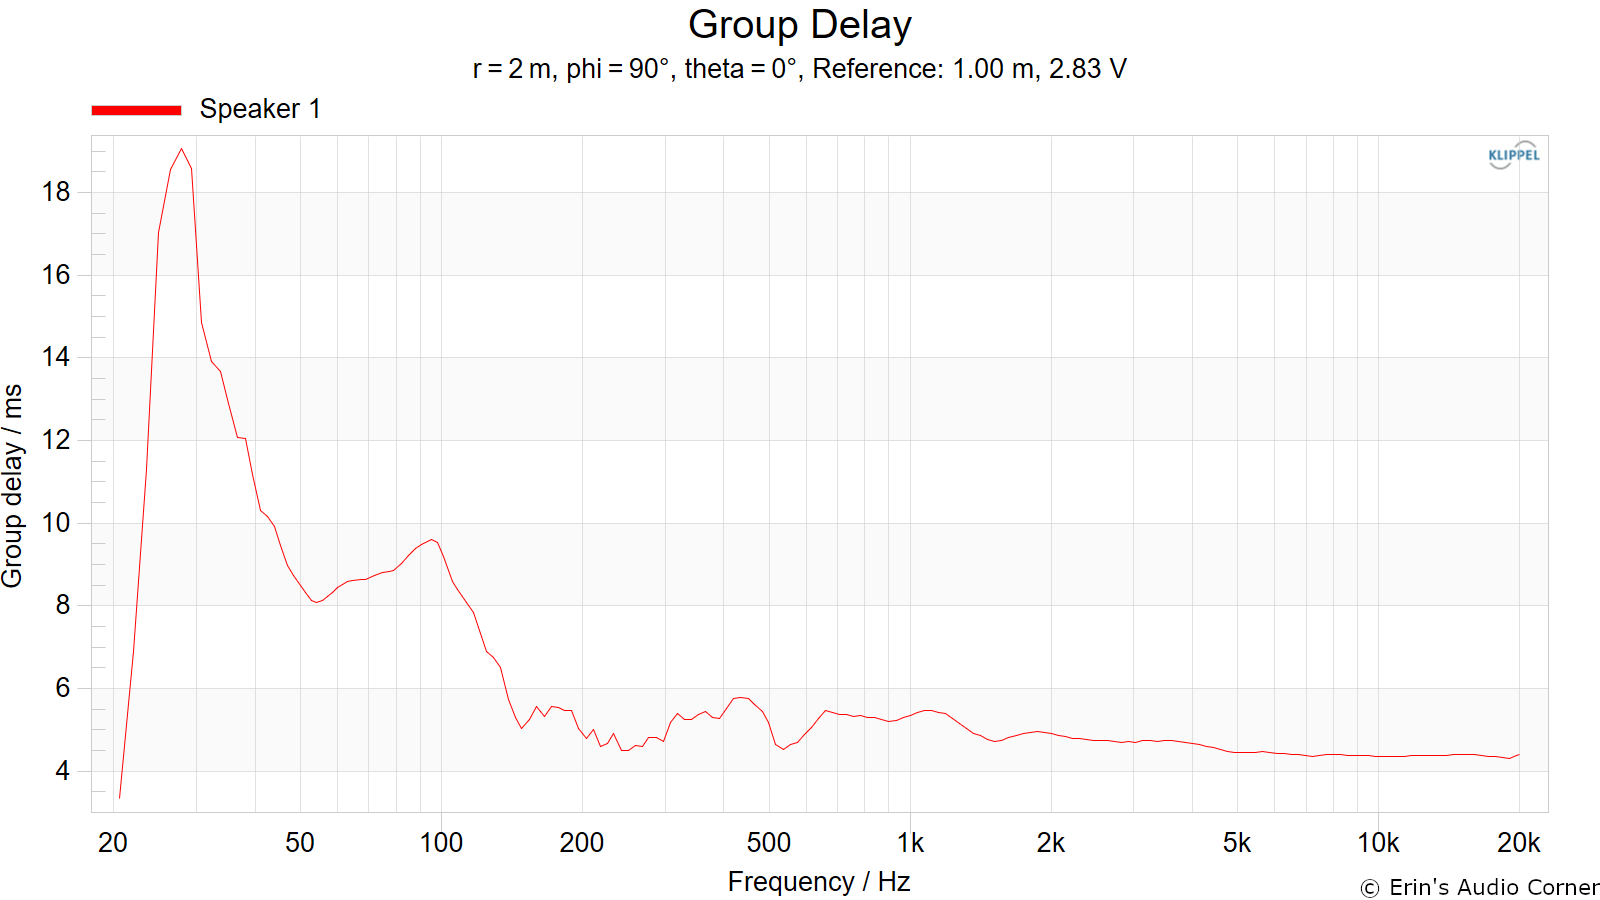
Group Delay (smoothed to 1/3-octave)
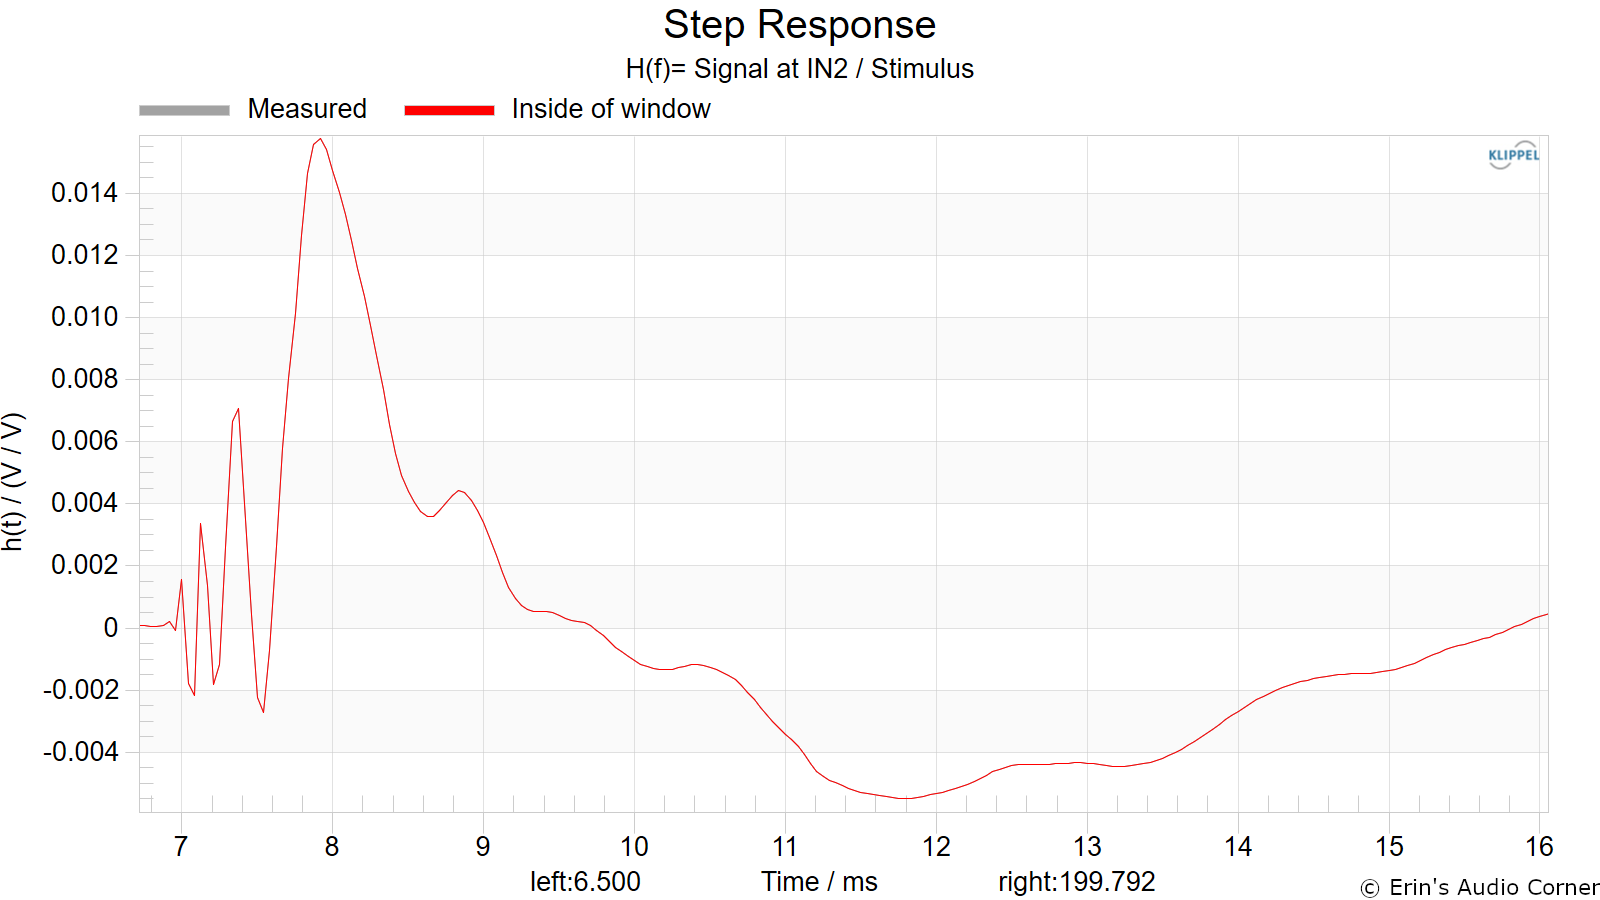
Step Response
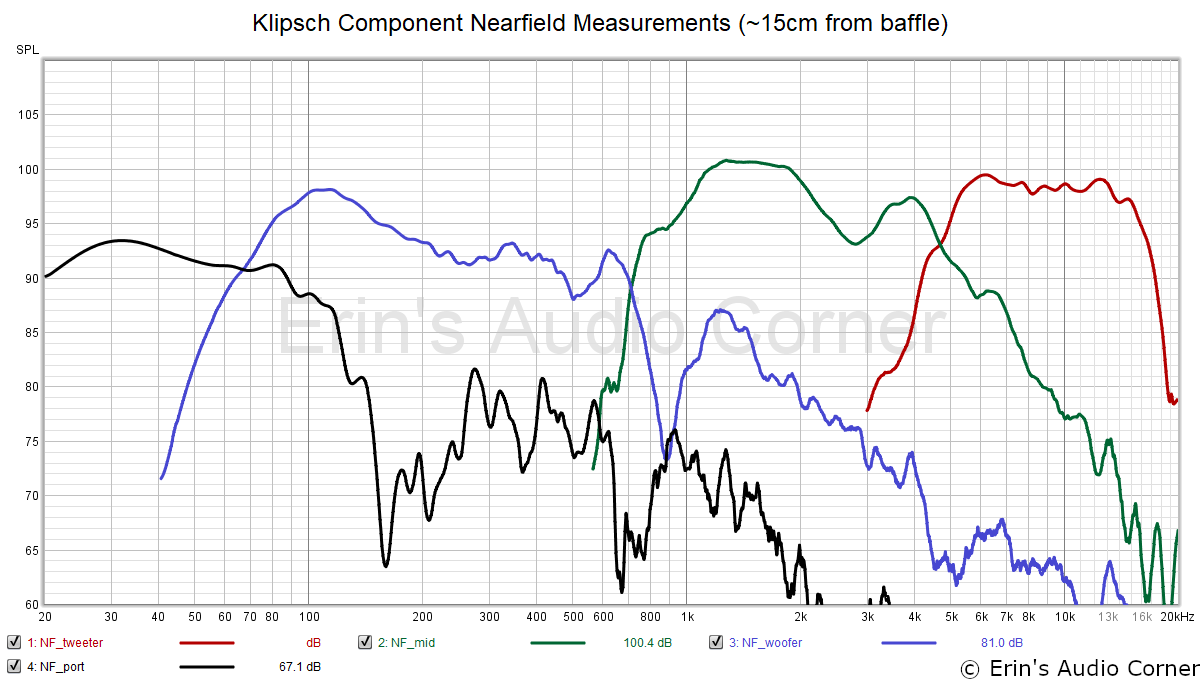
Near-Field Response
Nearfield response of individual drive units:
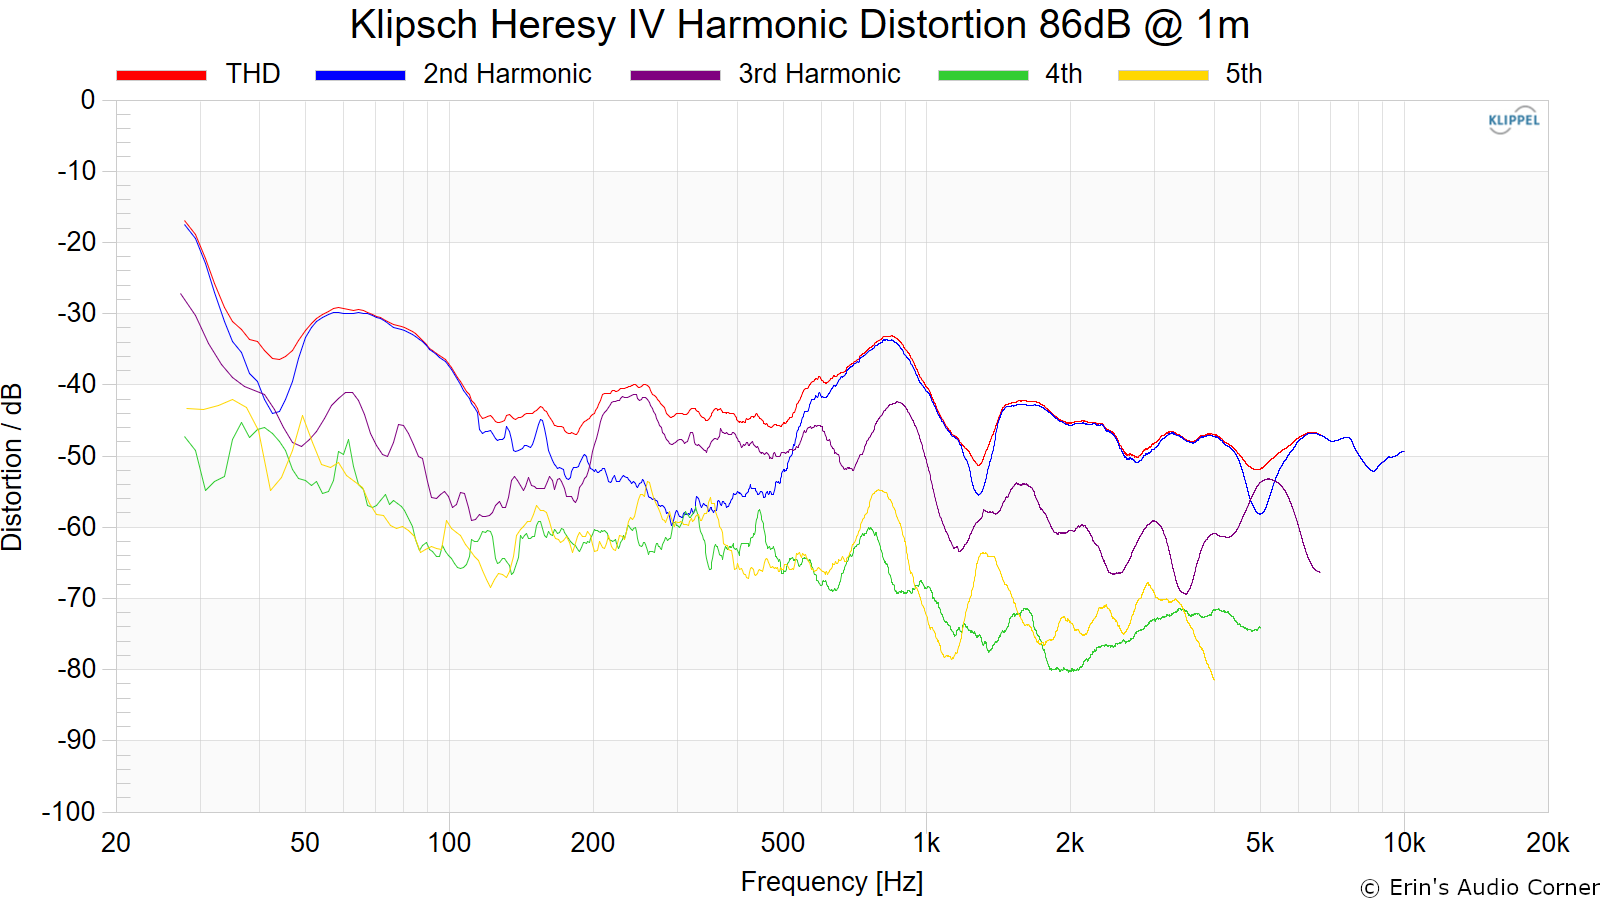
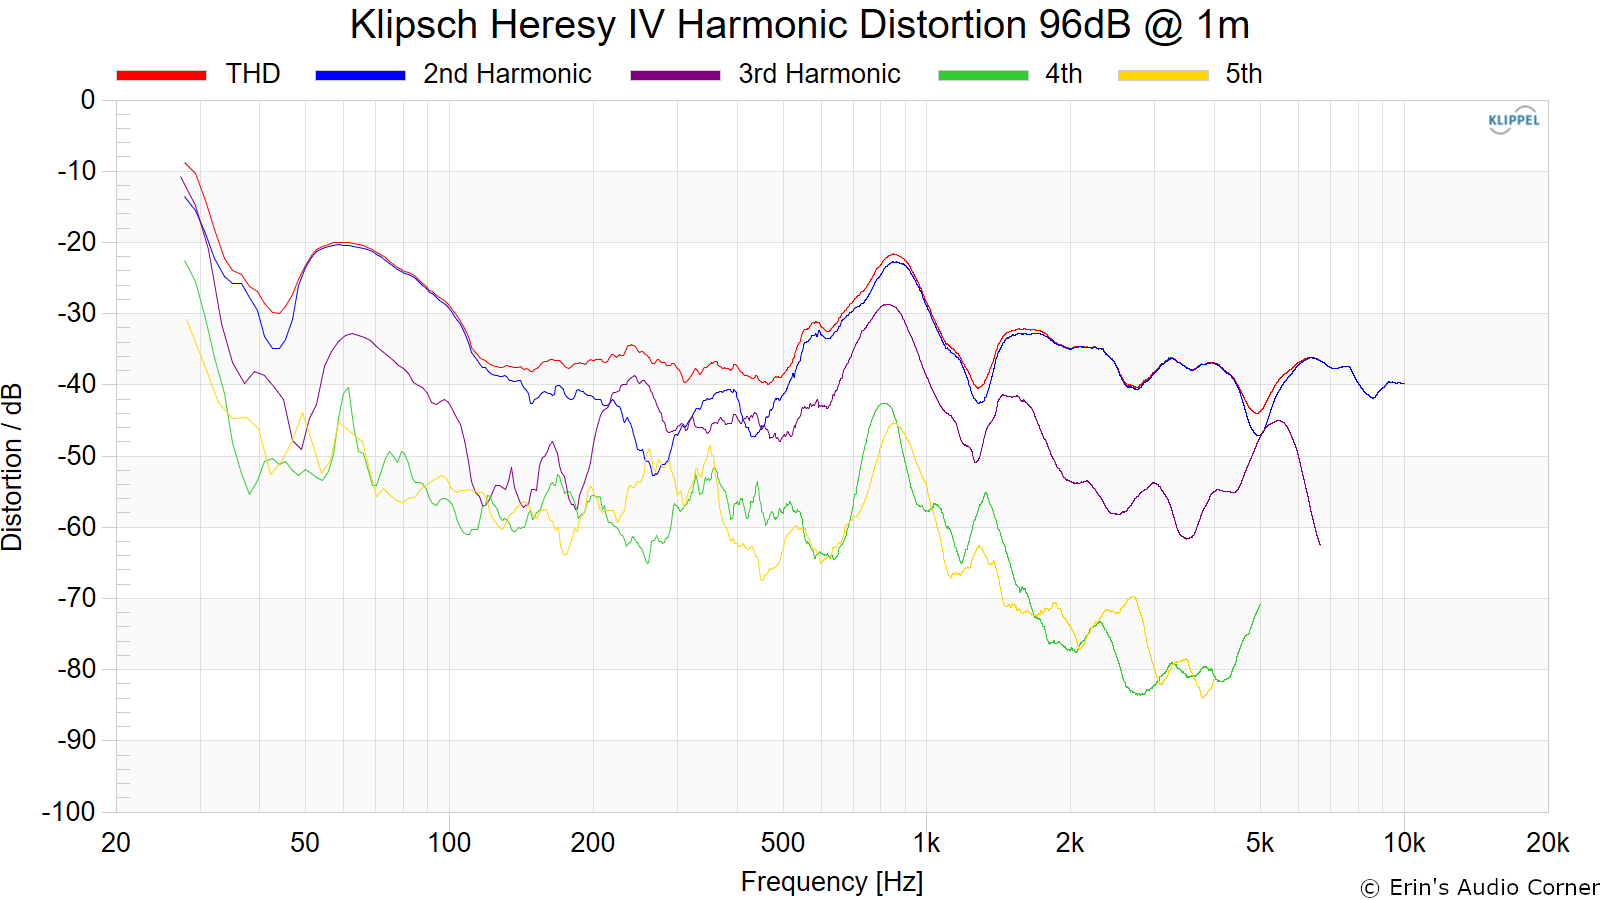
Harmonic Distortion
Harmonic Distortion at 86dB @ 1m:
Harmonic Distortion at 96dB @ 1m:
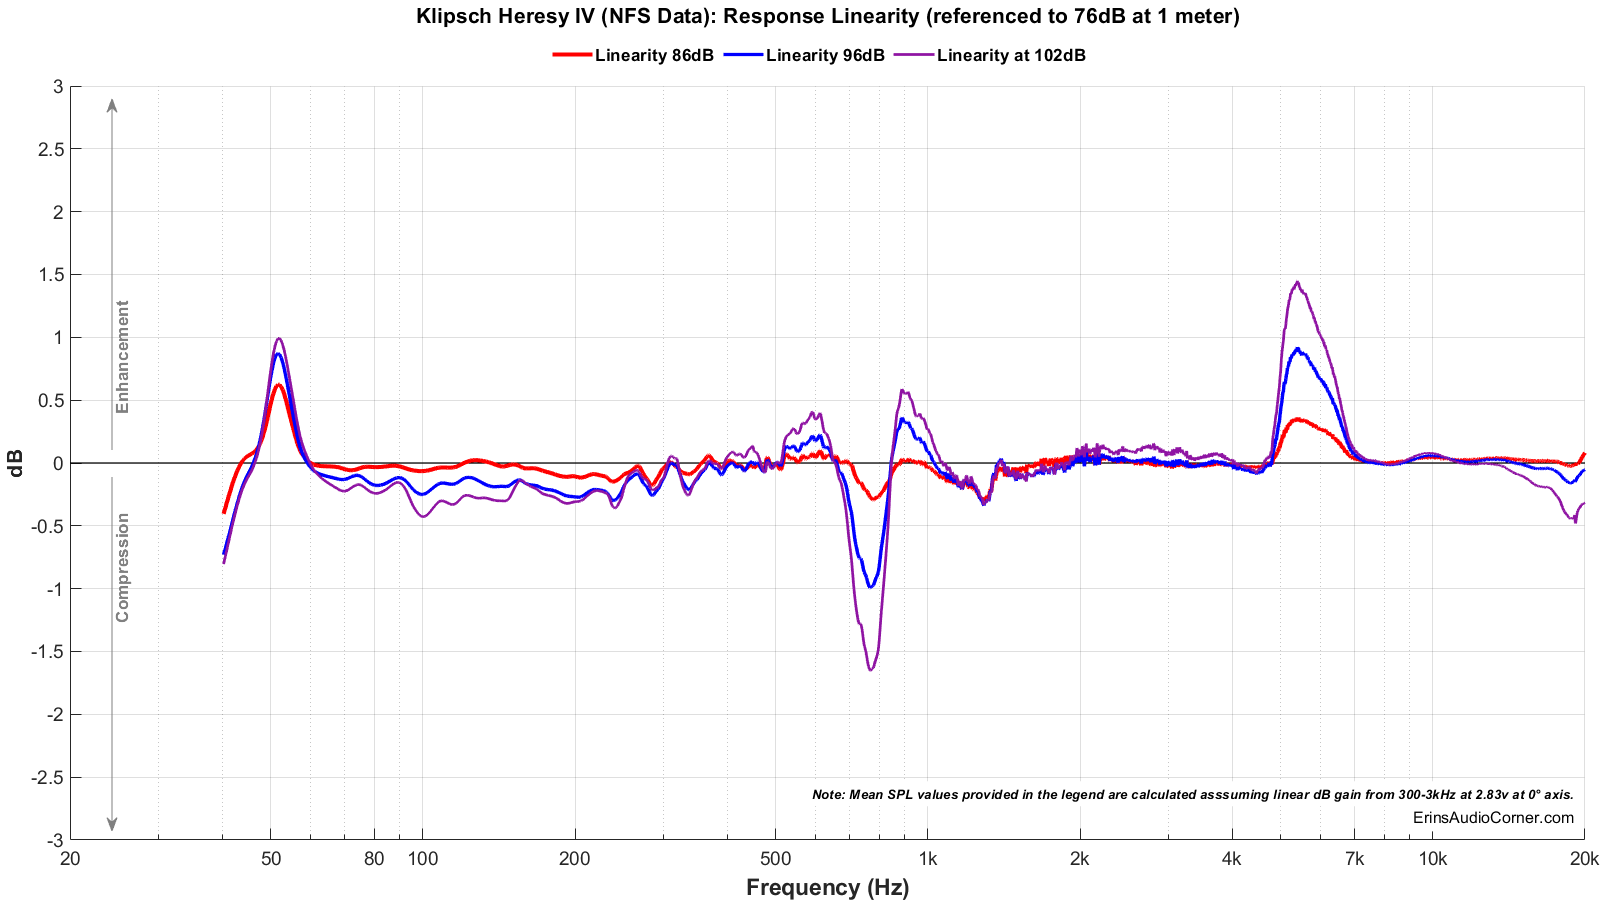
Dynamic Range (Instantaneous Compression Test)
The below graphic indicates just how much SPL is lost (compression) or gained (enhancement; usually due to distortion) when the speaker is played at higher output volumes instantly via a 2.7 second logarithmic sine sweep referenced to 76dB at 1 meter. The signals are played consecutively without any additional stimulus applied. Then normalized against the 76dB result.
The tests are conducted in this fashion:
- 76dB at 1 meter (baseline; black)
- 86dB at 1 meter (red)
- 96dB at 1 meter (blue)
- 102dB at 1 meter (purple)
The purpose of this test is to illustrate how much (if at all) the output changes as a speaker’s components temperature increases (i.e., voice coils, crossover components) instantaneously.
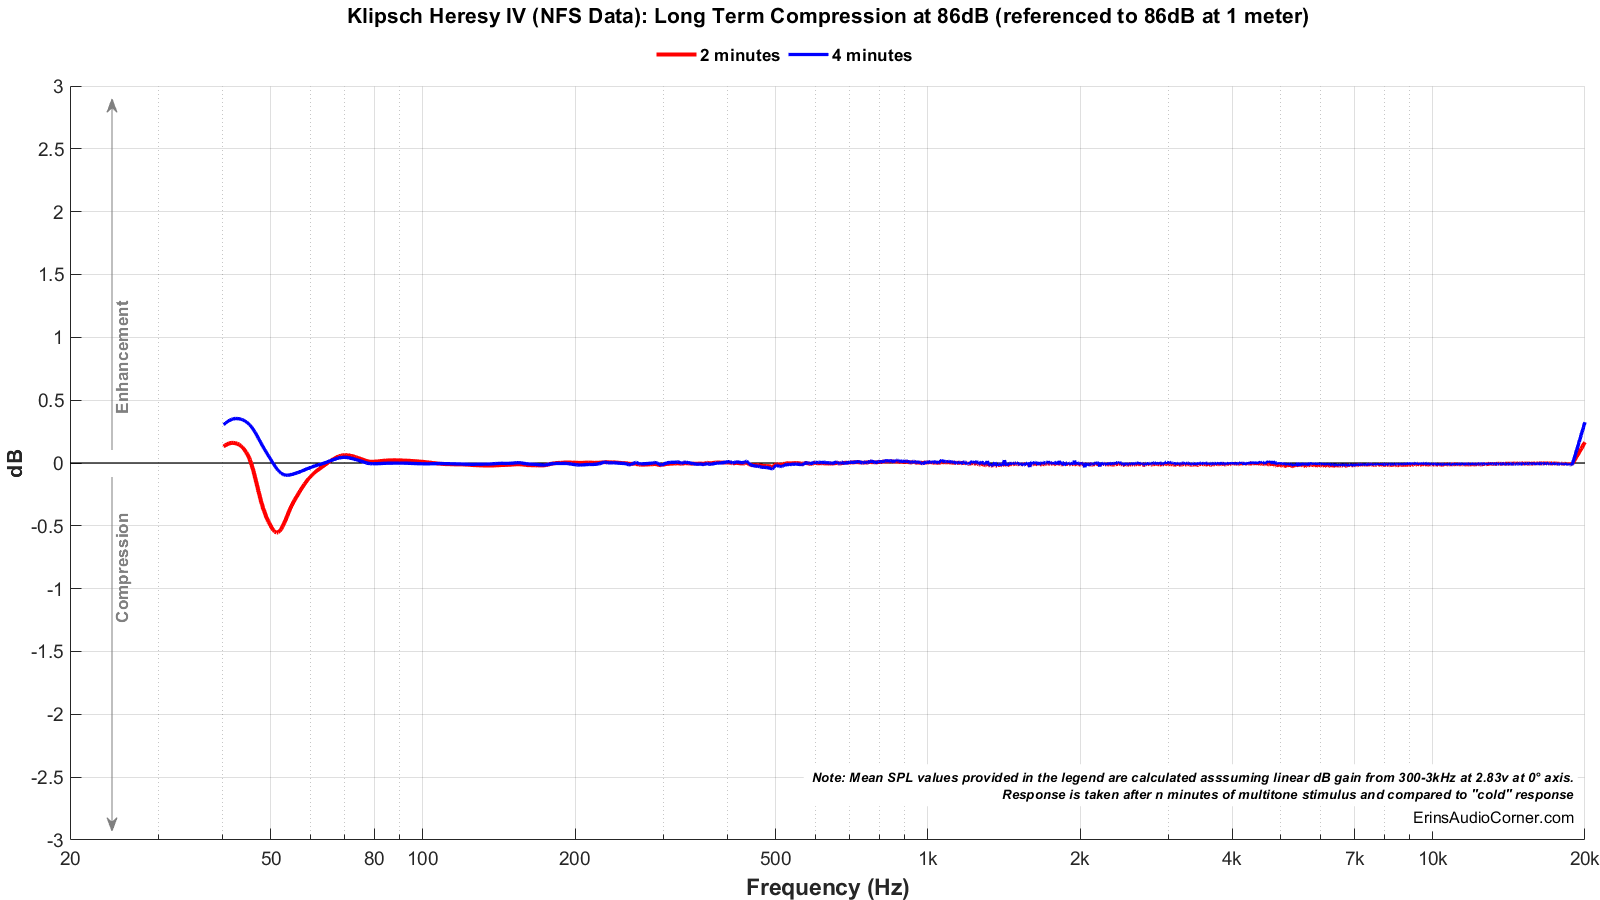
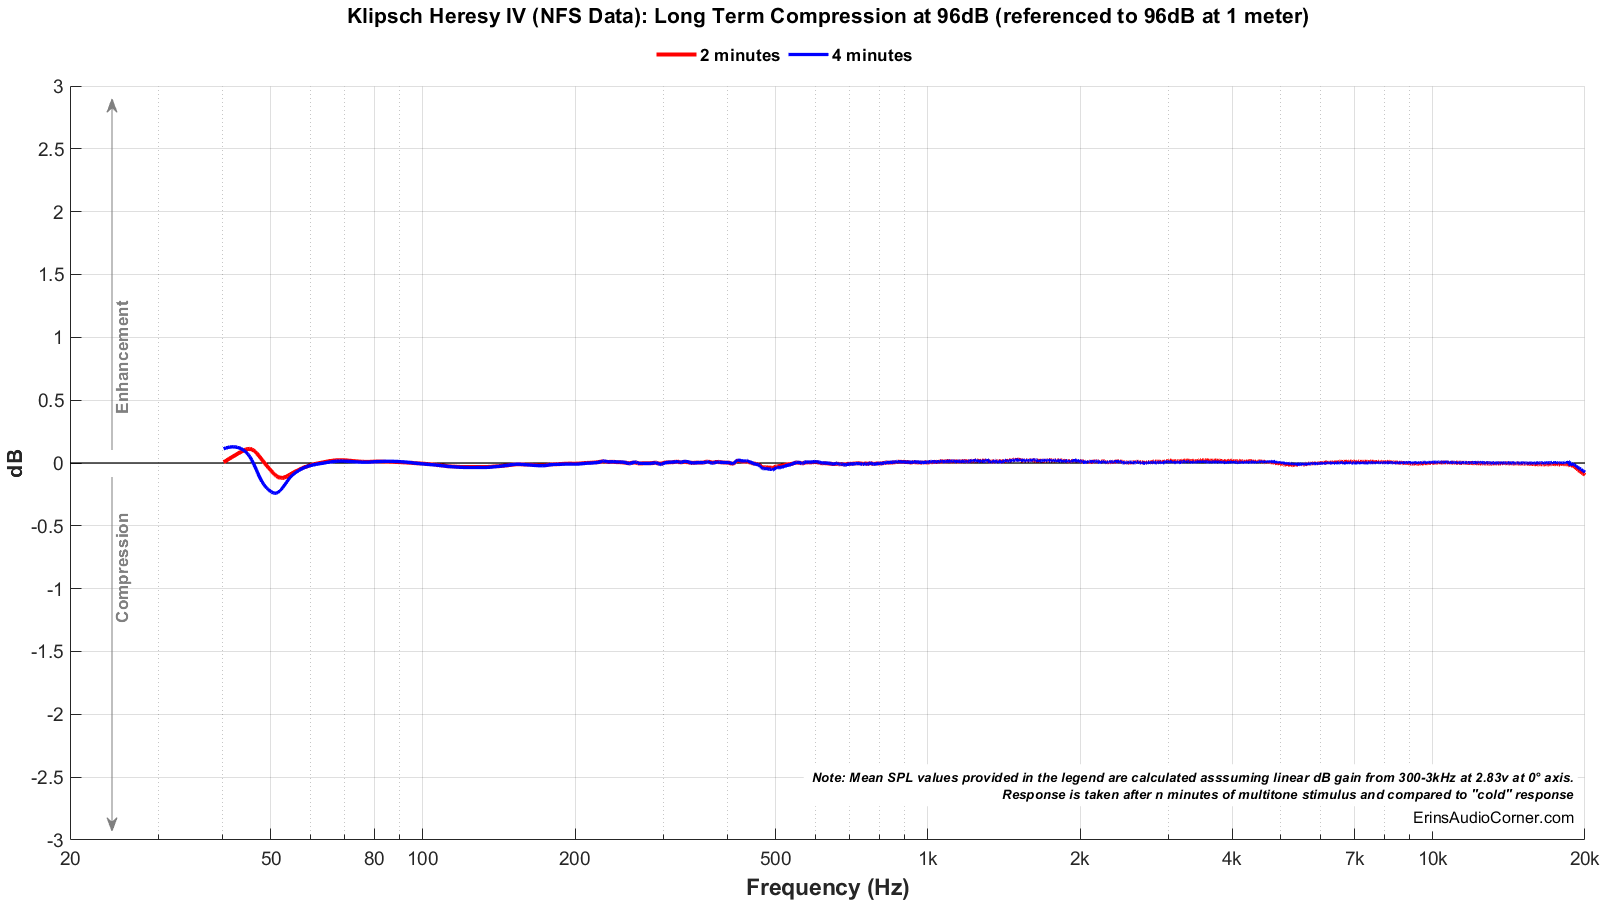
Long Term Compression Tests
The below graphics indicate how much SPL is lost or gained in the long-term as a speaker plays at the same output level for 2 minutes, in intervals. Each graphic represents a different SPL: 86dB and 96dB both at 1 meter.
The purpose of this test is to illustrate how much (if at all) the output changes as a speaker’s components temperature increases (i.e., voice coils, crossover components).
The tests are conducted in this fashion:
- “Cold” logarithmic sine sweep (no stimulus applied beforehand)
- Multitone stimulus played at desired SPL/distance for 2 minutes; intended to represent music signal
- Interim logarithmic sine sweep (no stimulus applied beforehand) (Red in graphic)
- Multitone stimulus played at desired SPL/distance for 2 minutes; intended to represent music signal
- Final logarithmic sine sweep (no stimulus applied beforehand) (Blue in graphic)
The red and blue lines represent changes in the output compared to the initial “cold” test.
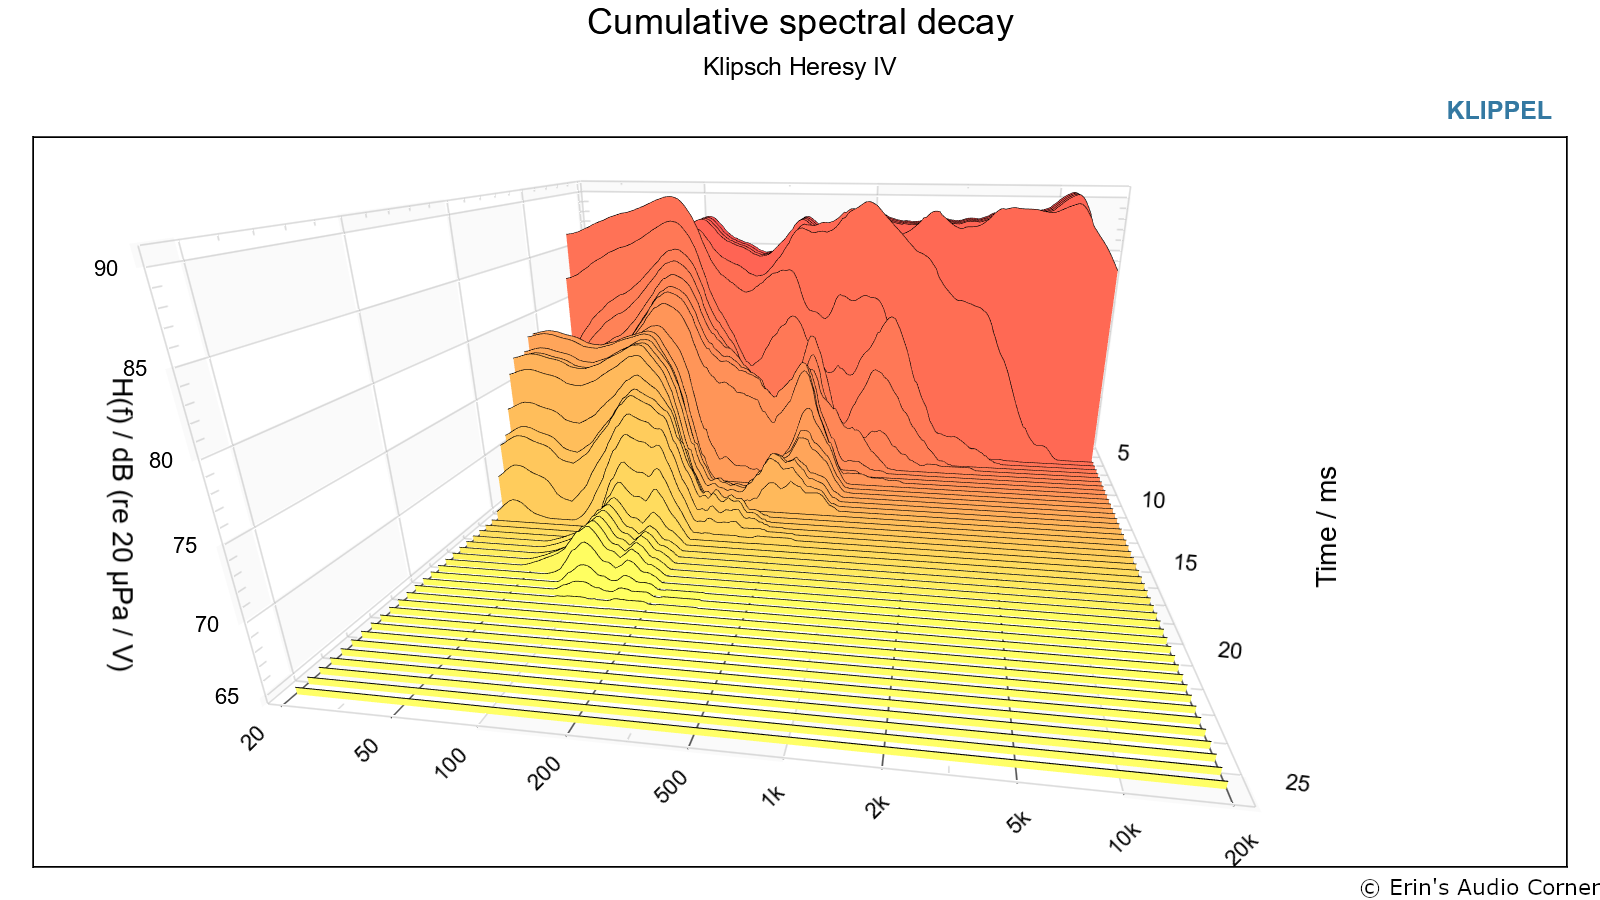
Cumulative Spectral Decay (CSD)
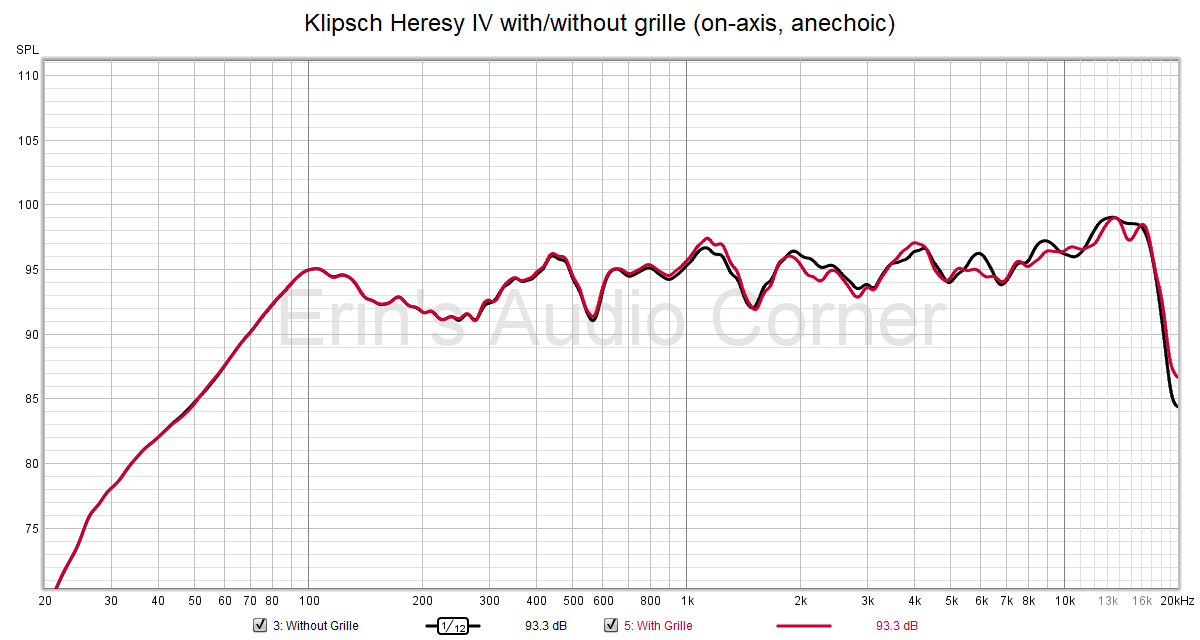
Grille Effect
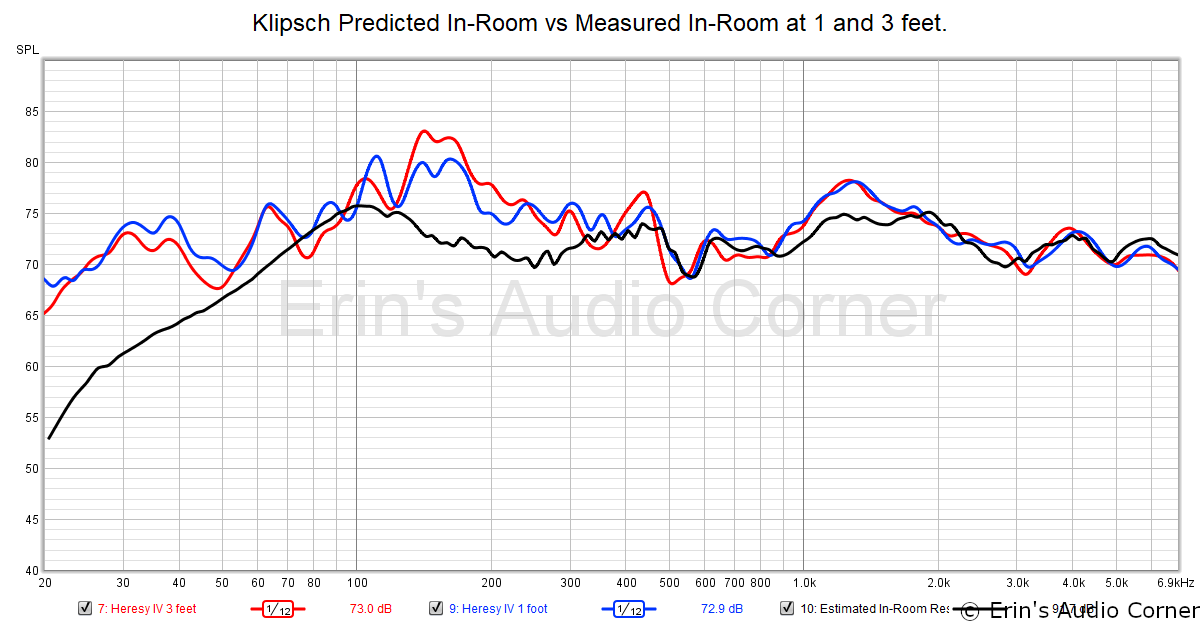
In-Room Response vs Prediction
Below is a set of measurements comparing the in-room measured response (using the moving microphone method) vs the predicted in-room response.
Parting / Random Thoughts
If you want to see the music I use for evaluating speakers subjectively, see my Spotify playlist.
I always listen to speakers before I measure them. This ensures I am not swayed by the measurements before I listen.
Given the number of people who assume these (as well as other Klipsch speakers) need to be listened to using a tube amplifier, I reached out to Klipsch to ask specifically what their recommendation was. Below is their quoted reply:
As far as amps go - there are many great amps out there, tubes and solid state, our speakers work well with either, they are extremely efficient and do not require much power and sound good with most amps including integrated AVR’s. That being said, a high end amplifier could make a big difference in overall experience. Tube style amps are well regarded in audiophile community but there are many great sounding options that are solid state as well. Talk to your favorite hi-fi dealer for more specific recommendations.
Under their advisement, I listened to these speakers using a Parasound HINT-6 (note: affiliate link) which was recommended to me by a Klipsch dealer.
Look, the simple story here is I do not like this speaker. I do not care for how it sounds for a number of reasons but to name a few:
- the numerous resonances throughout the low/midrange thanks to standing waves and/or port (notably, the two at ~120Hz and ~160Hz made lower male vocals very, very “boomy”) (what appears to be a cone breakup mode ~600Hz).
- Very poor directivity control. As one driver hands off to the other (i.e., woofer to midrange), the crossover network does not make for a smooth integration off-axis which results in strong room coloration and very poor timbre matching from the direct (on-axis) sound to that of the reflected (off-axis) sound; muddying up not only the tonality but also causing the images in the soundstage to move about in a non-cohesive way.
- The midrange dip from 100-400Hz tends to make male and female vocal fundamentals sound “thin” but are juxtaposed with the aforementioned resonances.
- Little to no bass, even in room against a wall (as evidenced via my in-room measurements).
I know there is a core group of people who like this speaker. I’m not in that group. If you like it, don’t let my words discourage you. Rather, use this data as a guide to help you understand what it is you like about this speaker, in the same manner I used it to help me identify things I did not like when I auditioned them. As stated in the Foreword, this written review is purposely a cliff’s notes version. For more details about the performance (objectively and subjectively) please watch the YouTube video.
Support the Cause
If you like what you see here and want to help support the cause there are a few ways you can do so:
-
Using my affiliate links which helps me gain a small commission at no additional cost to you.
Your support helps me pay for new items to test, hardware, miscellaneous items and costs of the site’s server space and bandwidth and is very much appreciated.
You can also join my Facebook and YouTube pages if you’d like to follow along with updates.