Foreword / YouTube Video Review
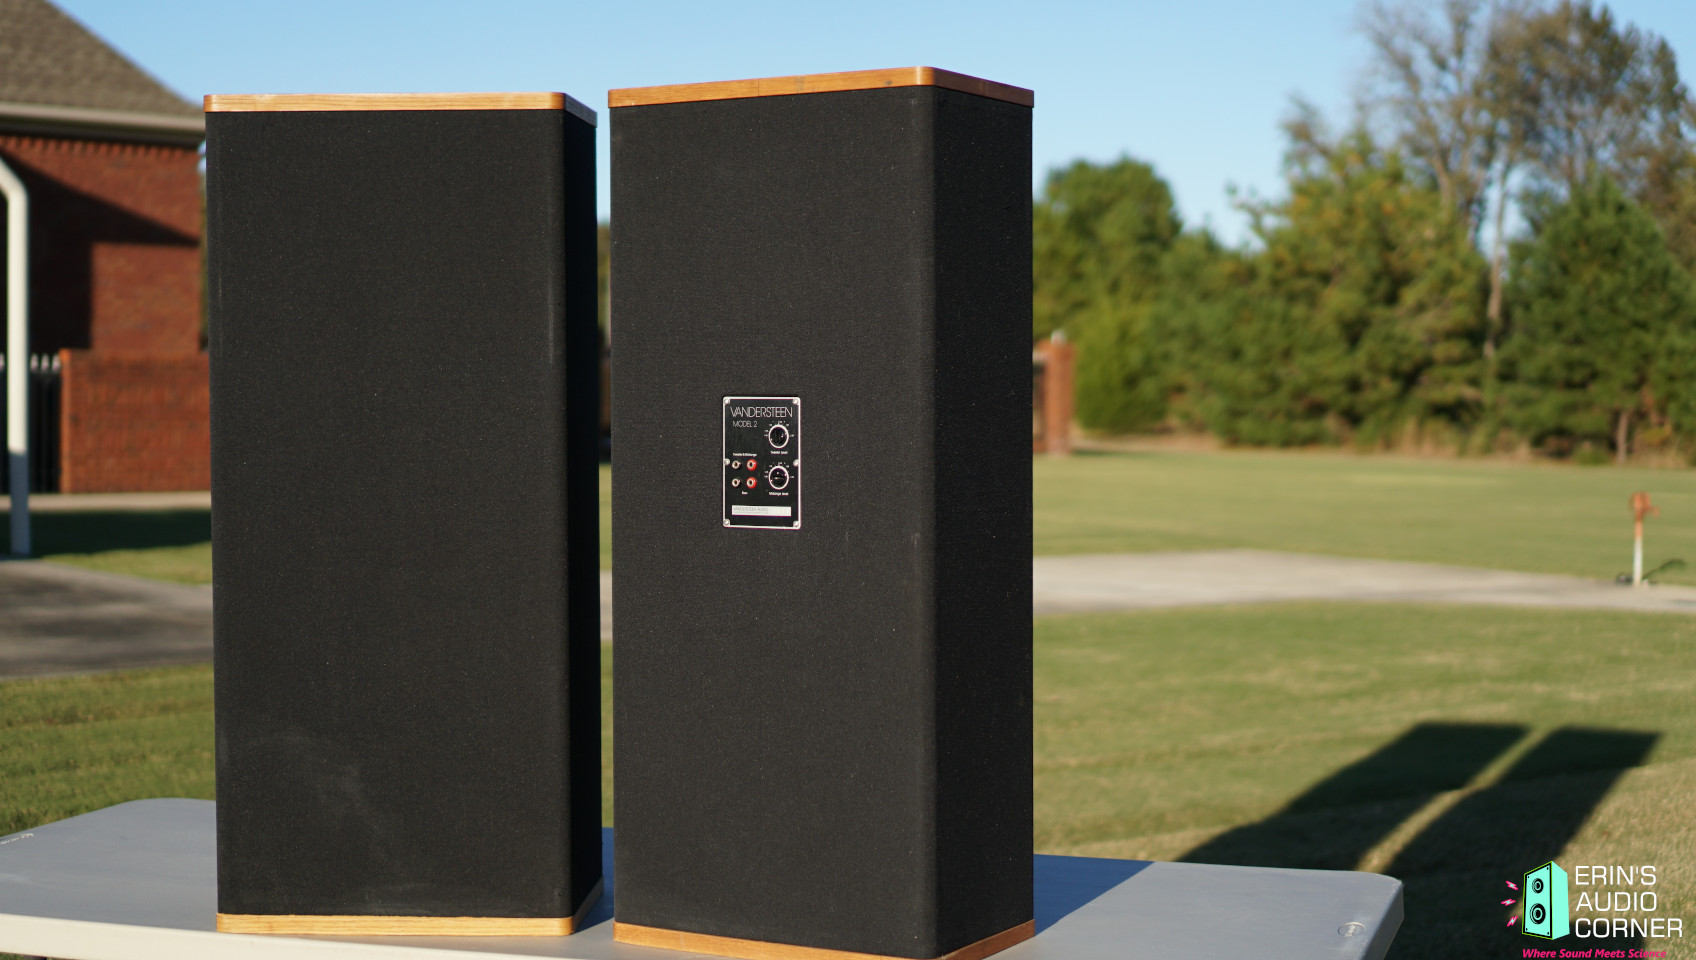
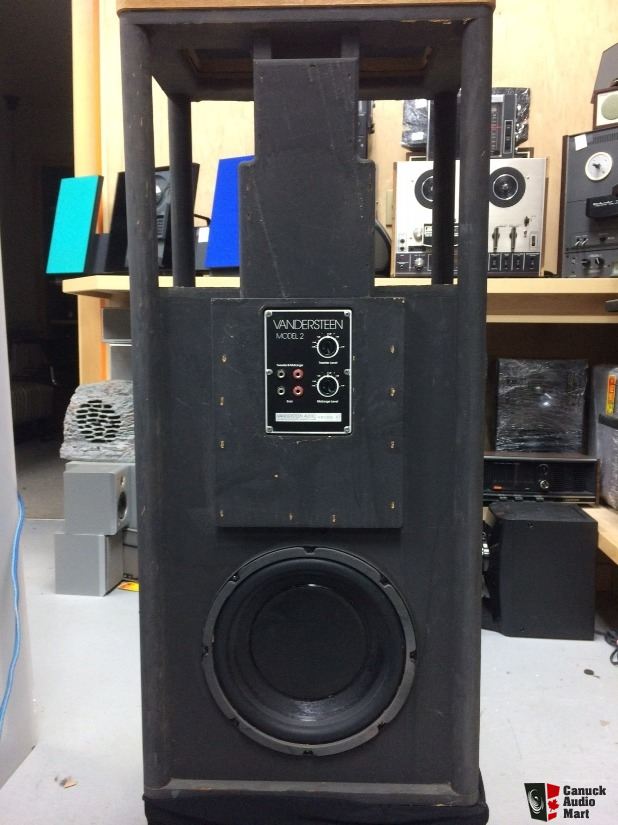
These speakers were loaned to me by their owner. This specific model - the Model 2c - was produced from 1980-1989 according to the manufacturer. They are certainly used but appear to be in good working condition and the data I am providing here does follow design characteristics of data published for other Vandersteen “2” Models. There are no signs of abuse. Through the grille cloth I can see the drivers and there are no signs of surround rot or exposure to the elements. Rather, what I see is just expected wear from a speaker that is over 30 years old at this point. Therefore, I feel confident that the speaker is a properly functioning sample.
The review on this website is a brief overview and summary of the objective performance of this speaker. It is not intended to be a deep dive. Moreso, this is information for those who prefer “just the facts” and prefer to have the data without the filler. The video below has more discussion.
< coming soon >
Information and Photos
Given the vintage of this speaker, it’s pretty hard to nail down the history without simply referencing what others have written. I honestly don’t even know what the difference between the Model 2 and the Model 2c and other “2” models is. With that said, below is a quote from Wayne Garcia’s article about the Model 2 in The Absolute Sound published in December 2018 (link):
Although Richard Vandersteen has gone on to design far more sophisticated, expensive, and ultimately “better”-sounding loudspeakers, the original Model 2 remains the inspiration and essential research project for all that’s followed over the past four-plus decades. Upon release in 1977 the Model 2 sold for $890 the pair and featured several innovative design elements that are fundamental to every subsequent speaker that Richard Vandersteen designed. First and most obviously was Vandersteen’s discovery that by minimizing the size and curving the edges of the baffle, he was able to virtually eliminate cabinet edge and grille diffraction issues to obtain a far more accurate sound from his drivers than he could when they were mounted in a conventional enclosure (this technology reached its summit with Vandersteen’s trademarked Stealth Enclosure). And as an early audio industry adapter of the Gen-Rad 2512 FFT (Fast Fourier Transform) Computer Analyzer initially developed for the aerospace industry, Vandersteen was able to time-align his drivers accurately, which went hand-in-glove with another Vandersteen hallmark, the use of first-order crossovers to preserve the phase integrity of incoming signals. Though naturally it’s evolved through eight generations, the Model 2 has always employed a quartet of drivers: A 10” active acoustic coupler acts as a subwoofer from 26Hz–35Hz; an 8” woofer handles duties from 35Hz–600Hz; a 4.5” midrange driver covers a very wide range of frequencies from 600Hz–5kHz (meaning there is no crossover point throughout this most critical of regions, which has always made the 2 an unusually coherent loudspeaker); and a 1” dome tweeter spans the 5kHz–30kHz range. Except for the woofer enclosure, there is essentially no cabinetry to the Model 2, whose “enclosure” consists of rectangular top and bottom endcaps joined by long “poles” at each corner. Because the speaker’s profile is a somewhat bulky, fabric-wrapped rectangle, the Model 2 has never been the handsomest boy in class, but the speaker’s exceptional performance and remarkable value have nevertheless managed to win over plenty of hearts. In fact, the Model 2 is the best-selling audiophile loudspeaker of the modern era, with more than 100,000 pairs sold—all of them made in the U.S. That the Model 2 is still enjoying robust sales more than 40 years after its introduction is a testament to the speaker’s fundamental rightness of design and sound quality. The Model 2 is one of the defining classics of American high-end audio.
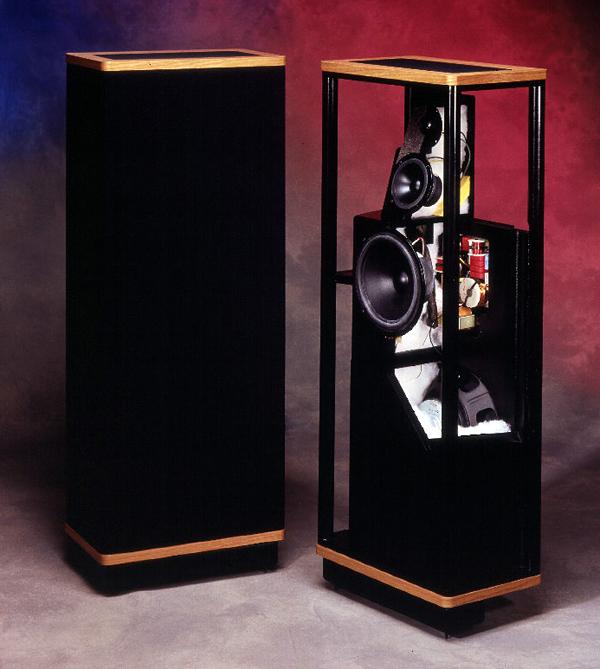
This photo is borrowed from the above article. It shows a cutaway of the Model 2 so you can get a feel for the inside. Note the tweeter at the top, midrange and then midbass. Also note at the bottom back, you can see the basket of the “10” active acoustic coupler".
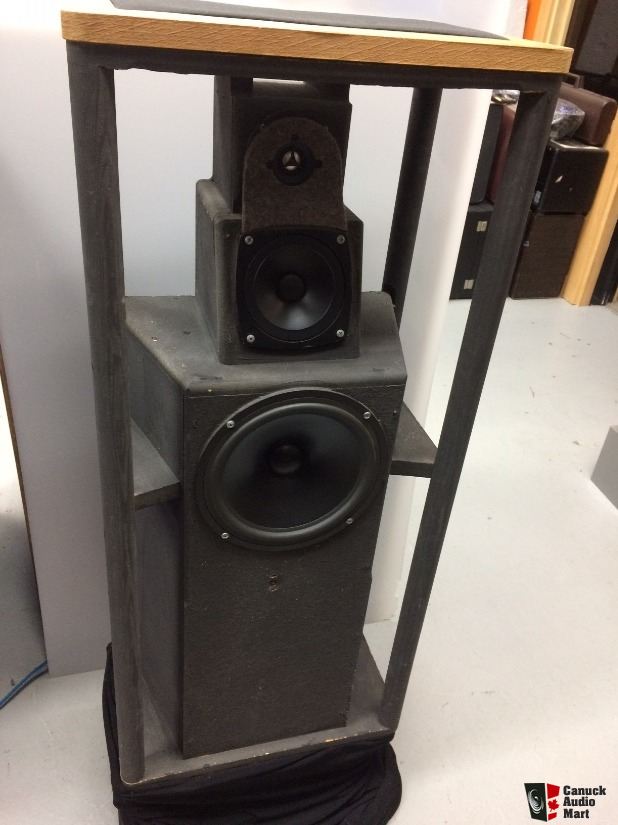
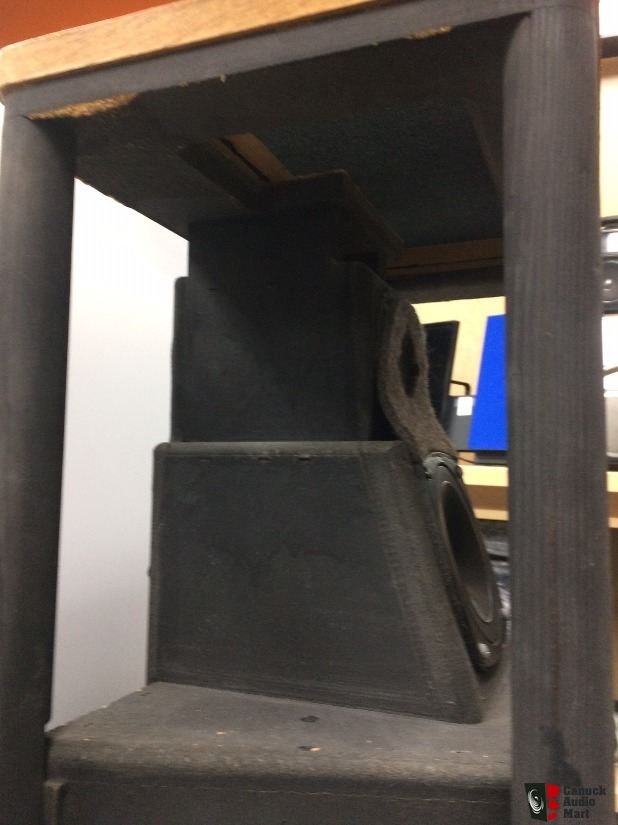
The following photos were found via google from a seller on usaudiomart.com. These are the only pictures I could find that show the inside of the speaker in such great detail. Thanks to the owner for sharing these!
The front showing the midbass/midrange/tweeter:
Side shot showing the stepped nature of the tweeter with respect to the midrange:
10" “subwoofer” on the rear:
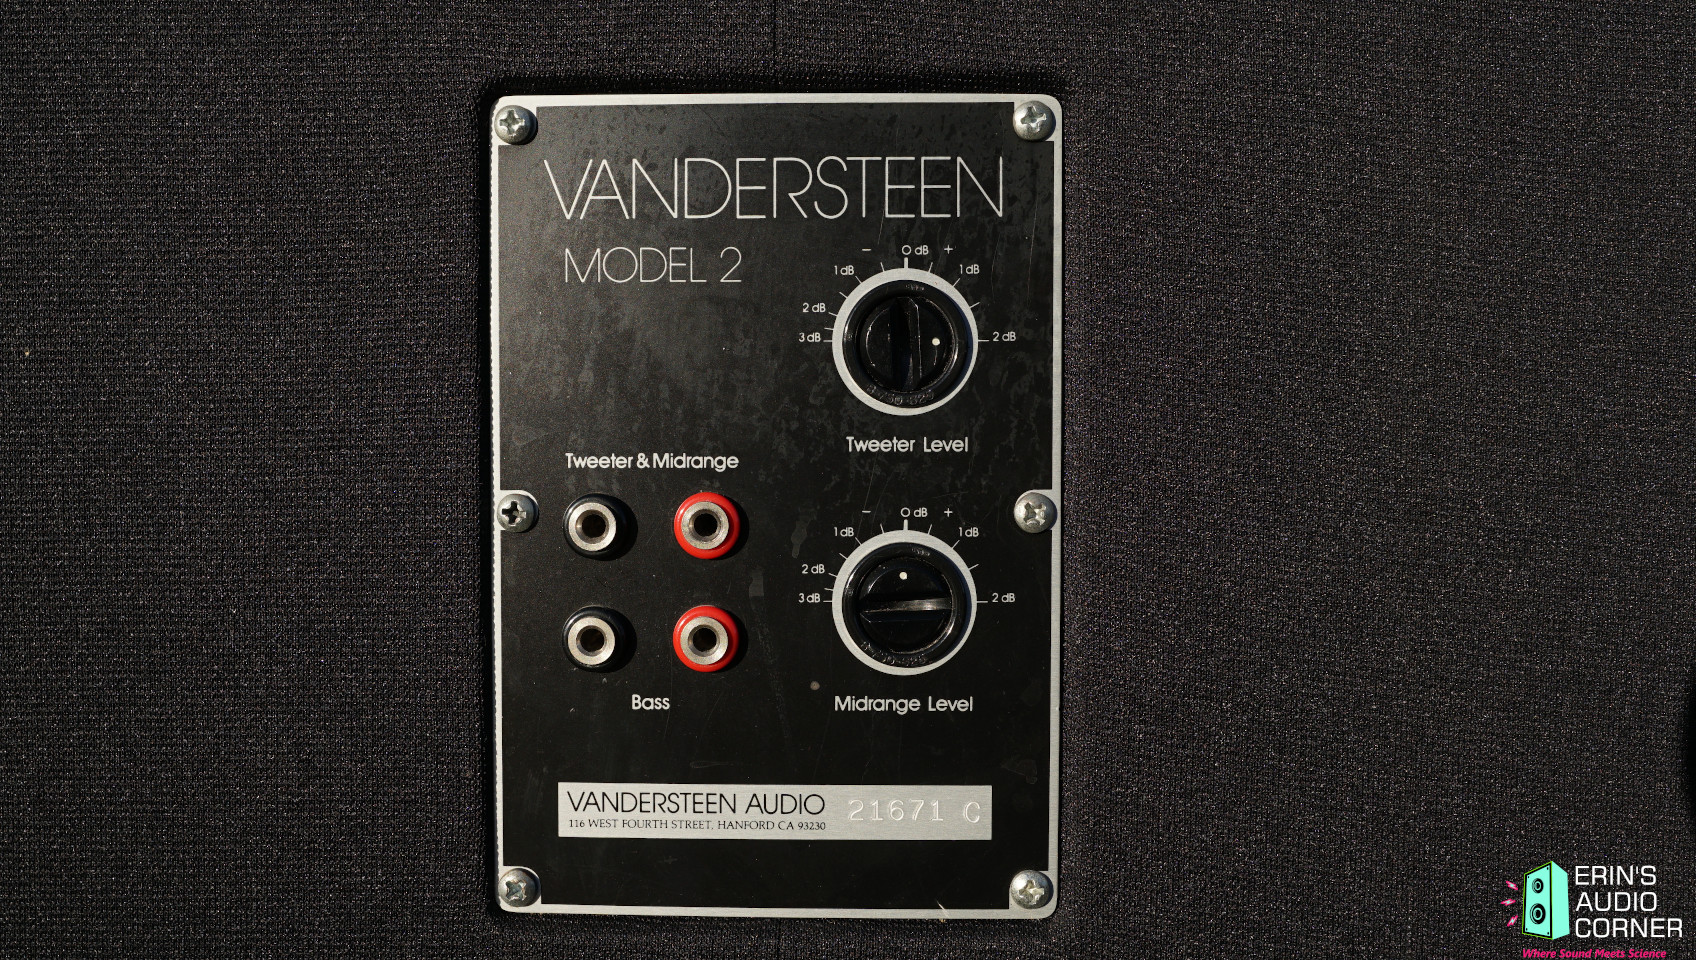
Adjustment knobs (note: for testing these were set to 0):
CTA-2034 (SPINORAMA) and Accompanying Data
All data collected using Klippel’s Near-Field Scanner. The Near-Field-Scanner 3D (NFS) offers a fully automated acoustic measurement of direct sound radiated from the source under test. The radiated sound is determined in any desired distance and angle in the 3D space outside the scanning surface. Directivity, sound power, SPL response and many more key figures are obtained for any kind of loudspeaker and audio system in near field applications (e.g. studio monitors, mobile devices) as well as far field applications (e.g. professional audio systems). Utilizing a minimum of measurement points, a comprehensive data set is generated containing the loudspeaker’s high resolution, free field sound radiation in the near and far field. For a detailed explanation of how the NFS works and the science behind it, please watch the below discussion with designer Christian Bellmann:
The reference plane in this test is at the tweeter. The speaker has midrange and treble adjustments but for these measurements they were all set to “0”.
Measurements are provided in a format in accordance with the Standard Method of Measurement for In-Home Loudspeakers (ANSI/CTA-2034-A R-2020). For more information, please see this link.
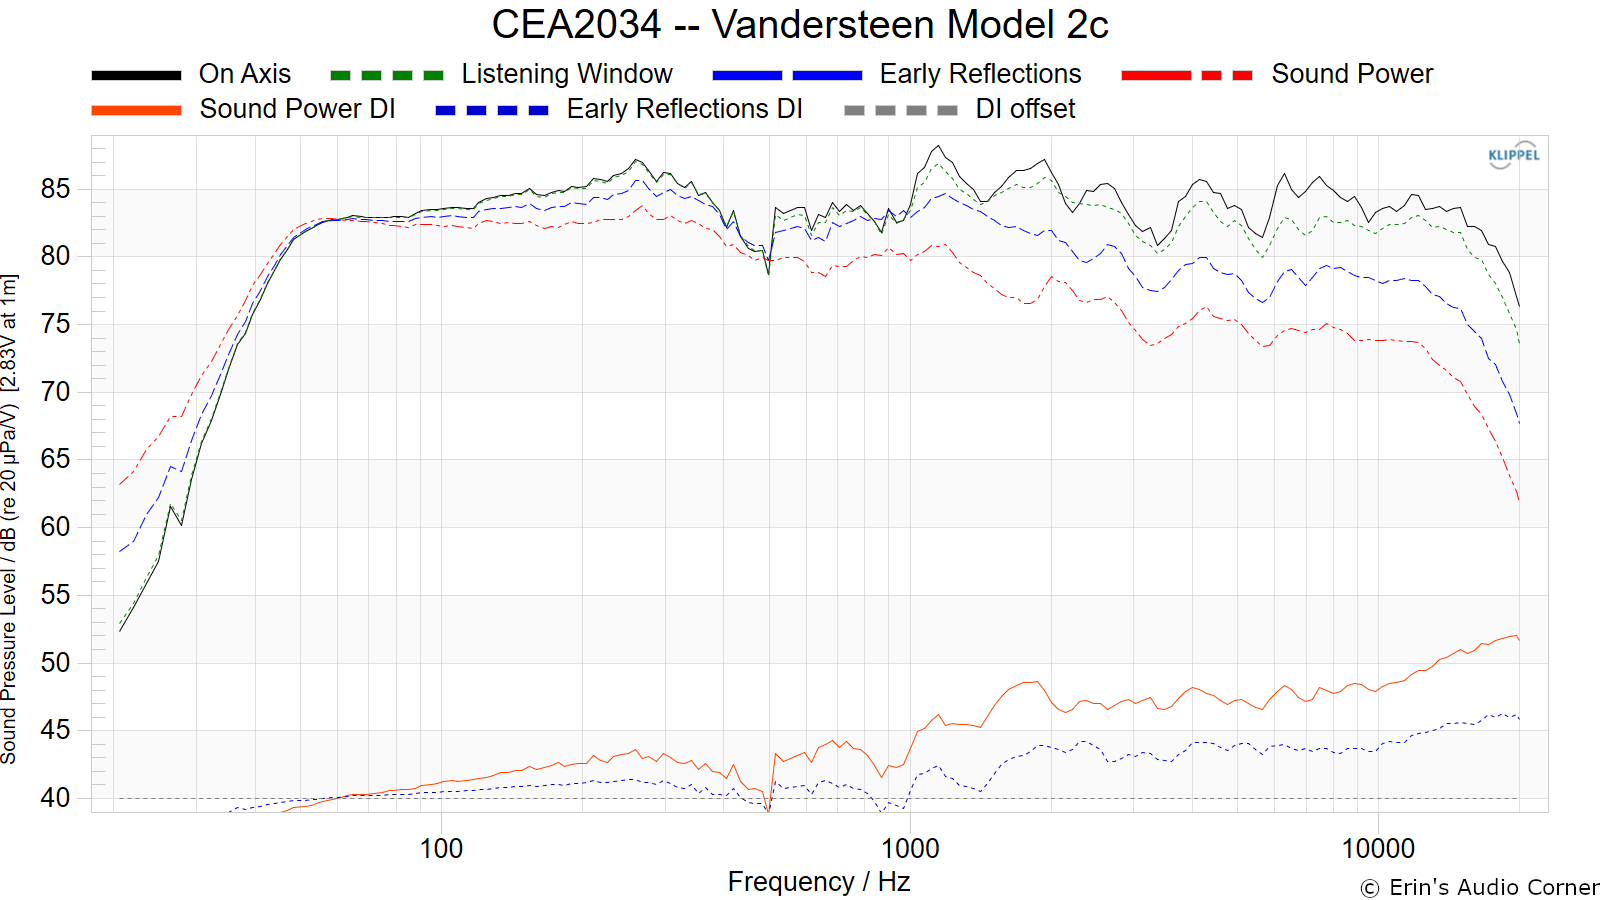
CTA-2034 / SPINORAMA:
The On-axis Frequency Response (0°) is the universal starting point and in many situations it is a fair representation of the first sound to arrive at a listener’s ears.
The Listening Window is a spatial average of the nine amplitude responses in the ±10º vertical and ±30º horizontal angular range. This encompasses those listeners who sit within a typical home theater audience, as well as those who disregard the normal rules when listening alone.
The Early Reflections curve is an estimate of all single-bounce, first-reflections, in a typical listening room.
Sound Power represents all of the sounds arriving at the listening position after any number of reflections from any direction. It is the weighted rms average of all 70 measurements, with individual measurements weighted according to the portion of the spherical surface that they represent.
Sound Power Directivity Index (SPDI): In this standard the SPDI is defined as the difference between the listening window curve and the sound power curve.
Early Reflections Directivity Index (EPDI): is defined as the difference between the listening window curve and the early reflections curve. In small rooms, early reflections figure prominently in what is measured and heard in the room so this curve may provide insights into potential sound quality.
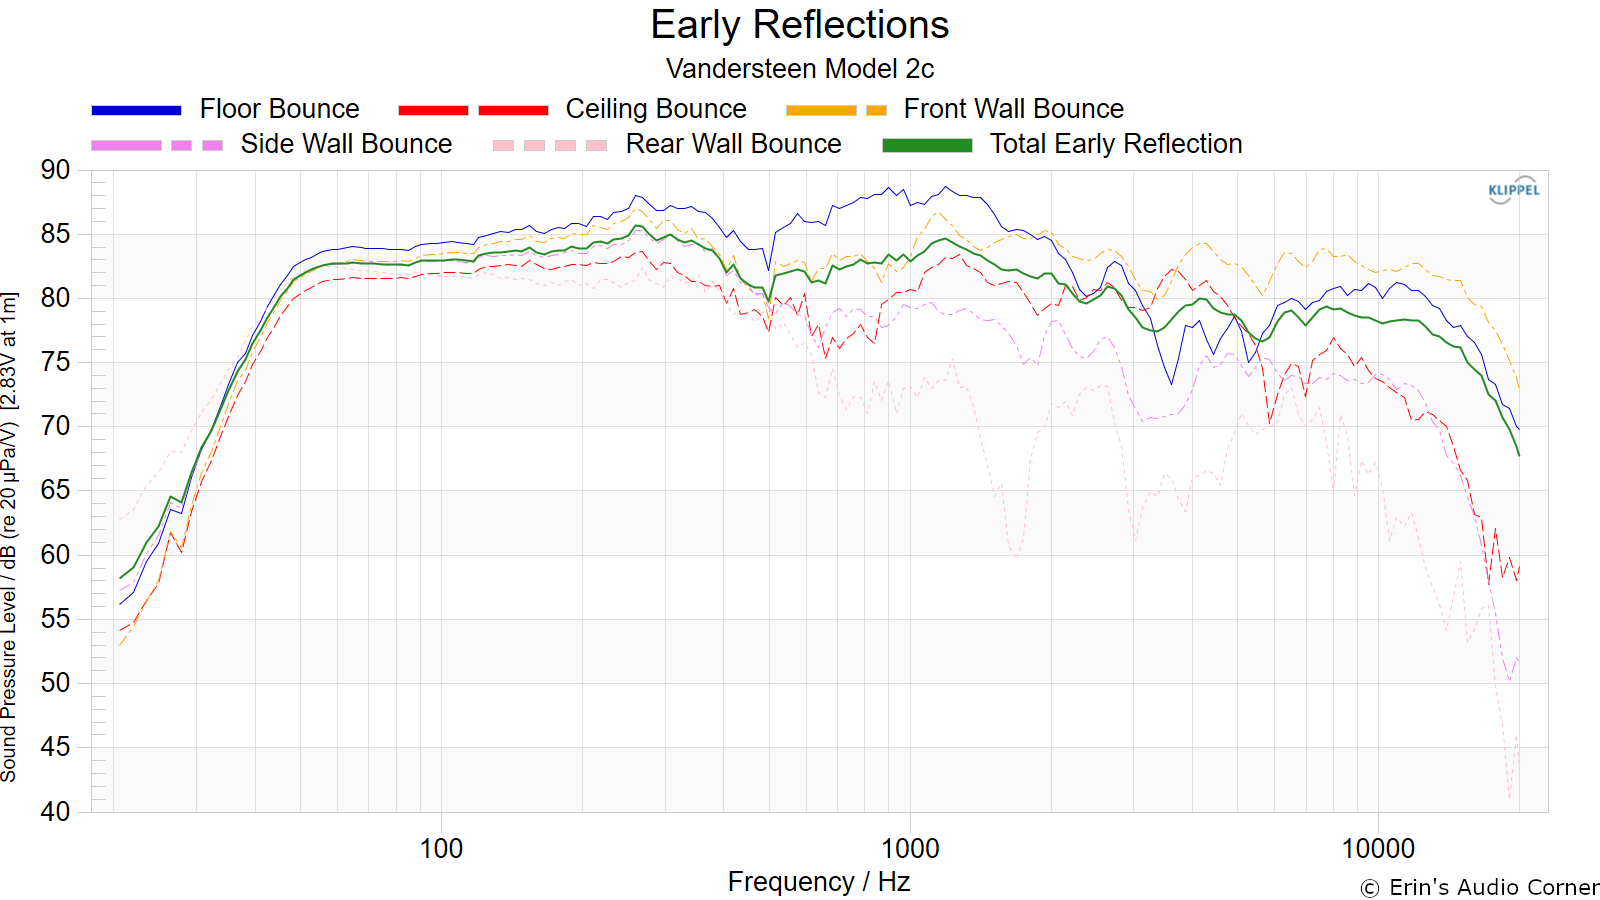
Early Reflections Breakout:
Floor bounce: average of 20º, 30º, 40º down
Ceiling bounce: average of 40º, 50º, 60º up
Front wall bounce: average of 0º, ± 10º, ± 20º, ± 30º horizontal
Side wall bounces: average of ± 40º, ± 50º, ± 60º, ± 70º, ± 80º horizontal
Rear wall bounces: average of 180º, ± 90º horizontal
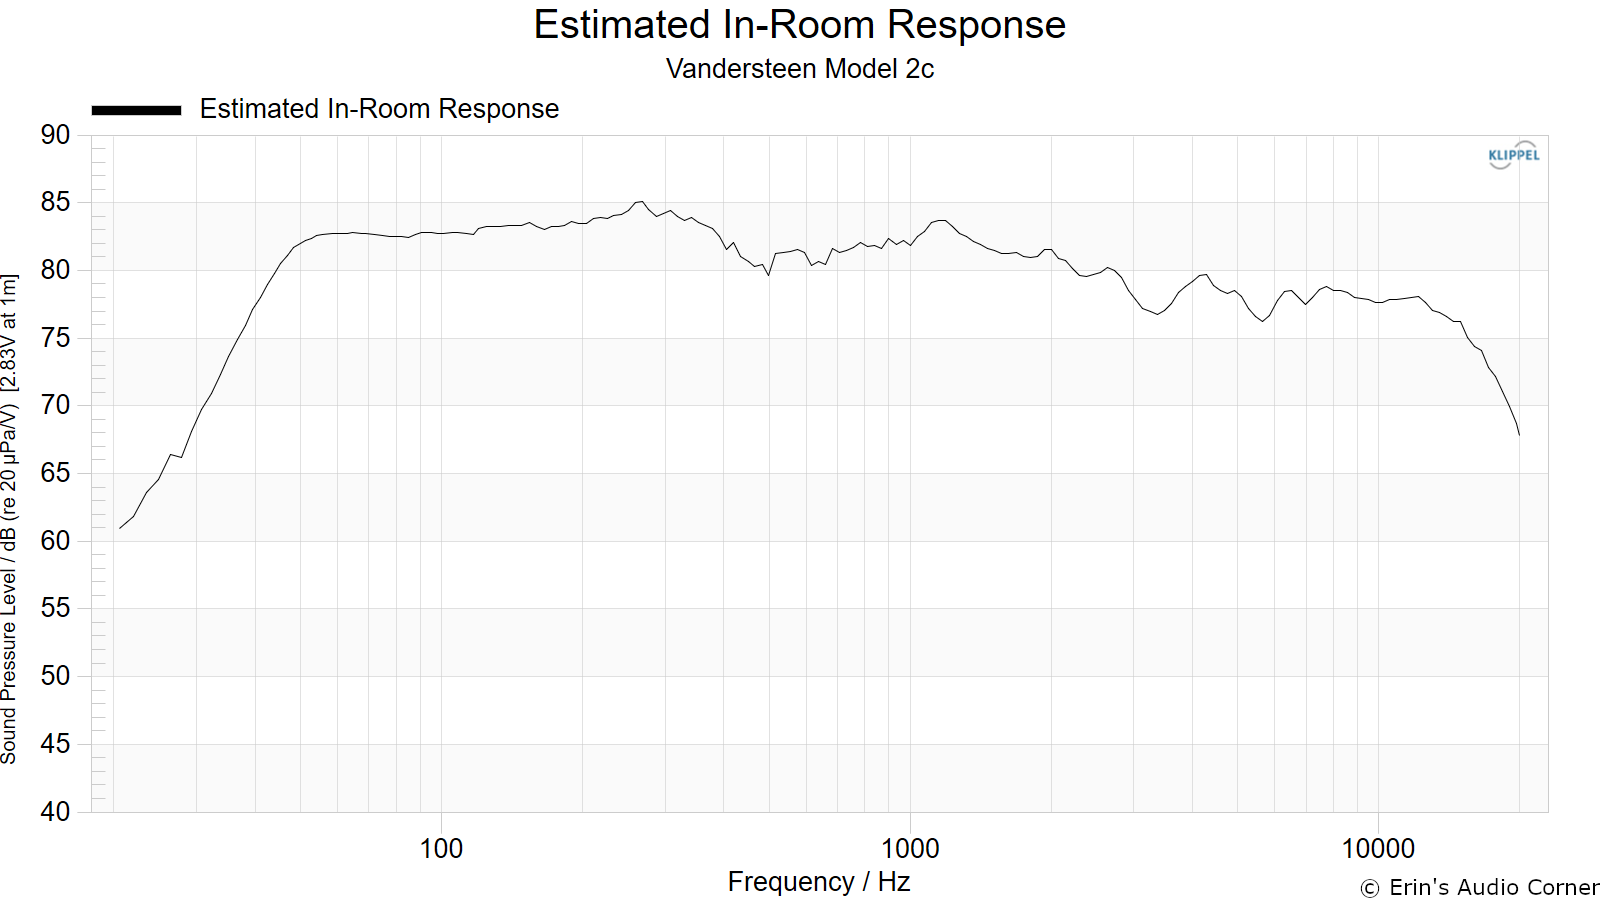
Estimated In-Room Response:
In theory, with complete 360-degree anechoic data on a loudspeaker and sufficient acoustical and geometrical data on the listening room and its layout it would be possible to estimate with good precision what would be measured by an omnidirectional microphone located in the listening area of that room. By making some simplifying assumptions about the listening space, the data set described above permits a usefully accurate preview of how a given loudspeaker might perform in a typical domestic listening room. Obviously, there are no guarantees, because individual rooms can be acoustically aberrant. Sometimes rooms are excessively reflective (“live”) as happens in certain hot, humid climates, with certain styles of interior décor and in under-furnished rooms. Sometimes rooms are excessively “dead” as in other styles of décor and in some custom home theaters where acoustical treatment has been used excessively. This form of post processing is offered only as an estimate of what might happen in a domestic living space with carpet on the floor and a “normal” amount of seating, drapes and cabinetry.
For these limited circumstances it has been found that a usefully accurate Predicted In-Room (PIR) amplitude response, also known as a “room curve” is obtained by a weighted average consisting of 12 % listening window, 44 % early reflections and 44 % sound power. At very high frequencies errors can creep in because of excessive absorption, microphone directivity, and room geometry. These discrepancies are not considered to be of great importance.
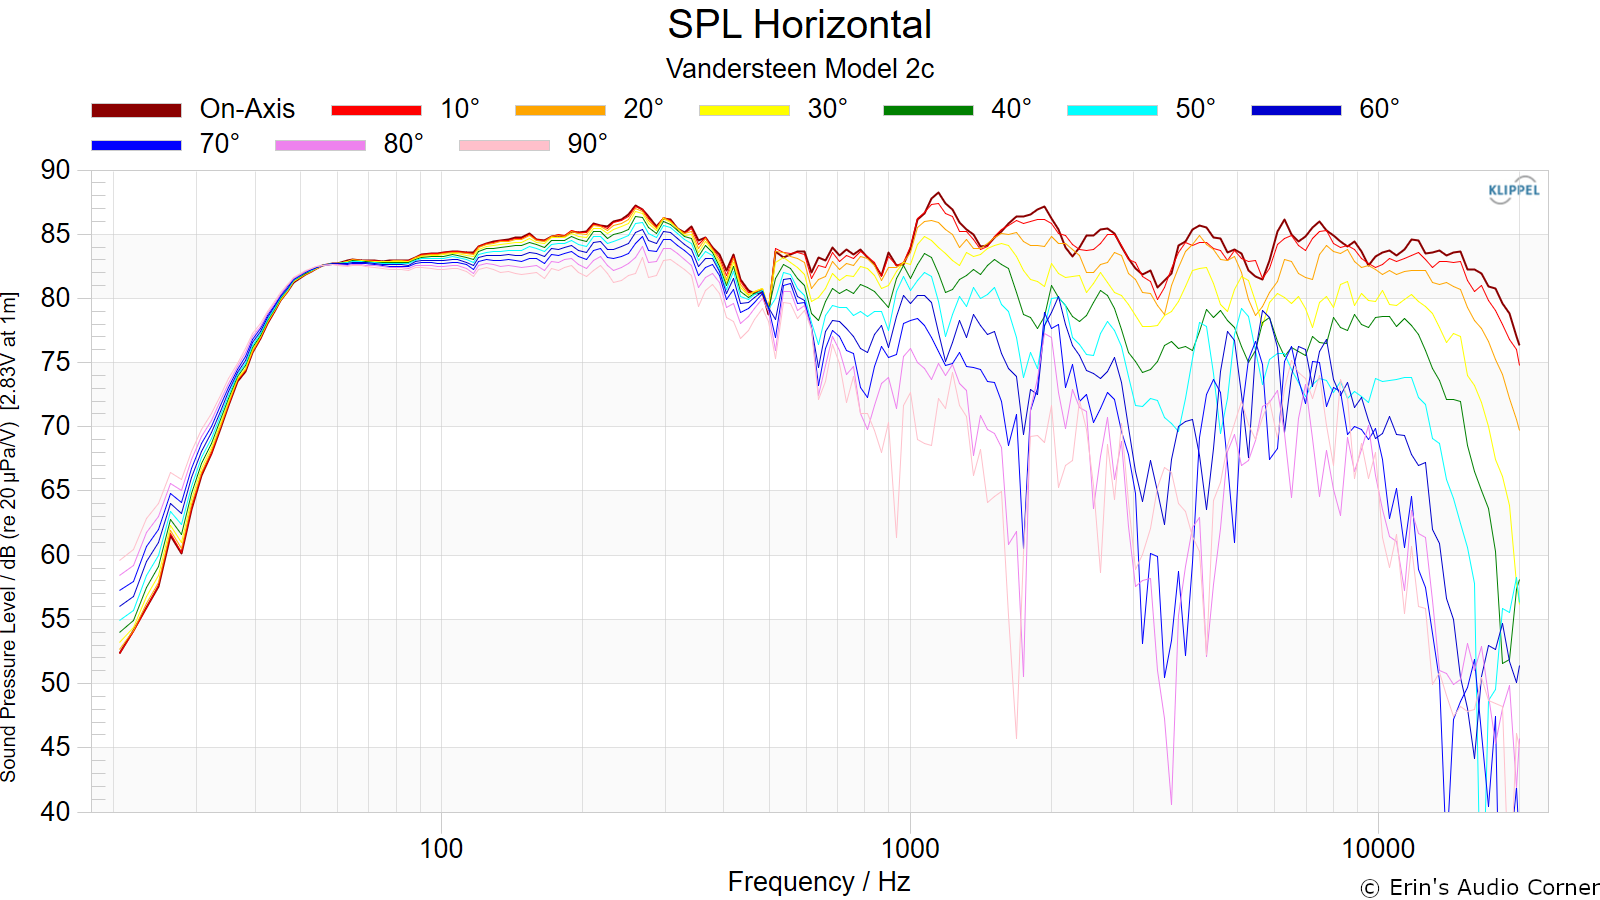
Horizontal Frequency Response (0° to ±90°):
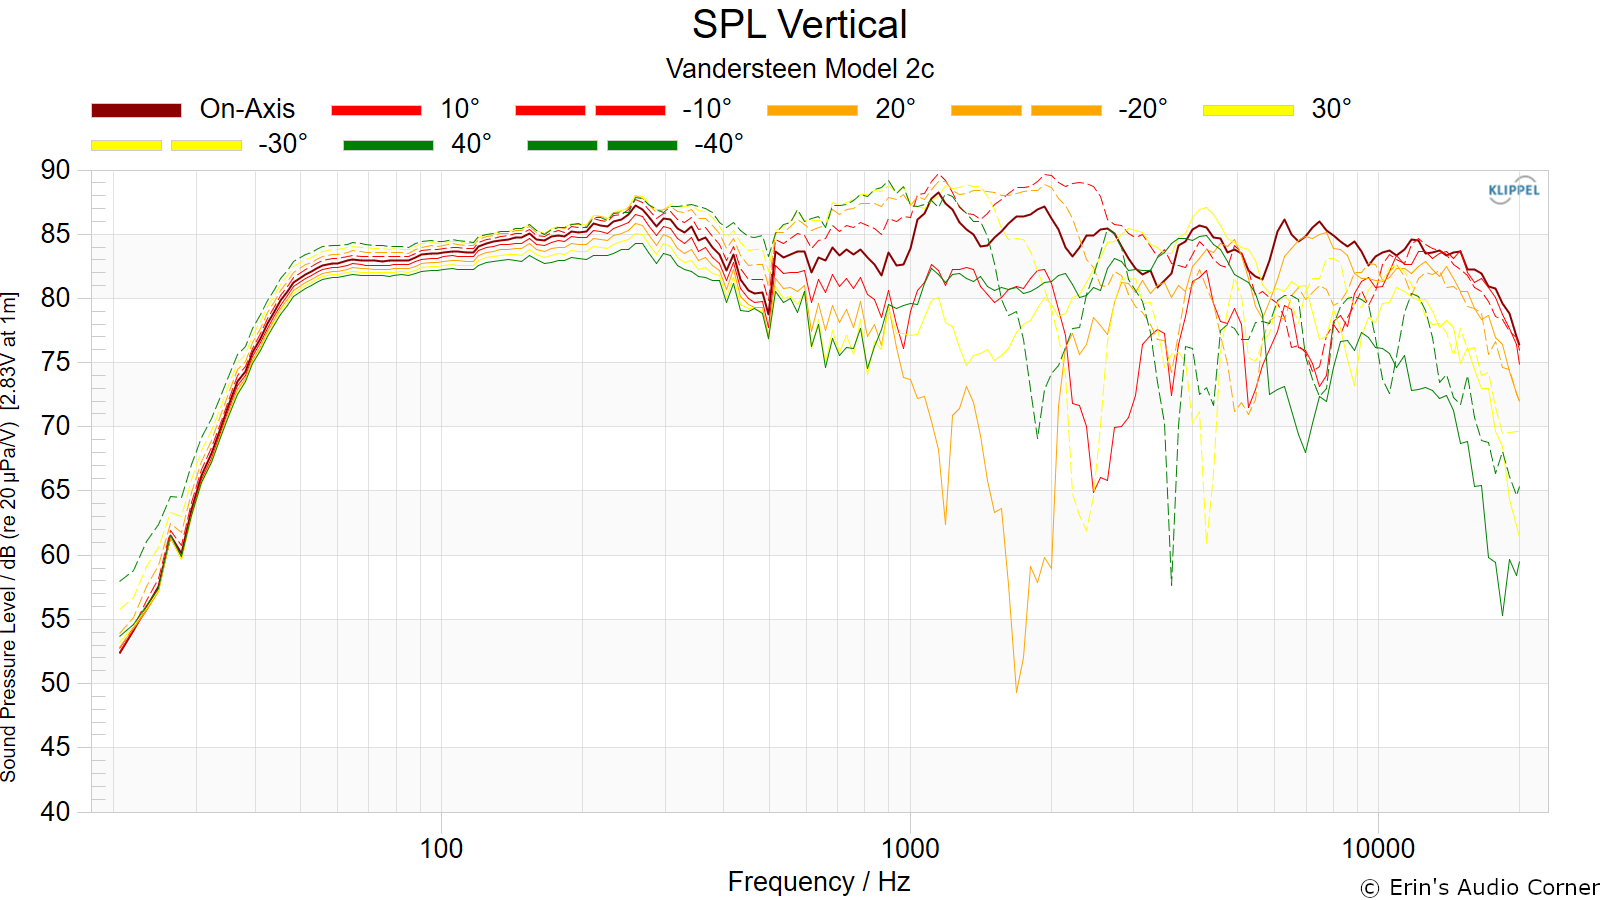
Vertical Frequency Response (0° to ±40°):
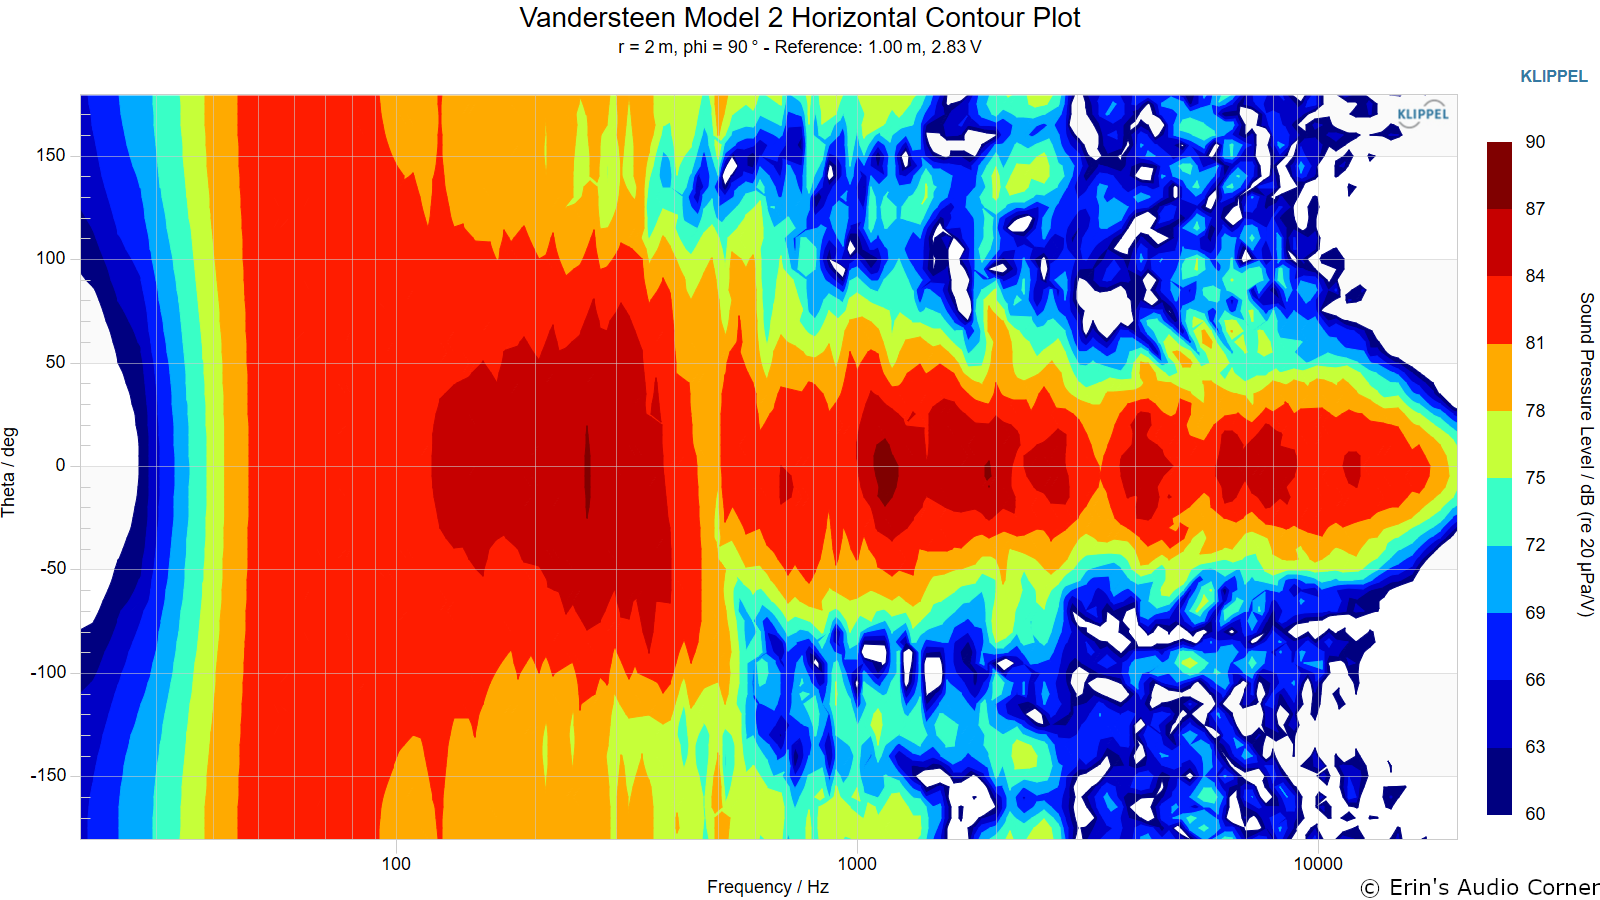
Horizontal Contour Plot (not normalized):
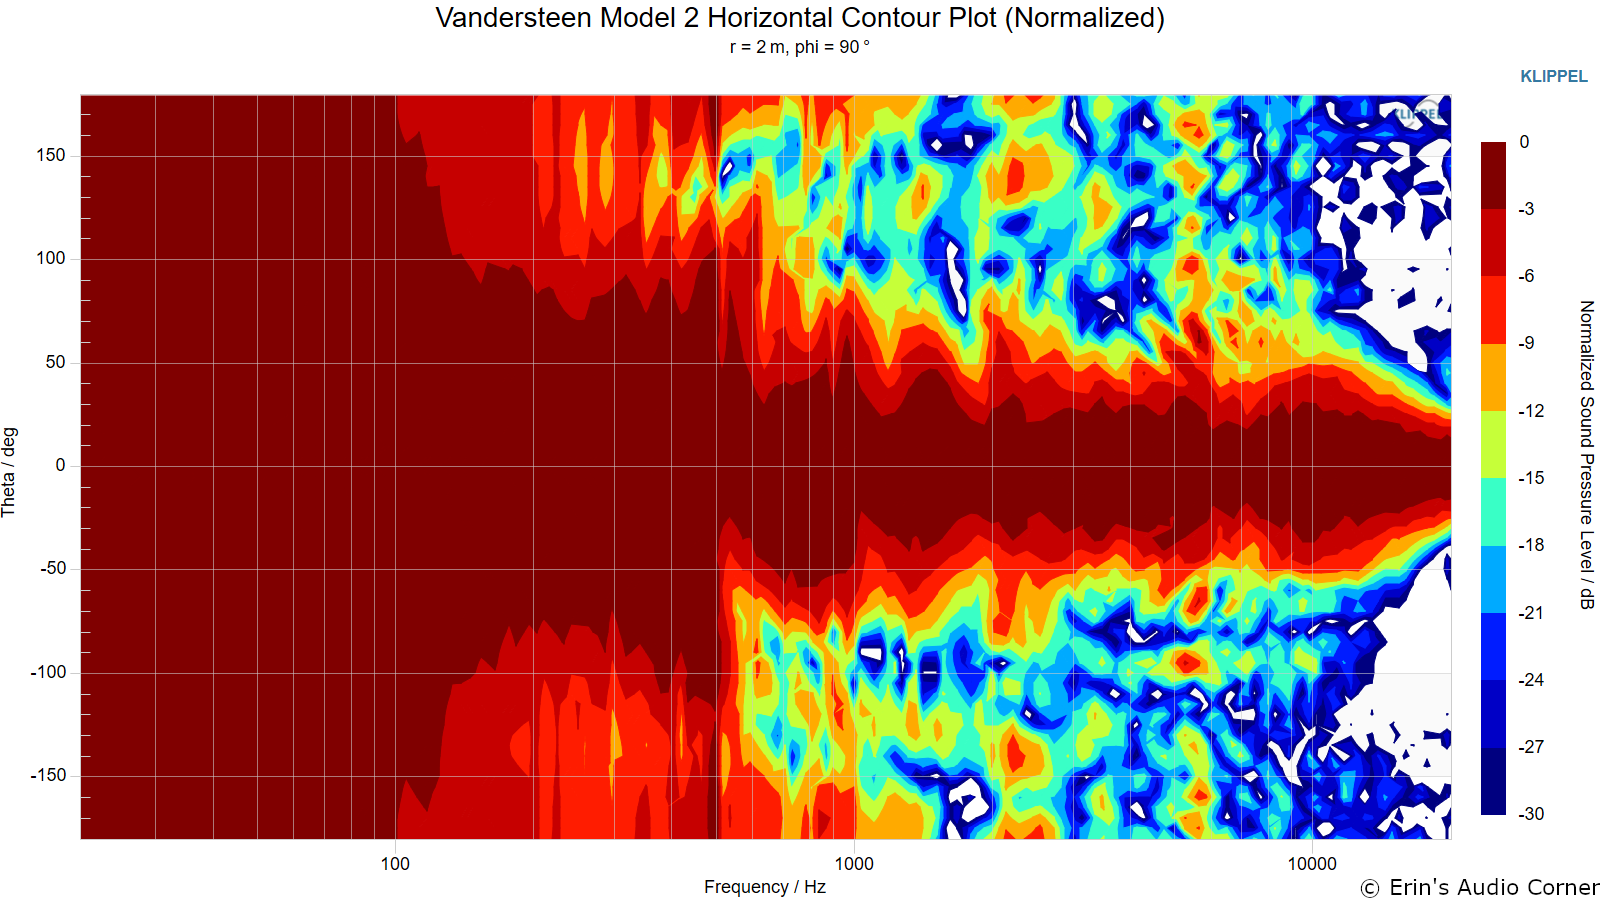
Horizontal Contour Plot (normalized):
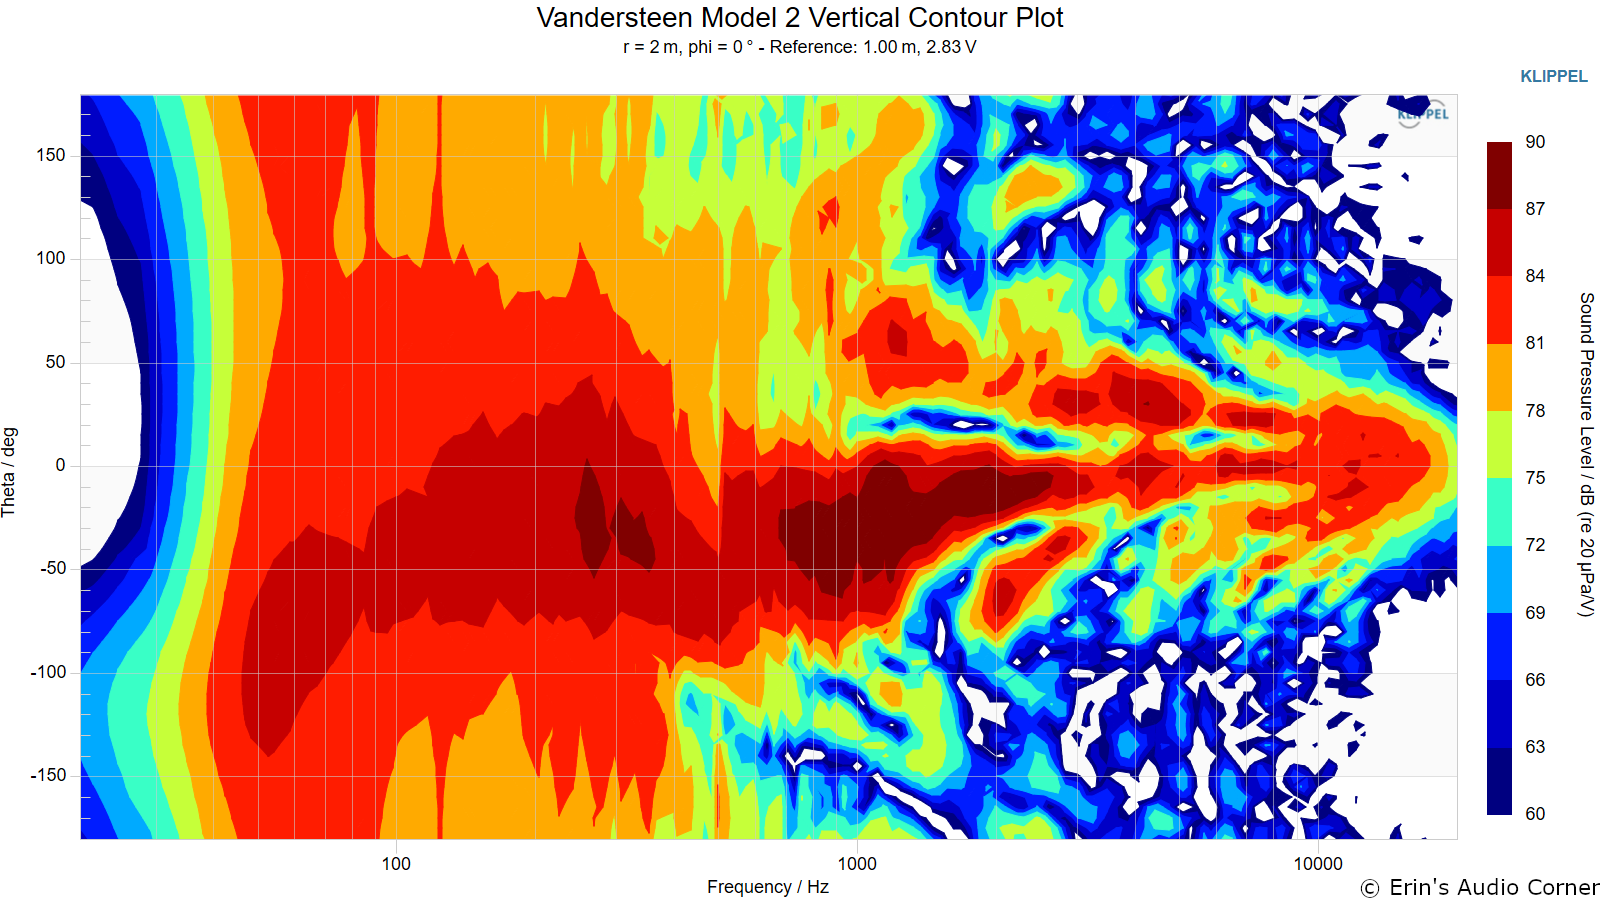
Vertical Contour Plot (not normalized):
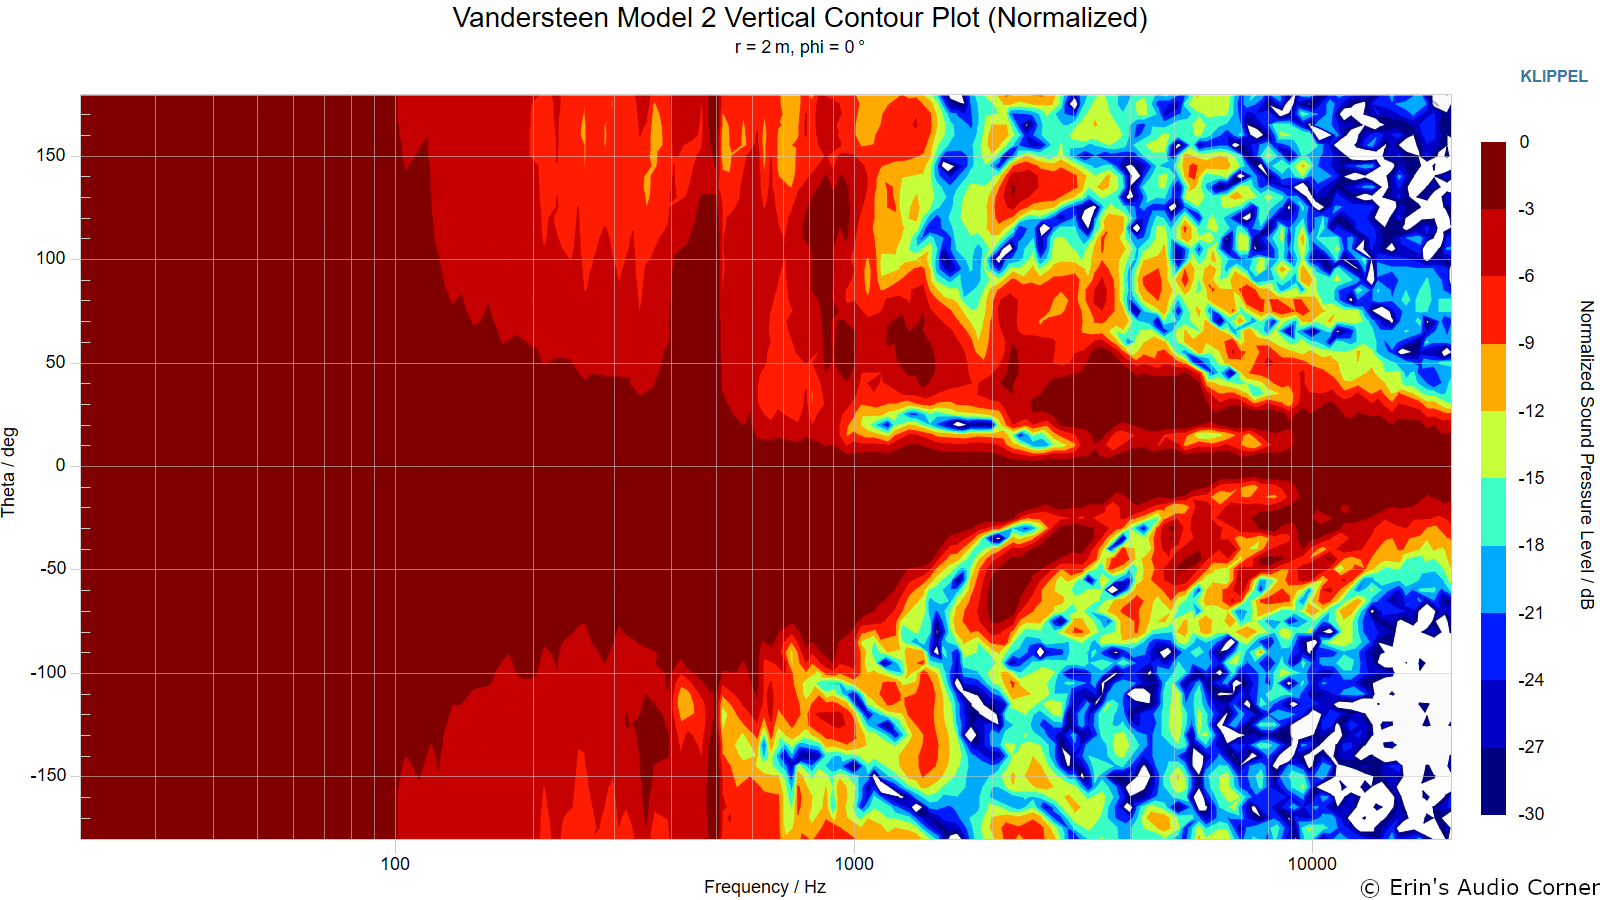
Vertical Contour Plot (normalized):
“Globe” Plots
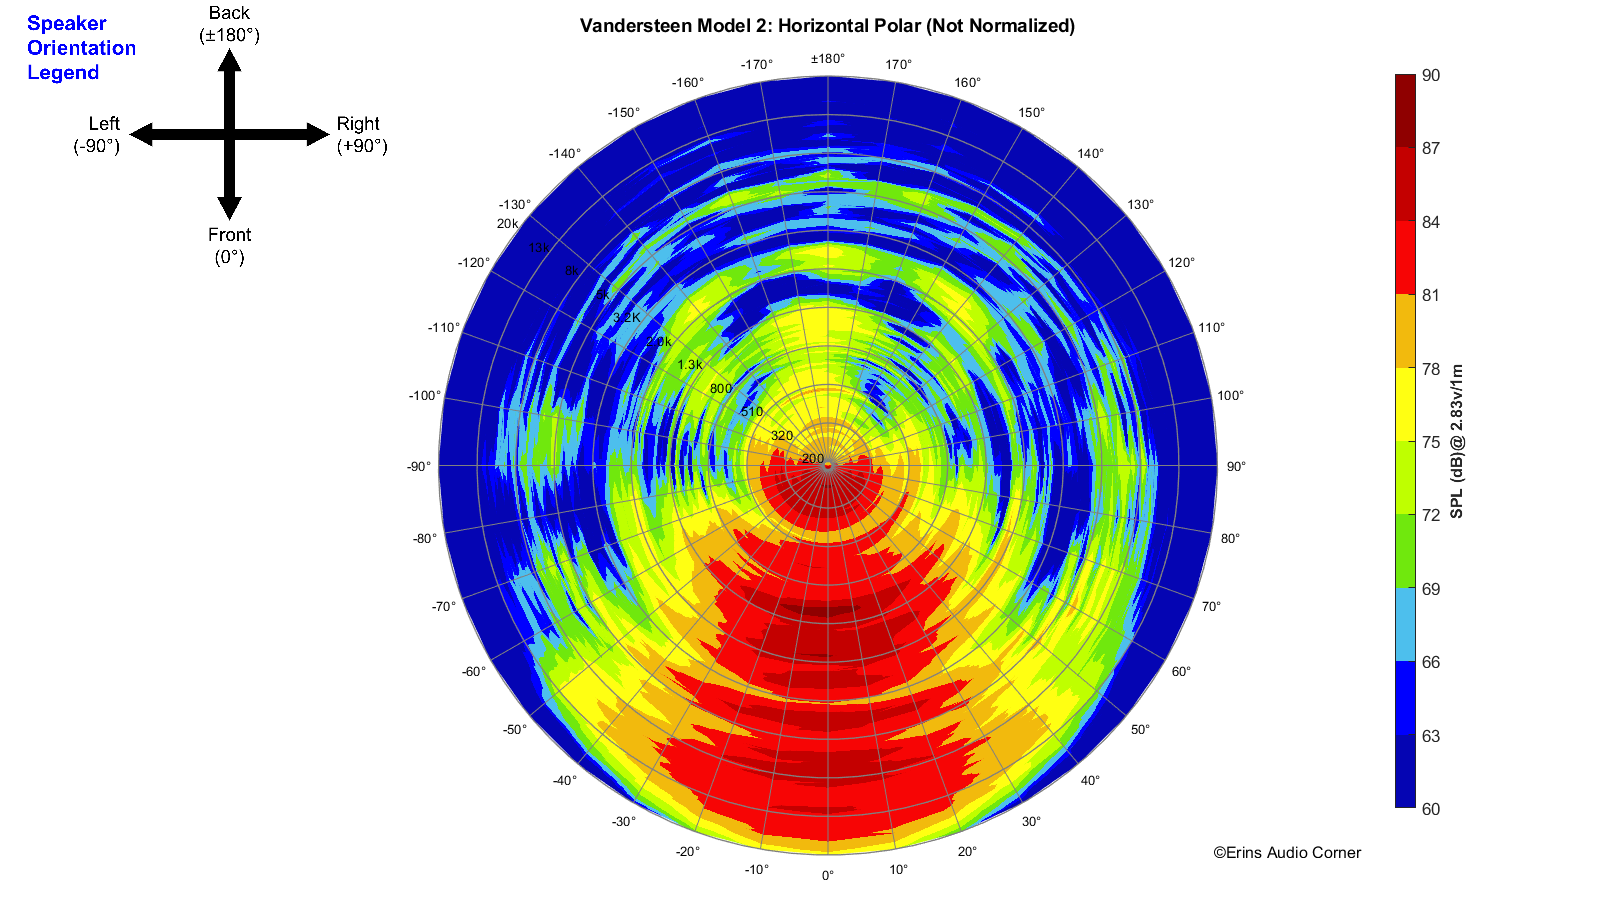
Horizontal Polar (Globe) Plot:
This represents the sound field at 2 meters - above 200Hz - per the legend in the upper left.
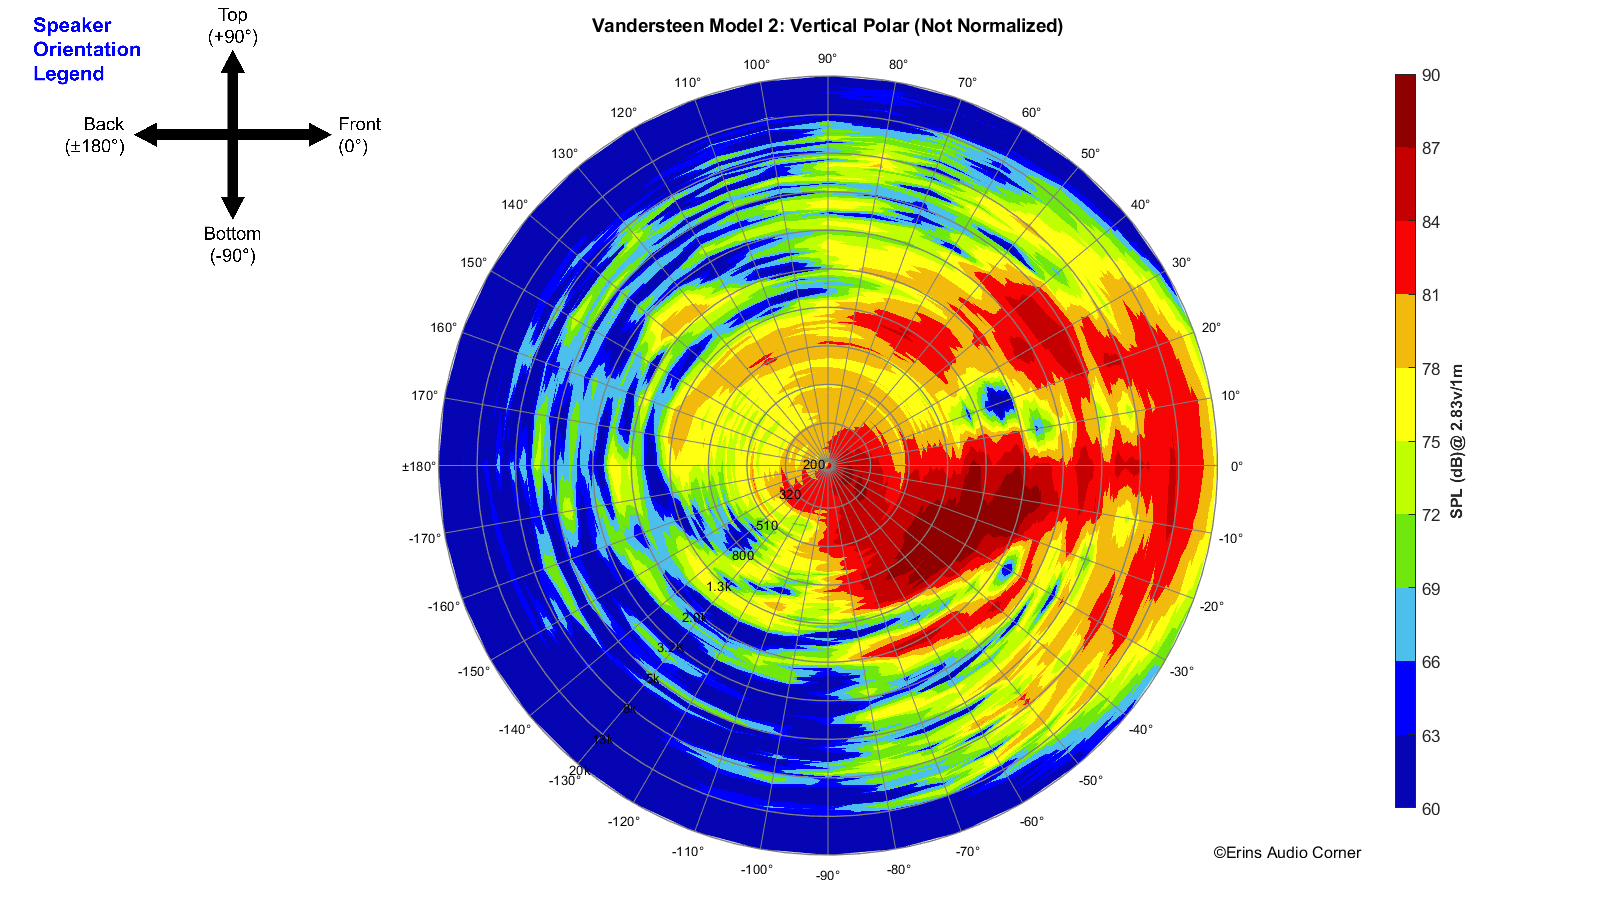
Vertical Polar (Globe) Plot:
This represents the sound field at 2 meters - above 200Hz - per the legend in the upper left.
Additional Measurements
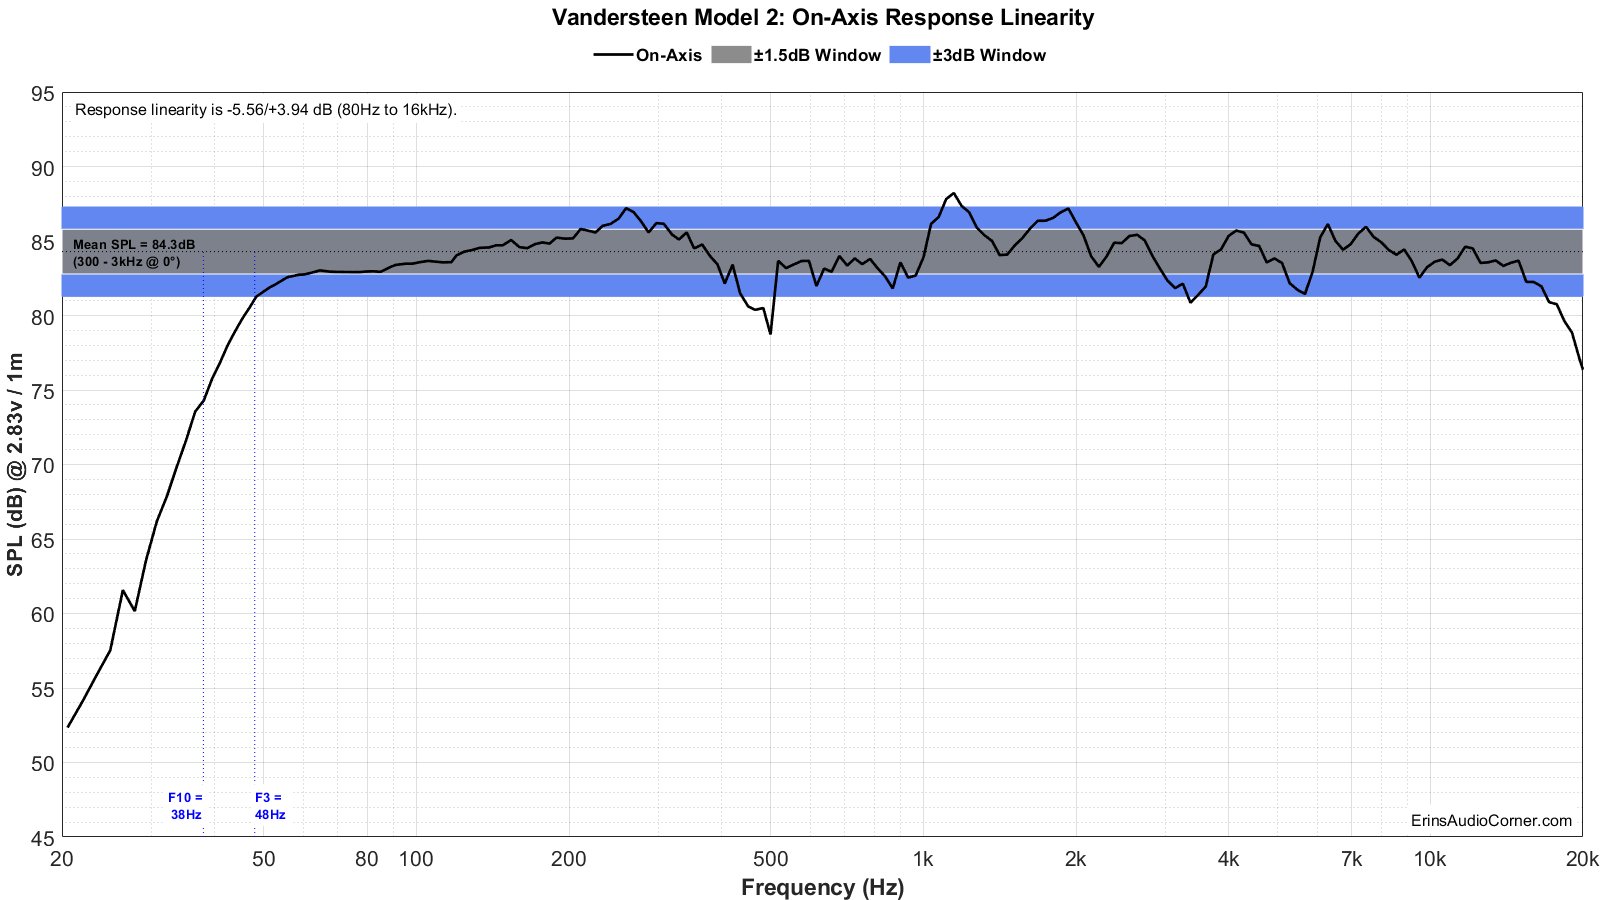
On-Axis Response Linearity
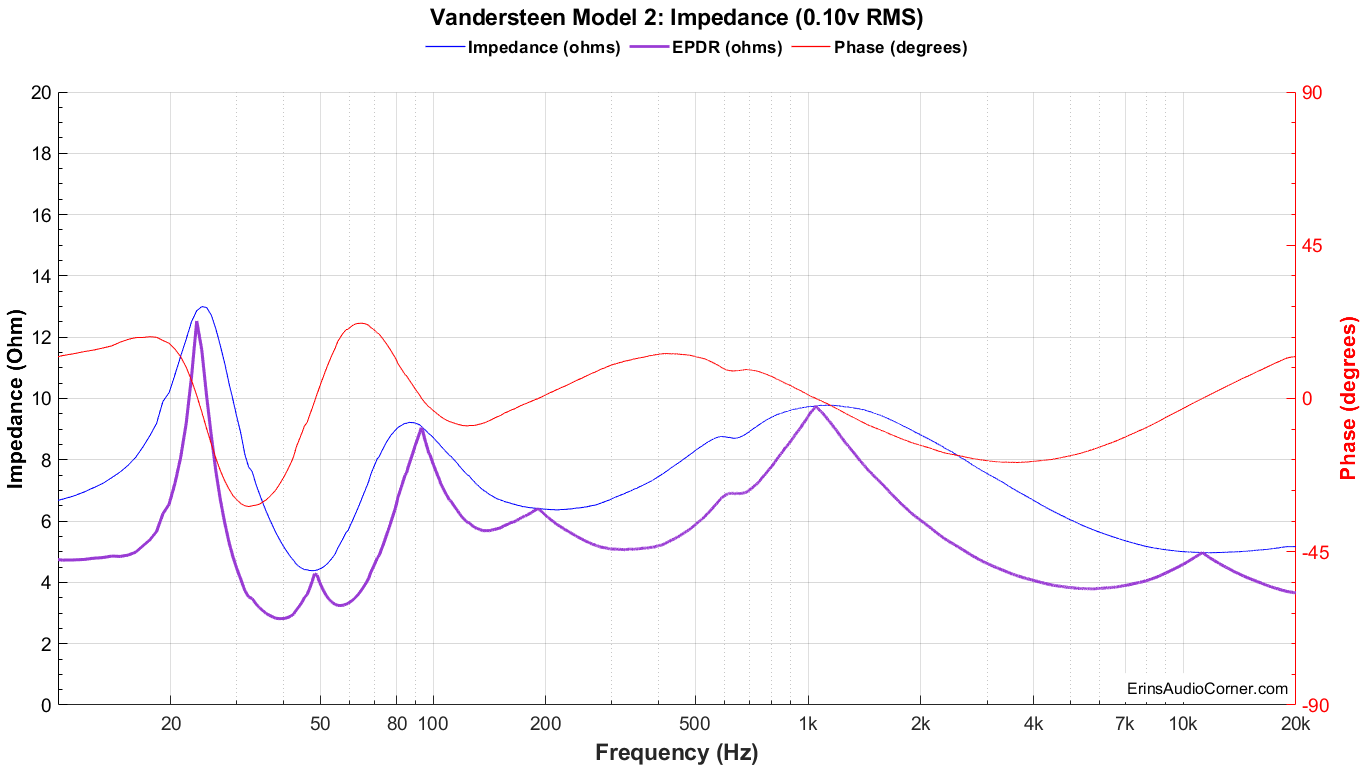
Impedance Magnitude and Phase + Equivalent Peak Dissipation Resistance (EPDR)
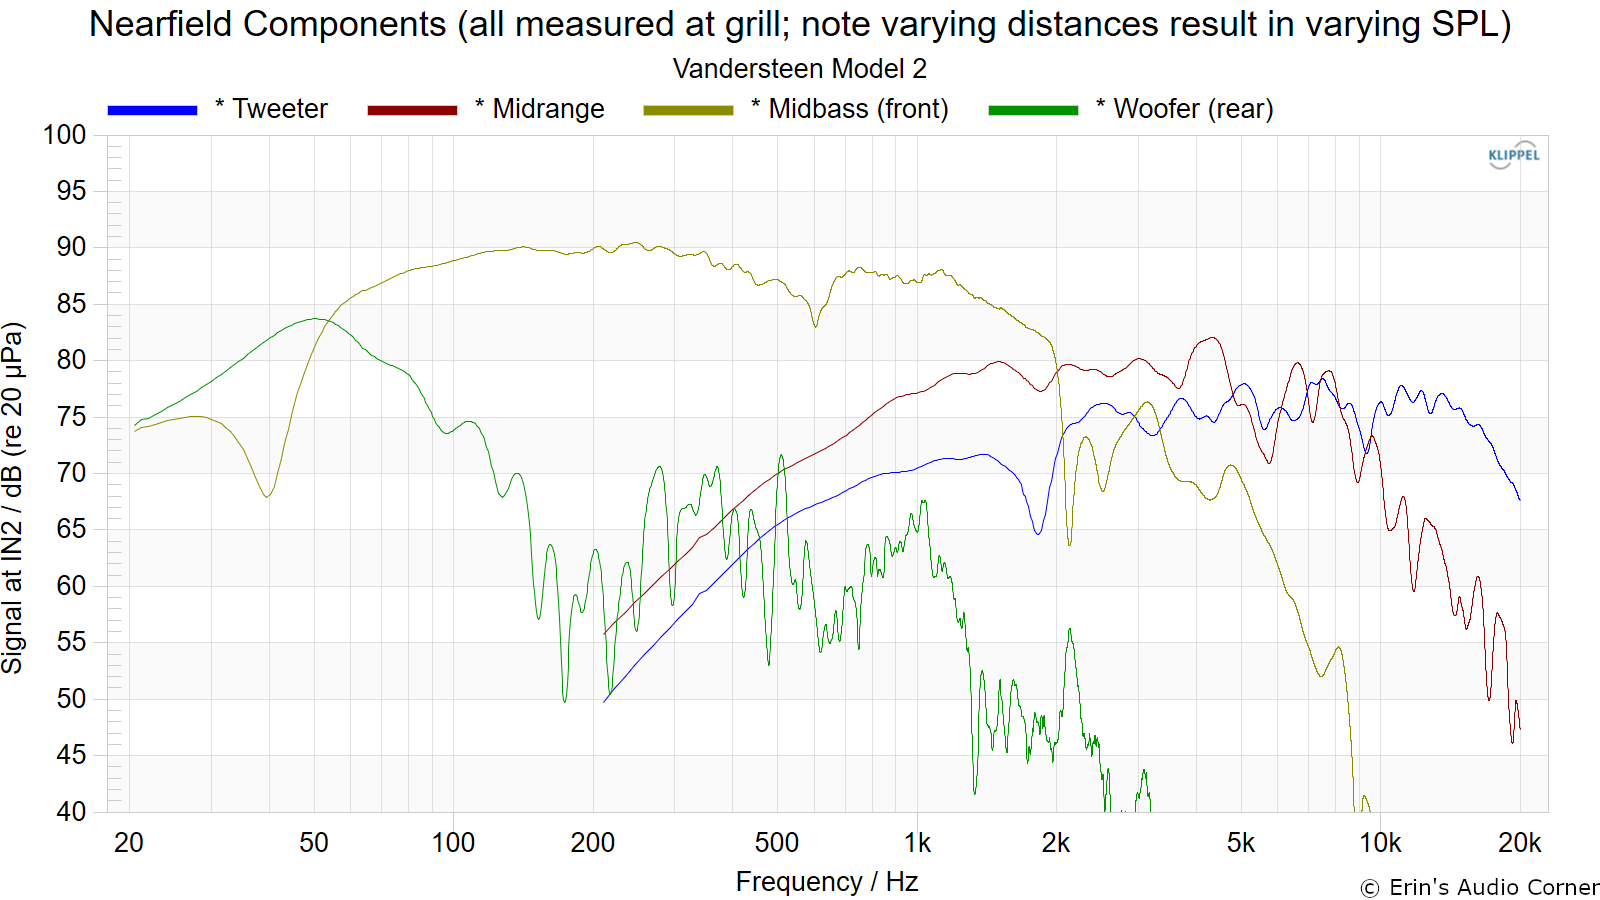
Near-Field Response
Nearfield response of individual drive units. Note, this should only be used as a general guide. The microphone was placed at the grille and thanks to the varying distance of the components (in their step-stair fashion), the mic was never the same distance from each driver.
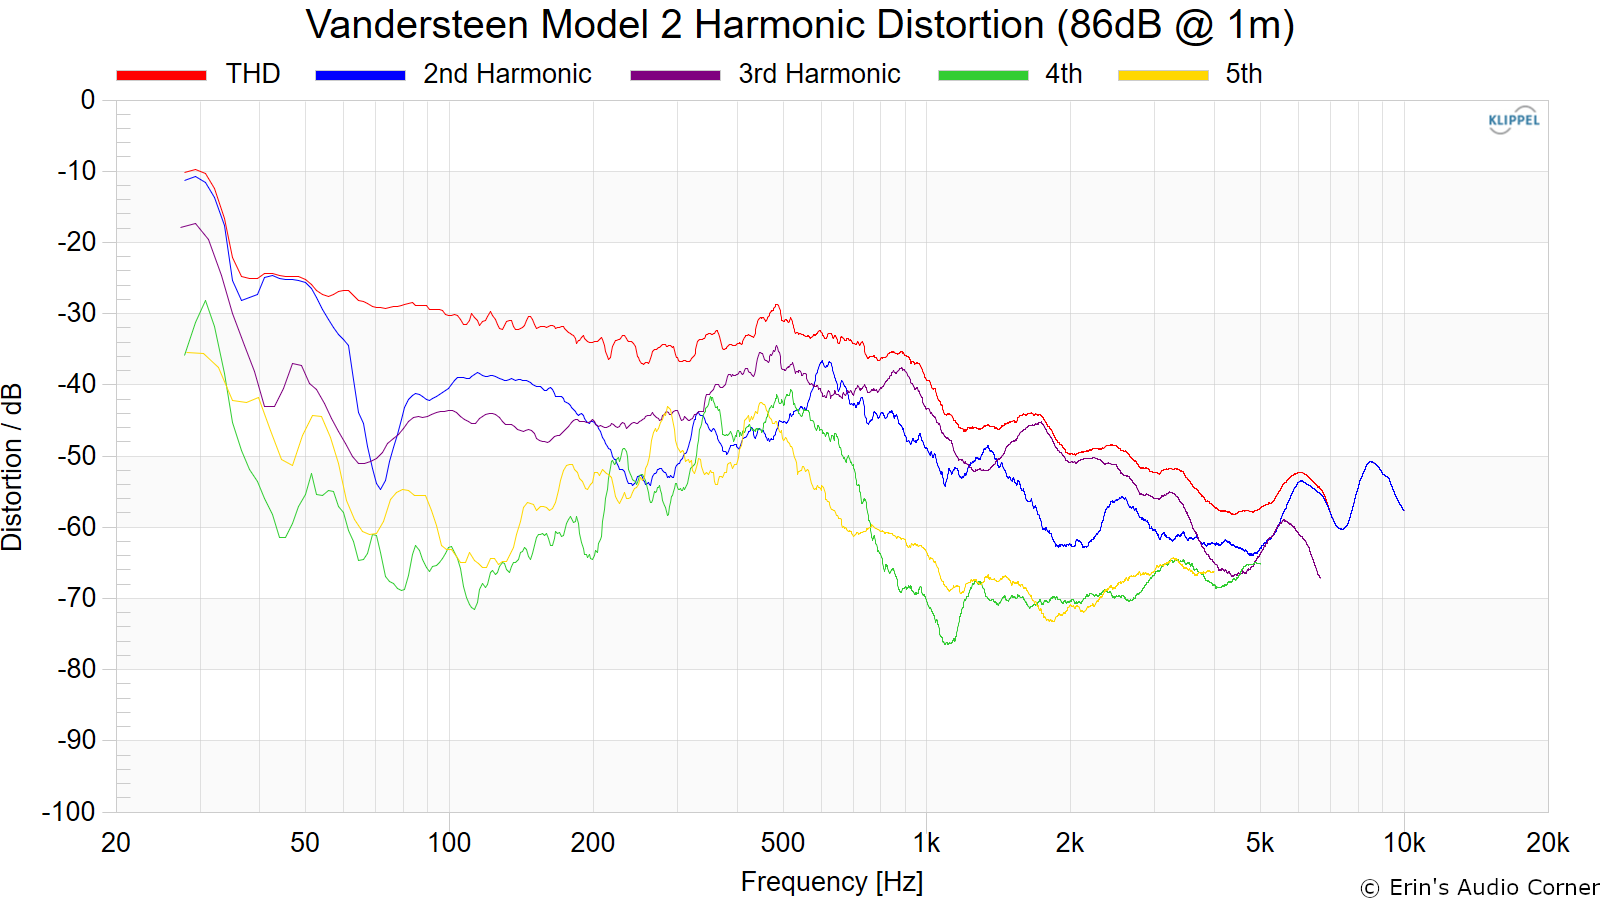
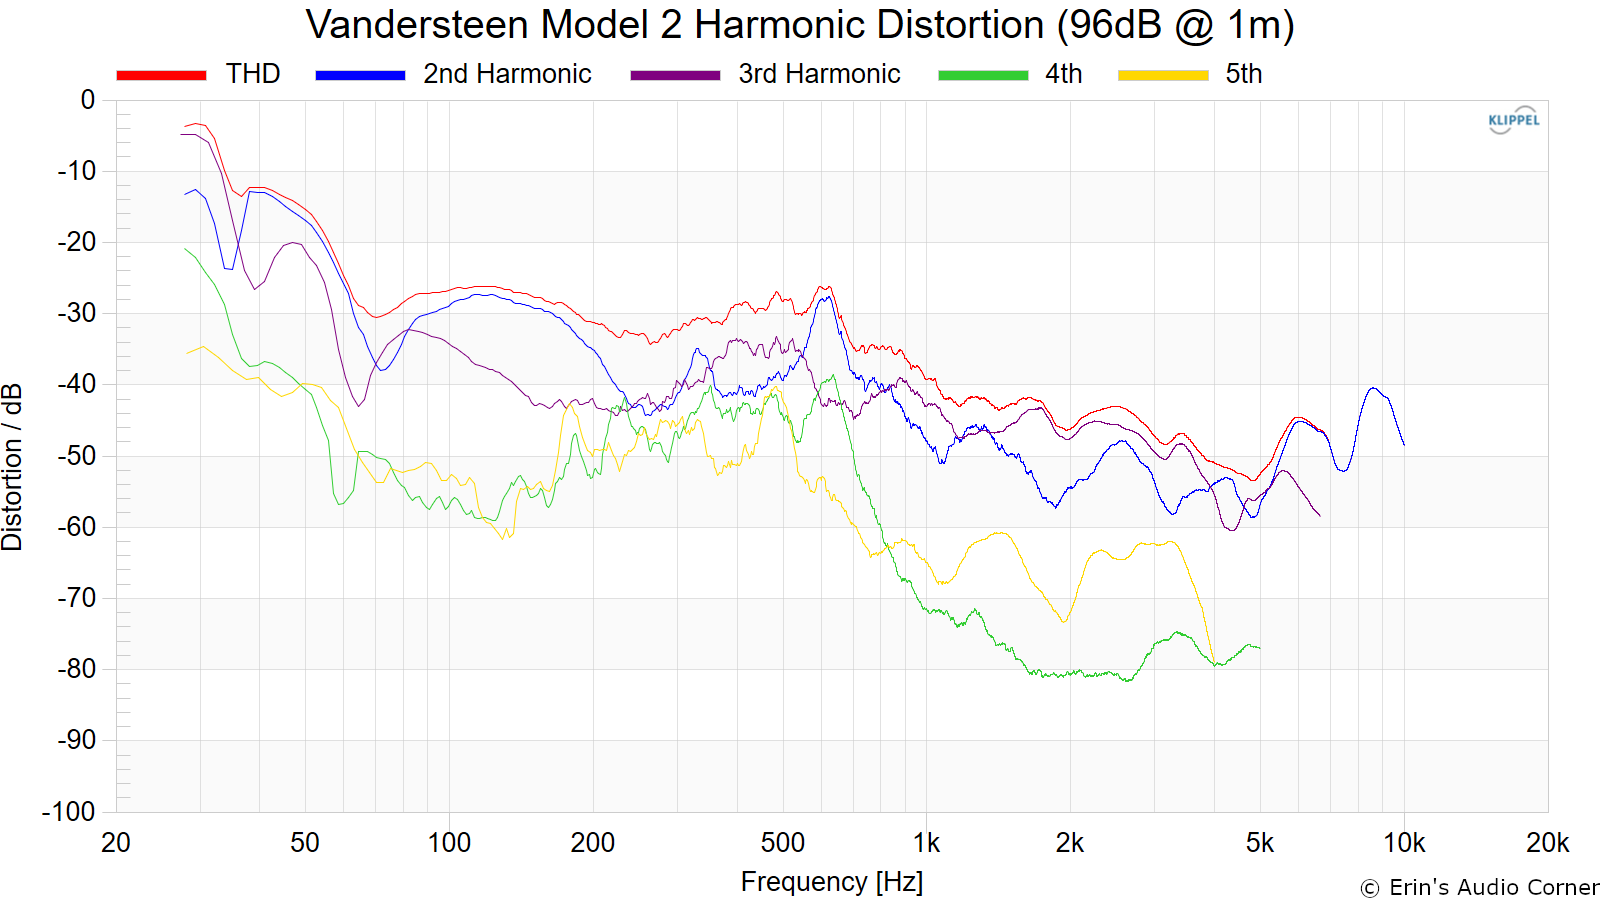
Harmonic Distortion
Harmonic Distortion at 86dB @ 1m:
Harmonic Distortion at 96dB @ 1m:
Dynamic Range (Instantaneous Compression Test)
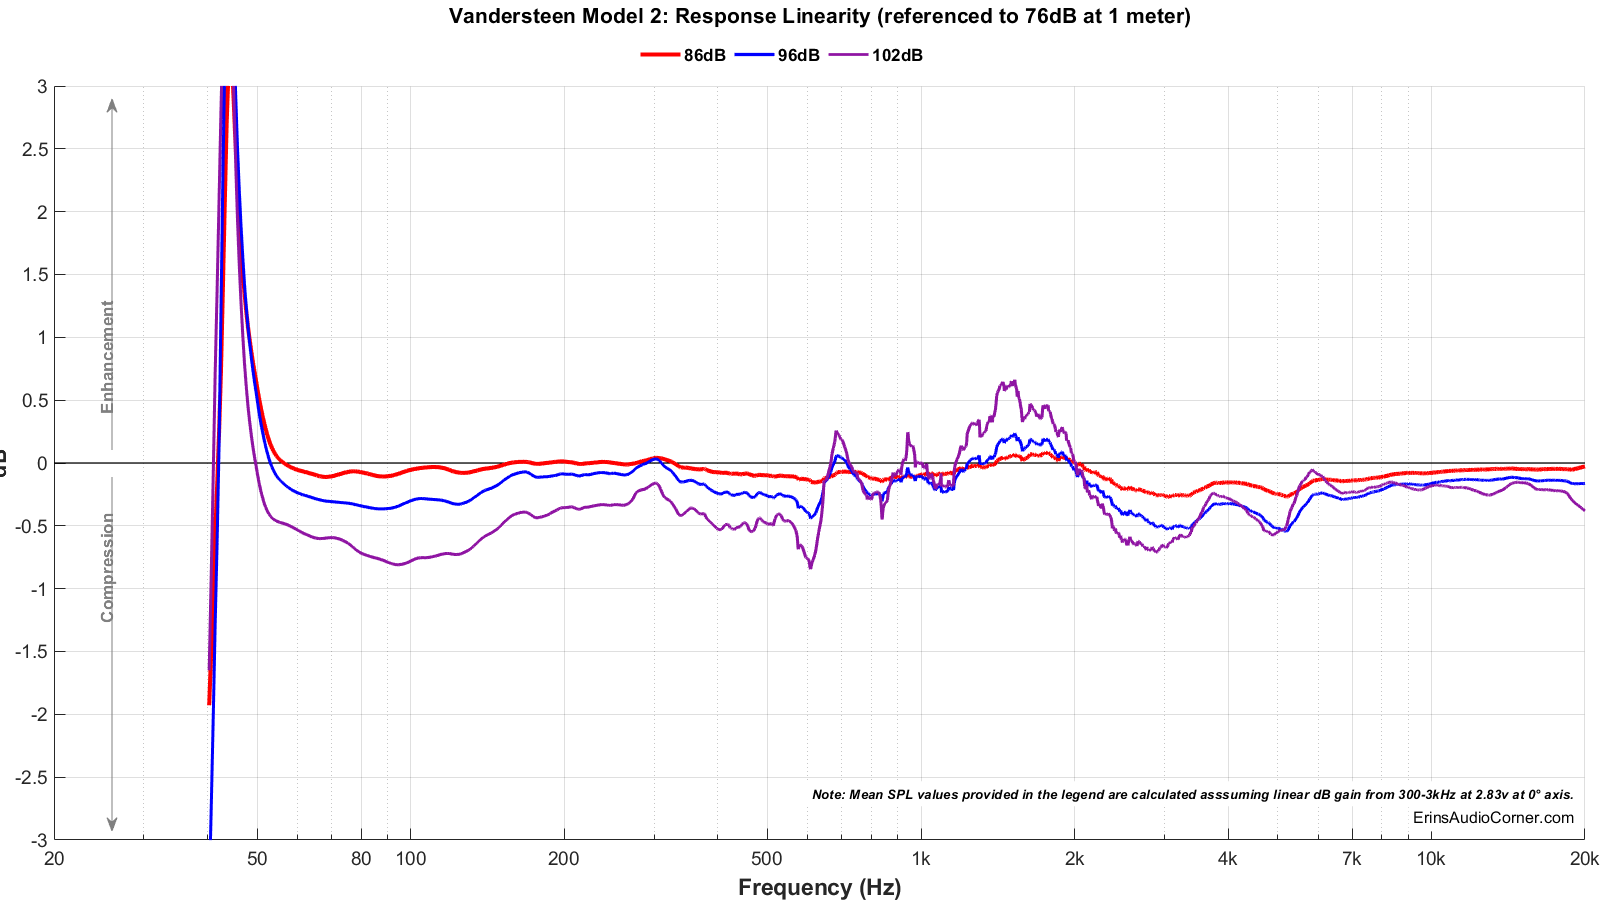
The below graphic indicates just how much SPL is lost (compression) or gained (enhancement; usually due to distortion) when the speaker is played at higher output volumes instantly via a 2.7 second logarithmic sine sweep referenced to 76dB at 1 meter. The signals are played consecutively without any additional stimulus applied. Then normalized against the 76dB result.
The tests are conducted in this fashion:
- 76dB at 1 meter (baseline; black)
- 86dB at 1 meter (red)
- 96dB at 1 meter (blue)
- 102dB at 1 meter (purple)
The purpose of this test is to illustrate how much (if at all) the output changes as a speaker’s components temperature increases (i.e., voice coils, crossover components) instantaneously.
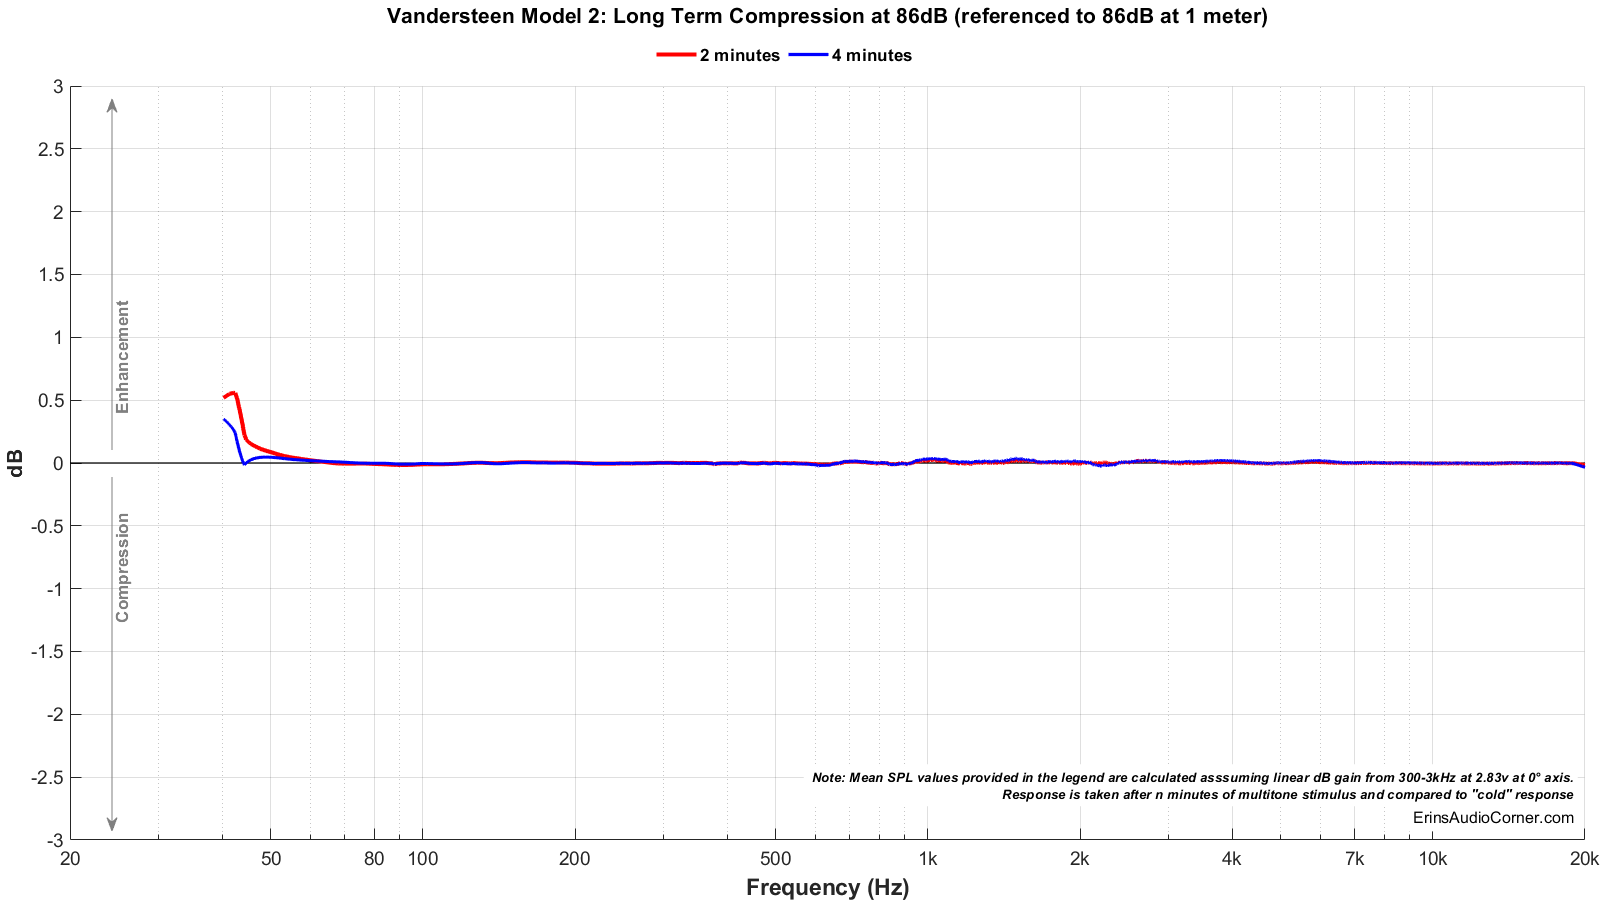
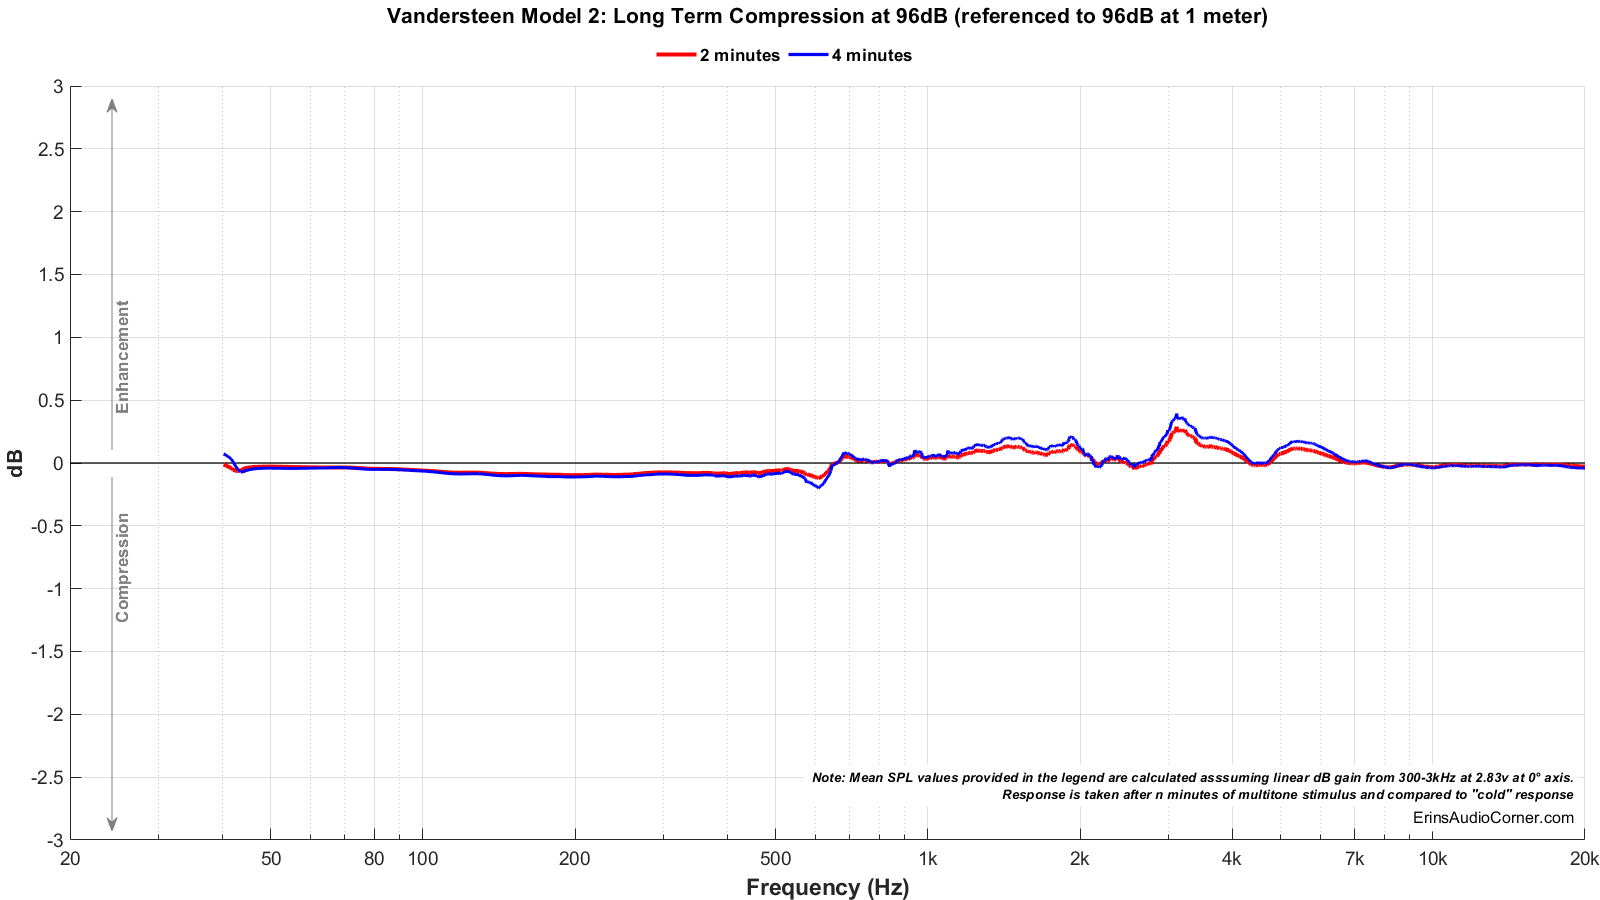
Long Term Compression Tests
The below graphics indicate how much SPL is lost or gained in the long-term as a speaker plays at the same output level for 2 minutes, in intervals. Each graphic represents a different SPL: 86dB and 96dB both at 1 meter.
The purpose of this test is to illustrate how much (if at all) the output changes as a speaker’s components temperature increases (i.e., voice coils, crossover components).
The tests are conducted in this fashion:
- “Cold” logarithmic sine sweep (no stimulus applied beforehand)
- Multitone stimulus played at desired SPL/distance for 2 minutes; intended to represent music signal
- Interim logarithmic sine sweep (no stimulus applied beforehand) (Red in graphic)
- Multitone stimulus played at desired SPL/distance for 2 minutes; intended to represent music signal
- Final logarithmic sine sweep (no stimulus applied beforehand) (Blue in graphic)
The red and blue lines represent changes in the output compared to the initial “cold” test.
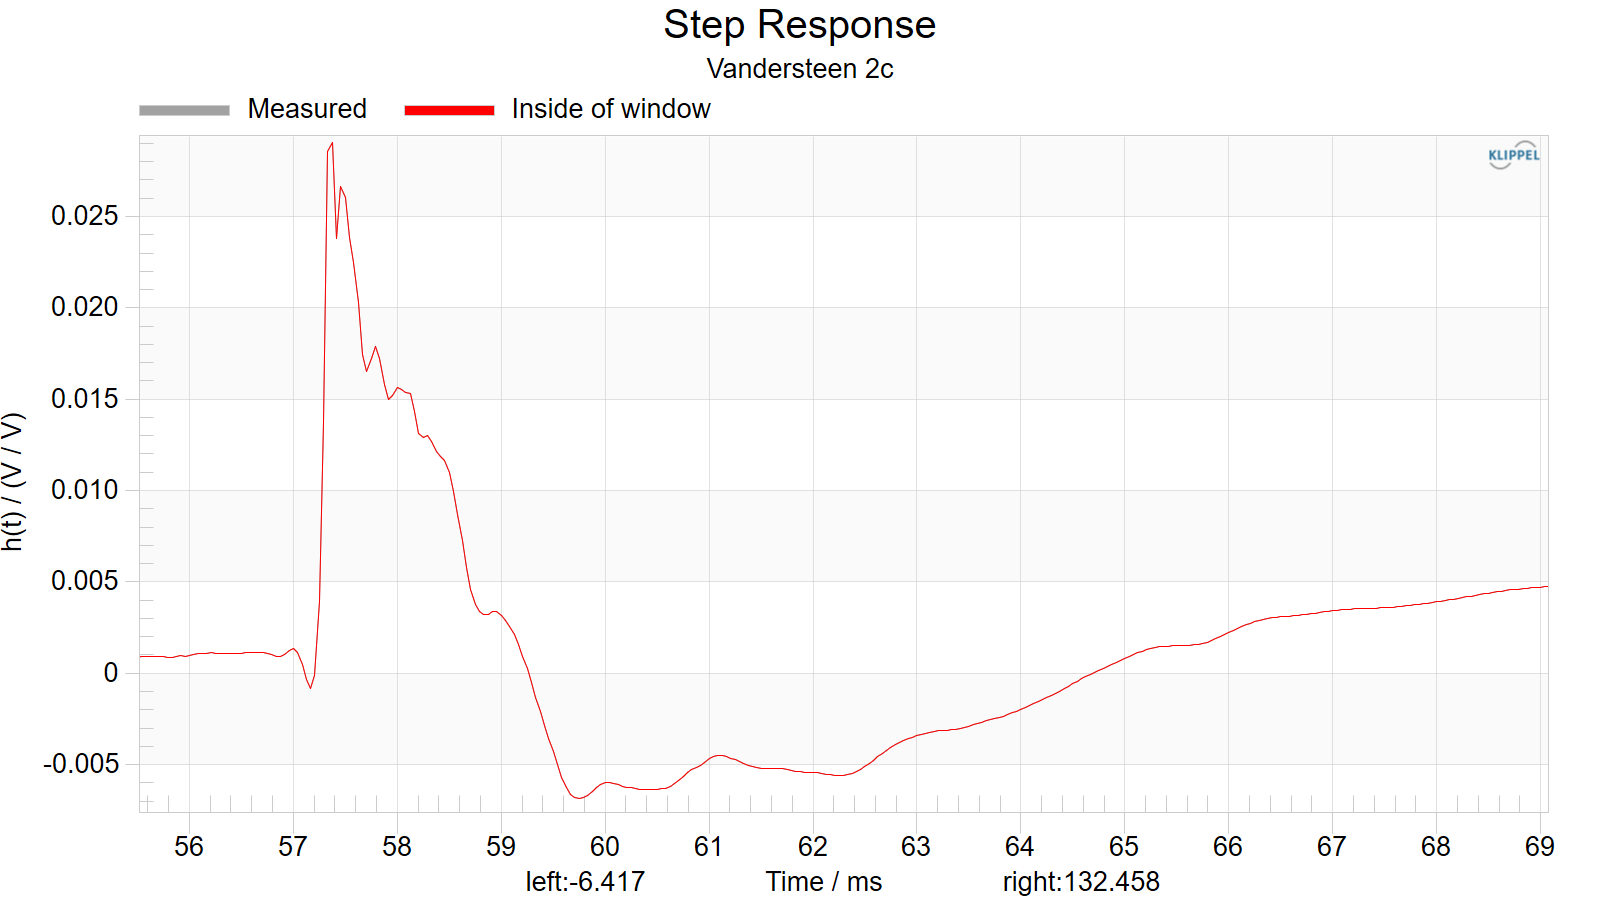
Step Response
Parting / Random Thoughts
If you want to see the music I use for evaluating speakers subjectively, see my Spotify playlist. As with all my other reviews, my listening is done first. I take notes. Then I perform the measurements. This is done simply so I am not biased by having seen the results first. I use the measurements to help me further experiment with speaker positioning or EQ if necessary. But listening is completed before measurements.
Note: I know people are sticklers for positioning and a proper listening experience means time should be taken to find the ideal axis to listen at and place the speakers in the room. While I did not have the OEM stands, I did, of course, take the time to try a few positions and sitting heights to find what worked best in-room. Looking around online, I found the OEM stands have a slight tilt to them so I experimented a bit with that as I moved the speaker about the room as well. Though, I do find it odd that so much attention was put into the physical offset of the drivers to time align them via the large step-stair enclosures yet the design still uses a stand that has a physical tilt as well to time align them. Seems a bit redundant to me. One would think you’d have one or the other and not need stands to do what the actual build of the speaker seemed intent on doing. Moving on… The best location in the room wound up being with the speakers pulled about 3 feet from the front wall which was really no big surprise. In my room nearly every speaker I have listened to thus far has sounded better at about this distance with the exception of a rare few (Dutch & Dutch 8c and a couple other DIY designs that were designed with an anechoic droop so that the listener could place them closer to the front walls). I have seen some say that these sound best facing directly forward but in my case the treble droop and midrange dip were much worse in this case so placing them on-axis yielded the best tonality with a tradeoff of stereo width. That’s normal, though. As for vertical positioning, normally it is assumed the tweeter axis is ideal. I didn’t find documentation stating anything else was ideal and without that I was left to go with the “norm”. But when listening subjectively, I always move above and below the designed (or assumed) target axis. In which case, I did sit both above and below the tweeter. As I state below, sitting above the tweeter line is a bad idea. Sitting below is reasonable but there is a significant loss in HF detail even as you go to -5° of the tweeter line. The speaker sounds quite harsh because the upper-midrange is boosted relative to the treble. And - not surprisingly - the data tells the same story.
I 100% get the nostalgia and draw of this speaker. It’s neat. The fact that you can’t see any drivers is really cool to me. And the legend of the name “Vandersteen” made this a speaker I was curious about. It’s hard to be critical of a speaker design that is now over 30 years old. But that doesn’t mean we can’t look at the results and see how it aligns with our hearing so allow me to make a few quick notes below on that very topic:
- Upon initial listen I was a bit confused. The sound was somewhat odd. A tonality unlike what I’m used to or frankly was expecting. Normally, you quickly get your bearings on a new speaker within a few seconds but this was a speaker that really varied from song to song. Below is why I think this was the case.
- I can’t give any credence to the mechanical offset and time alignment of the drivers. The comb filtering of the speaker (thanks to the baffle step, literally) presents audible issues. I personally believe the desire to properly time align the speaker’s drivers was a novel idea but not at the expense of the frequency response comb filters that are evident in the data. You’re hearing (and seeing) ±2dB or more swings in the treble and that really messed with me when I was listening. Some songs sounded sharp where others sound rather dull. It was very song dependent and when I looked at the data I couldn’t help but surmise what I heard was due to the comb filtering I saw in the data. It seems logical, really; if you have an instrument that plays 1.2kHz and another that plays 1.5kHz as their fundamental tones then you have a 3dB delta between them. This kind of thing pervaded the rest of the response.
- Vocals sound a bit subdued in the midrange and I found myself playing around with the knobs on the back to get the right balance. When I looked at the data I saw why; the 2-3dB dip from 400Hz to 1kHz. Boosting the midrange via the knob on the back kind of helps but it also makes the upper midrange rather painful. So, it’s a double-edged sword.
- The soundstage was an odd duck. I didn’t think it was wide or deep in an unconventional way. I found the width to be rather narrow and the positioning of the listener really needs to be directly on axis with the tweeter. You can go below the tweeter but you can’t go above because there is a lot of sound lost in the midrange and high frequency. I wonder how much of this is due to the wood frame.
- These things need power. And the sensitivity shows us why. Though, the impedance is rather benign so a regular old’ amp should have no problem driving these.
Overall this was a fun experience and enlightening. Given the design is 30+ years old, I would really like to see and hear what modern Vandersteen speakers are capable of today. I did email Vandersteen a year ago to request a loaner sample of speakers to review but didn’t receive a reply (which is kind of the norm so I didn’t take offense). Maybe in the future I will have the opportunity to test modern Vandersteen speakers so keep an eye out… you never know.
As stated in the Foreword, this written review is purposely a cliff’s notes version. For more details about the performance (objectively and subjectively) please watch the YouTube video.
Support the Cause
If you like what you see here and want to help support the cause there are a few ways you can do so:
-
Using my Amazon affiliate links which helps me gain a small commission at no additional cost to you.
Your support helps me pay for new items to test, hardware, miscellaneous items and costs of the site’s server space and bandwidth and is very much appreciated.
You can also join my Facebook and YouTube pages if you’d like to follow along with updates.